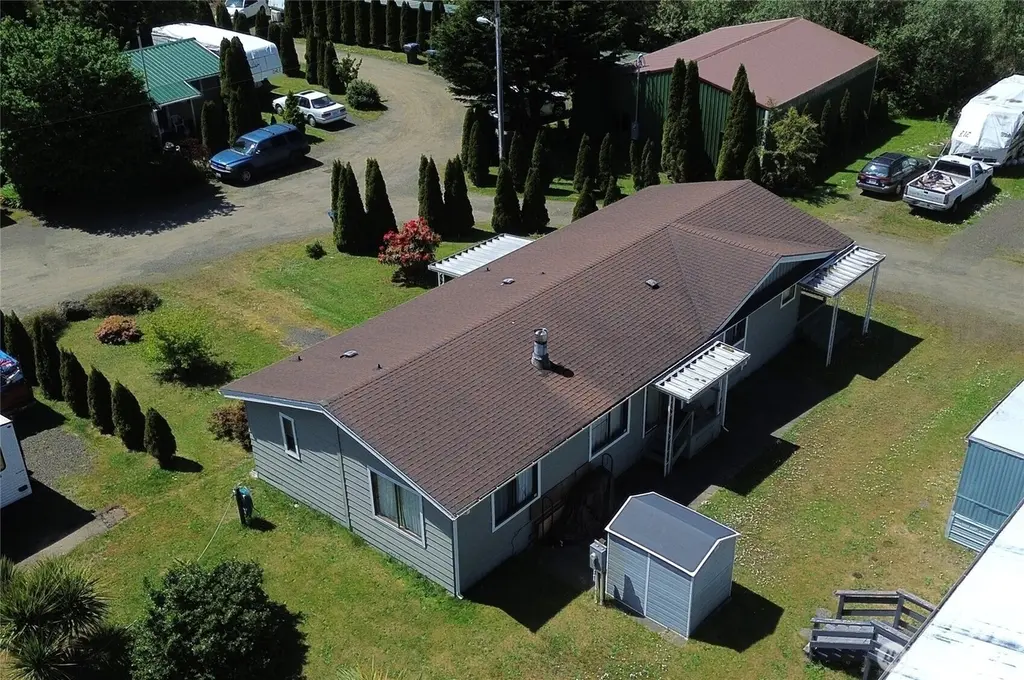
1845 S Montesano St #401 · Cohassett Beach, WA
Flood risk 1/10 · Minimal
- FEMA flood zone
- X (unshaded)
- Chance of flooding over 30 yrs
- 0.0%
- Est. flood insurance / yr
- $507 – $1,088
Fire risk 1/10 · Minimal
- Est. fire insurance / yr
- $604 – $1,122
Heat risk 1/10 · Minimal
- Hot days now (above 73°F)
- 7 days/yr
- Hot days in 30 yrs
- 18 days/yr
Wind risk 1/10 · Minimal
- Chance of severe wind over 30 yrs
- —
Air-quality risk 5/10 · Moderate
- Unhealthy air days now
- 6 days/yr
- Unhealthy air days in 30 yrs
- 6 days/yr
Risk factors via First Street. Map © Google.
Why this score? — see what drove the B- grade
The composite is a weighted blend of 9 inputs, each scored 0–100. Each bar is that input's sub-score; the figure is the points it added to the 100-point composite (weight × sub-score).
- Cash flow +30.0/30.0
- 1% rule +10.0/10.0
- DSCR +10.0/10.0
- ARV discount +7.5/15.0
- Schools +3.9/10.0
- Livability +3.1/5.0
- Rent growth +2.5/5.0
- Condition / age +2.5/5.0
- Appreciation +0.0/10.0
$99,000
🖨 Deal sheet (PDF) 📄 Offer letter ✓ Due diligence
Listing remarks
Affordable Living in Westport! Own your own home while leasing the land in a peaceful park setting. This spacious 1982 doublewide is the largest home in Hammond RV Park and offers comfortable, affordable coastal living with plenty of room to spread out. Featuring 2 bedrooms, 2 bathrooms, and 1,420 square feet, this well-maintained home has seen numerous updates, including a new furnace and heat pump, newly installed water filtration system, updated flooring, and fresh interior and exterior paint. The bright and open floorplan includes both a living room and separate family room, with large windows that fill the home with natural light. Inside, enjoy a cozy fire in the fireplace during stor
Key facts
- Two parking areas
- Extra storage shed
- Updated flooring
Tags
Property features AI
Finance
- Other: Mobile home remains
- Financial info: Listing terms: Cash
- HOA & community: Located in Hammond RV park (park approved for sale); Pets allowed: cats OK; Senior exemption available; Land lease: $500/month
Exterior
- Parking: 2 open uncovered parking spaces
- Utilities: Public water; Public sewer; Electric power; Power by GH PUD
- Home design: Manufactured single-wide home; One level; South-facing
- Construction: Metal/Vinyl construction; Composition roof; Tie-down foundation; Manufactured after 6/15/1976
- Exterior features: Metal/vinyl exterior; Metal skirting; Patio/porch/deck; Awnings
Interior
- Kitchen: Refrigerator; Stove/Range
- Bedrooms: 2 bedrooms
- Flooring: Laminate
- Bathrooms: 2 full bathrooms; 2 bathtubs; 2 showers
- Heating & cooling: Forced air heating; Heat pump; Forced air cooling; Heat pump cooling
- Interior features: Fireplace; Water heater (electric, located in closet); Kitchen with eating space; Jetted/soaking tub; Walk-in closet; Awnings; Patio/porch/deck
- Laundry & utility: Laundry available in park
Neighborhood map
What this means for you Summary
Snapshot
- This is a 2-bed/2.0-bath manufactured listed at $99k.
Deal economics
- At list price, monthly cash flow is $540 ($6k/yr) — positive.
- The deal already cash-flows at list — no discount required.
- Meets the 1% rule at list price ($2k rent vs $99k).
- Recommended offer: $98k (1.5% below list) — sets the bar for market timing.
Location & tenants
- Location reads 62/100 on livability (#408 in WA) — a middle-class / working-renter tenant base. Strengths: housing A+, cost of living B; Watch: health & safety C-, crime F, amenities F.
- Ocosta School District (rural): math 39% / reading 50% proficiency, ranked #196 of 291 in WA (top 67%) — families likely to look elsewhere, expect single-tenant / working-renter base with shorter leases; 60% free/reduced lunch — lower-income household profile, screen leases tightly.
- Zoned schools: Ocosta Elementary School (325 students, 67% FRL); Ocosta Junior - Senior High (243 students, 62% FRL) — zoned schools at 64% FRL track the district average.
- Market conditions: 121 active listings in the ZIP; 2 comparable units currently listed for rent nearby; 297 units permitted in Grays Harbor County in 2024 (17 in 5+ unit buildings).
Forward outlook
- Local home prices are declining (-3.0%/yr); year-one equity from $684 of loan paydown is wiped out by about $3k of value loss. Plan a longer hold.
- Grays Harbor County population projected at -24% by 2050 — secular population decline; favor cash flow + early exit over multi-decade hold.
- At projected returns (-3.0% appreciation + 3.0% rent growth), your $28k cash investment doubles in ~6 years — after that, you're playing with house money.
Negotiation context
- It's been on market 26 days — a 2% lower offer ($98k) is reasonable based on typical stale-listing flexibility.
- 2 sale attempts since 4y ago with the ask held roughly flat each time — persistent listings suggest the price (not the market) is what's stuck; bring a comps-based counter.
- Current owner paid $75k; 32% above their basis — modest negotiation headroom, anchor on the comps not their cost.
Questions for the listing agent
- Is there a deadline driving the sale (1031 exchange, divorce, estate, relocation)? That informs how much negotiation room exists.
- Crime grade is F in this area — have there been break-ins, vandalism, or insurance claims at this property in the last 3 years? What carrier currently insures it and at what premium?
- What's the average days-on-market for RENTAL listings here right now (not sales)? A rising rental-DOM trend means longer vacancies and softer asking-rent achievability than the comps imply.
- What's the recent tenant-quality profile in this submarket — average credit score on applications, eviction rate, late-payment / NSF rate, and stable-employment percentage? A property-management company in the area should have these aggregated.
- How much new for-sale + rental construction is in the pipeline within 1–3 miles? Heavy new supply typically softens prices + rents 12–24 months out; constrained supply supports both.
Investment metrics
- 1% rule
- 1.57% ✓
- Cap rate
- 12.84%
- Cash-on-cash
- 23.39%
- DSCR
- 2.04
- GRM
- 5.3
CMA / ARV
- ARV (on-the-fly)
- $226,080
- Comps found
- 2
Show comp detail 2 sales within ~0.75 mi
| Address | Dist | Beds/Ba | Sqft | Sold | Price | $/sf | Match |
|---|---|---|---|---|---|---|---|
| 2109 S Montesano St | 0.19mi | 3/2.0 (+1) | 1,464 (+2%) | 19mo | $230,000 | $157 | 68 |
| 2315 Pleasant Dr S | 0.34mi | 2/2.0 | 1,288 (-11%) | 2mo | $175,000 | $136 | 65 |
Match score weights: distance 35% · size 25% · config 20% · recency 20%. Top-matched comps best support the ARV.
Projected returns pro-forma
-3.0% appreciation · 3.0% rent growth · sell at horizon
- IRR
- 16.5%
- Equity multiple
- 1.66×
- Total profit
- $18,395
- Equity at exit
- $14,761
- IRR
- 25.0%
- Equity multiple
- 3.18×
- Total profit
- $60,427
- Equity at exit
- $8,560
Cash invested: $27,720 (down + closing). Projections, not guarantees.
Landlord ↔ Tenant lean methodology
- Overall (STATE)
- 28 Tenant-Leaning
- State Washington
- 28 Tenant-Leaning · D+8
- County
- — inherits STATE
- City
- — inherits STATE
ZIP-level market 98595
- Active inventory
- 121
- Price-to-rent
- 5.3×
Monthly cashflow live
- Estimated rent
- $1,550 medium interval (Pro) →
- Mortgage (P&I)
- −$519
- Tax est. 1.5%
- −$124 /mo · $1,485/yr
- Insurance
- −$41
- HOA
- −$0
- Vacancy / Maint / Mgmt
- −$326
- Net cashflow
- $540
Break-even live
Sensitivity live
| Price | -10% $609 | -5% $575 | +0% $540 | +5% $506 | +10% $472 |
|---|---|---|---|---|---|
| Rent | -10% $418 | -5% $479 | +0% $540 | +5% $602 | +10% $663 |
| Rate | -1.0pp $590 | -0.5pp $566 | base $540 | +0.5pp $515 | +1.0pp $489 |
UW: 25.0% down · 7.5% · 30yr · 1.5% tax · 5.0% vac · 8.0% maint · 8.0% mgmt
Financing live
Cash to close
- Down payment
- $24,750
- Closing costs
- $2,970
- Reserves months
- —
- Total cash needed
- —
Loan-product check · same deal, 3 products live
Conventional
25% down · 7.5% · 30yr
- Down + closing
- —
- Monthly P&I
- —
- Monthly cashflow
- —
- DSCR
- —
- Eligible?
- —
Personal DTI + credit; lowest rate.
DSCR
20% down · 8.5% · 30yr
- Down + closing
- —
- Monthly P&I
- —
- Monthly cashflow
- —
- DSCR
- —
- Eligible?
- —
No personal income docs; deal must DSCR.
Hard money
10% down · 12.0% · 12mo
- Down + closing
- —
- Monthly P&I
- —
- Monthly cashflow
- —
- DSCR
- —
- Eligible?
- —
Short-term bridge; refi at stabilization.
Rent comps 2 comps
| Address | Beds | Baths | Sqft | Rent | $/sqft | DOM | Units | Dist |
|---|---|---|---|---|---|---|---|---|
| 210 W Pacific Ave Unit 1 Westport, WA | 3.0 | 1.5 | 1200 | $1,550 | $1.29 | 44d | 1 | 1.42mi |
| 210 W Pacific Ave Westport, WA | 3.0 | 1.0 | 1200 | $1,550 | $1.29 | 44d | 1 | 1.42mi |
Listing history 19 events
-
2026-06-21days on market $99,000 Active 26 DOM
-
2026-06-19days on market $99,000 Active 24 DOM
-
2026-06-18days on market $99,000 Active 23 DOM
-
2026-06-17days on market $99,000 Active 22 DOM
-
2026-06-16days on market $99,000 Active 21 DOM
-
2026-06-15days on market $99,000 Active 20 DOM
-
2026-06-14days on market $99,000 Active 18 DOM
-
2026-06-12days on market $99,000 Active 17 DOM
-
2026-06-09days on market $99,000 Active 14 DOM
-
2026-06-08days on market $99,000 Active 13 DOM
-
2026-06-07days on market $99,000 Active 12 DOM
-
2026-06-05days on market $99,000 Active 9 DOM
-
2026-06-02days on market $99,000 Active 7 DOM
-
2026-06-01days on market $99,000 Active 6 DOM
-
2026-05-31days on market $99,000 Active 5 DOM
-
2026-05-30days on market $99,000 Active 4 DOM
-
2026-05-26$99,000 Active
-
2022-03-28soldstatus $75,000
-
2022-03-28$75,000
ⓘ Source: listings_history table (triggers on properties + properties_extension) + one-shot
backfill from property_details.listing_events for pre-trigger history.
Climate risk First Street
- Flood 1/10 Low FEMA zone X (unshaded) · 0% chance over 30 yrs
- Wildfire 1/10 Low
- Heat 1/10 Low 7 d/yr ≥73°F today · 18 d/yr by 30 yrs out
- Wind 1/10 Low
- Air quality 5/10 Major 6 unhealthy d/yr today · 6 by 30 yrs out
Nearby sold comps map
Loading sold comps map…
Walkable amenities ~0.75 mi
Loading nearby amenities…
Taxation est. · year 1
- Rental income
- $18,600
- − Mortgage interest
- −$5,546
- − Property taxes
- −$1,485
- − Insurance
- −$495
- − Repairs & maintenance
- −$1,488
- − Management
- −$1,488
- − Depreciation
- −$2,880
- Taxable income
- $5,218
- Est. tax owed @ 24.0%
- −$1,252
- After-tax cash flow
- $5,232/yr
For passive investors: Depreciation is non-cash, so a rental often shows a tax loss while cash-flowing — sheltering income. Rental losses are passive: they offset passive income freely, and up to $25,000/yr can offset ordinary (W-2) income if you actively participate and your MAGI is under $100k (phasing out to $0 by $150k); unused losses carry forward. On sale, claimed depreciation is recaptured at up to 25%, and gains may owe capital-gains tax (a 1031 exchange can defer both). Figures are a year-1 estimate at your 24.0% rate — not tax advice; consult a CPA.
Schools (NCES district)
- District
- Ocosta School District
- NCES district ID
- 5306090
- Math proficiency
- 39% ▲ 1.00%
- Reading proficiency
- 50% ▼ -1.00%
- Median HH income
- $36,877
- Composite
- 39.19/100
- National rank
- #8222
- State rank
- #196 of 291 in WA
Livability — Cohassett Beach
- Score
- 62/100
- State rank
- #408
- US rank
- #16227
Category grades
Schools grade is shown separately in the Schools card above.
Census & demographics
- Census place
- Cohassett Beach, WA
- Population (ZIP)
- 2,591
Population outlook (Grays Harbor County) Hauer SSP2
- Today (2025)
- 66,443 people
- By 2030
- 63,255 · -4.8%
- By 2040
- 56,466 · -15.0%
- By 2050
- 50,516 · -24.0%
- By 2075
- 39,296 · -40.9%
- By 2100
- 31,142 · -53.1%
Race, ethnicity, and origin ACS 2023
- Neighborhood character
- Predominantly White (87%)
- Race & ethnicity
- White 87% Hispanic / Latino 11% Two or more races 1%
- Hispanic origin (detail)
- Mexican 8%
- Common ancestry
- Portuguese 12% Scottish 5% Iranian 4%
- Foreign-born
- 6% · Canada
- Languages at home
- 85% English-only · Spanish 10% Russian/Polish/Slavic 4% Other Indo-European 1%
Political lean MEDSL · Grays Harbor
- 2024 margin
- Lean R (+6.0) · D 45.6% · R 51.6% · Other 2.8%
- 2008→2024 swing
- -20.6pp toward R · 2008: 14.6pp · 2024: -6.0pp
- All cycles
- 2024: R+6.0 2020: R+6.6 2016: R+7.1 2012: D+14.0 2008: D+14.6
Not yet ingested
- Civics
- —
Market trends
- HPI YoY
- ▼ -135.90%
- Current HPI
- 233.666
- Rent YoY
- —
- Metro
- —
- State GDP YoY
- ▲ 4.65%
- F500 in state
- 22
Industry mix (Fortune 500 HQ in WA)
| Industry | F500 HQs | Revenue |
|---|---|---|
| Retail | 2 | $269B |
|
||
| Technology / Retail | 1 | $638B |
|
||
| Technology | 1 | $245B |
|
||
| Telecommunications | 1 | $38B |
|
||
| Food / Beverage | 1 | $36B |
|
||
| Automotive / Trucks | 1 | $34B |
|
||
Price history
+32.0% since first listed3 events — show timeline
- 2026-05-26 Listed $99,000 NWMLS as Distributed by MLS Grid
- 2022-03-28 Listed $75,000 NWMLS as Distributed by MLS Grid
- 2022-03-28 Sold (MLS) $75,000 NWMLS as Distributed by MLS Grid
Property tax history
-2.4%/yrLatest (2024): $185 · -4.9% YoY. Source: county tax records.
Cash-flow waterfall
monthlySold comps — $/sqft
last 12 mo · ≤1 miLoading sold comps…