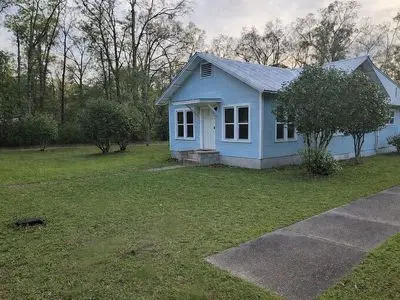
354 Florence St · DeFuniak Springs, FL
Flood risk 1/10 · Minimal
- FEMA flood zone
- X (unshaded)
- Chance of flooding over 30 yrs
- 0.0%
- Est. flood insurance / yr
- $507 – $1,088
Fire risk 4/10 · Minor
- Est. fire insurance / yr
- $947 – $1,759
Heat risk 9/10 · Severe
- Hot days now (above 107°F)
- 7 days/yr
- Hot days in 30 yrs
- 20 days/yr
Wind risk 9/10 · Severe
- Chance of severe wind over 30 yrs
- 99.0%
Air-quality risk 1/10 · Minimal
- Unhealthy air days now
- 0 days/yr
- Unhealthy air days in 30 yrs
- 0 days/yr
Risk factors via First Street. Map © Google.
Why this score? — see what drove the C grade
The composite is a weighted blend of 9 inputs, each scored 0–100. Each bar is that input's sub-score; the figure is the points it added to the 100-point composite (weight × sub-score).
- Cash flow +14.4/30.0
- ARV discount +12.6/15.0
- Appreciation +10.0/10.0
- Schools +5.2/10.0
- DSCR +4.4/10.0
- 1% rule +3.4/10.0
- Livability +3.2/5.0
- Rent growth +2.5/5.0
- Condition / age +2.5/5.0
$180,000
🖨 Deal sheet 📄 Offer letter ✓ Due diligence
Listing remarks MLS
Within walking distance to Lake Defuniak! Take a look at this charming Florida cottage with a mix of updated and original finishings. With a little elbow grease, this home could be a great starter or retirement home. Great corner lot with a block storage building.
Key facts
- Metal roof
- Hurricane clips
- Electrical redone
Tags
Neighborhood map
What this means for you Summary
Snapshot
- This is a 3-bed/1.0-bath single-family listed at $180k.
Deal economics
- At list price, monthly cash flow is $36 ($429/yr) — positive.
- The deal already cash-flows at list — no discount required.
- To meet the 1% rule (rent ≥ 1% of price), the offer needs to be $151k (16.4% below list).
- Recommended offer: $151k (16.4% below list) — sets the bar for 1% rule.
- Cap rate 6.5% vs local median 4.8% in DeFuniak Springs — top-decile yield for the area; either an underpriced asset or a hidden risk that comps aren't pricing in. Stress-test before assuming the spread holds.
Location & tenants
- Location reads 64/100 on livability (#694 in FL) — a middle-class / working-renter tenant base. Strengths: cost of living A+, housing A+; Watch: health & safety C-, schools D+, crime D.
- Walton (rural): math 62% / reading 61% proficiency, ranked #10 of 73 in FL (top 14%) — acceptable for families but not a draw, mixed tenant base, ~2y average lease.
- Market conditions: 122 active listings in the ZIP; 5 comparable units currently listed for rent nearby; rentals at typical pace (median 21d on market — plan ~3-4 weeks tenant-placement turnaround); 2,883 units permitted in Walton County in 2024 (1,322 in 5+ unit buildings).
Forward outlook
- In year one you build about $19k of equity ($1k loan paydown + $18k appreciation (10.0% local appreciation)).
- Walton County population projected at +46% by 2050 — long-run rental-demand tailwind backs the buy-and-hold thesis.
- At projected returns (10.0% appreciation + 3.0% rent growth), your $50k cash investment doubles in ~3 years — after that, you're playing with house money.
- By year 2, paydown + projected appreciation supports a ~$31k cash-out refi (75% LTV) — recoverable capital for the next deal without selling this one.
Negotiation context
- Only 9 days on market — expect competitive offers; lowballing is unlikely to land.
- 2 sale attempts since 7y ago with the ask held roughly flat each time — persistent listings suggest the price (not the market) is what's stuck; bring a comps-based counter.
- Current owner paid $70k; list at $180k implies a 157% gain — meaningful room to come down on a strong offer.
Risks & watch-outs
- Climate carrying-cost: severe wind risk, 99% chance of damaging wind over 30y; extreme-heat days projected 7→20/yr by 2055 (HVAC capex compounding) — expect insurance premiums to compound above CPI over the hold.
Questions for the listing agent
- Built in 1975 — when were the roof, HVAC, electrical panel, plumbing, and water heater last replaced?
- Is there a deadline driving the sale (1031 exchange, divorce, estate, relocation)? That informs how much negotiation room exists.
- Schools are D-rated, which usually means shorter tenancies and higher turnover. Who's the typical renter profile here, and what's been the actual vacancy rate?
- Crime grade is D in this area — have there been break-ins, vandalism, or insurance claims at this property in the last 3 years? What carrier currently insures it and at what premium?
- What's the average days-on-market for RENTAL listings here right now (not sales)? A rising rental-DOM trend means longer vacancies and softer asking-rent achievability than the comps imply.
- What's the recent tenant-quality profile in this submarket — average credit score on applications, eviction rate, late-payment / NSF rate, and stable-employment percentage? A property-management company in the area should have these aggregated.
- How much new for-sale + rental construction is in the pipeline within 1–3 miles? Heavy new supply typically softens prices + rents 12–24 months out; constrained supply supports both.
Investment metrics
- 1% rule
- 0.84% ✗
- Cap rate
- 6.53%
- Cash-on-cash
- 0.85%
- DSCR
- 1.04
- GRM
- 10.0
CMA / ARV
- ARV (on-the-fly)
- $203,246
- Comps found
- 3
Show comp detail 3 sales within ~0.75 mi
| Address | Dist | Beds/Ba | Sqft | Sold | Price | $/sf | Match |
|---|---|---|---|---|---|---|---|
| 59 Davis St | 0.24mi | 3/2.0 | 1,343 (-0%) | 23mo | $252,500 | $188 | 65 |
| 42 Roosevelt Ave | 0.38mi | 4/2.0 (+1) | 1,276 (-5%) | 3mo | $193,000 | $151 | 62 |
| 411 E Sloss Ave | 0.59mi | 4/2.0 (+1) | 1,536 (+14%) | 0mo | $199,000 | $130 | 40 |
Match score weights: distance 35% · size 25% · config 20% · recency 20%. Top-matched comps best support the ARV.
Projected returns pro-forma
10.0% appreciation · 3.0% rent growth · sell at horizon
- IRR
- 24.9%
- Equity multiple
- 2.99×
- Total profit
- $100,276
- Equity at exit
- $162,158
- IRR
- 22.0%
- Equity multiple
- 6.82×
- Total profit
- $293,441
- Equity at exit
- $349,700
Cash invested: $50,400 (down + closing). Projections, not guarantees.
Landlord ↔ Tenant lean methodology
- Overall (STATE)
- 87 Strongly Landlord-Friendly
- State Florida
- 87 Strongly Landlord-Friendly · R+3
- County
- — inherits STATE
- City
- — inherits STATE
ZIP-level market 32435
- Home prices YoY
- 4.0%
- Active inventory
- 122
- Price-to-rent
- 10.0×
Monthly cashflow live
- Estimated rent
- $1,505 high interval (Pro) →
- Mortgage (P&I)
- −$944
- Tax from tax record
- −$135 /mo · $1,615/yr
- Insurance
- −$75
- HOA
- −$0
- Vacancy / Maint / Mgmt
- −$316
- Net cashflow
- $36
Break-even live
UW: 25.0% down · 7.5% · 30yr · 1.5% tax · 5.0% vac · 8.0% maint · 8.0% mgmt
Financing live
Cash to close
- Down payment
- $45,000
- Closing costs
- $5,400
- Reserves months
- —
- Total cash needed
- —
Loan-product check · same deal, 3 products live
Conventional
25% down · 7.5% · 30yr
- Down + closing
- —
- Monthly P&I
- —
- Monthly cashflow
- —
- DSCR
- —
- Eligible?
- —
Personal DTI + credit; lowest rate.
DSCR
20% down · 8.5% · 30yr
- Down + closing
- —
- Monthly P&I
- —
- Monthly cashflow
- —
- DSCR
- —
- Eligible?
- —
No personal income docs; deal must DSCR.
Hard money
10% down · 12.0% · 12mo
- Down + closing
- —
- Monthly P&I
- —
- Monthly cashflow
- —
- DSCR
- —
- Eligible?
- —
Short-term bridge; refi at stabilization.
Rent comps 5 comps
| Address | Beds | Baths | Sqft | Rent | $/sqft | DOM | Units | Dist |
|---|---|---|---|---|---|---|---|---|
| 712 Bruce Ave Defuniak Springs, FL | 3.0 | 2.0 | 1040 | $1,600 | $1.54 | 13d | 1 | 0.71mi |
| 125 N Davis Ln Apt 133 Defuniak Springs, FL | 3.0 | 1.0 | 925 | $1,250 | $1.35 | 21d | 1 | 0.91mi |
| 90 Andrews Ave Defuniak Springs, FL | 3.0 | 1.0 | 1118 | $1,550 | $1.39 | 13d | 1 | 1.00mi |
| 709 S 11th St Defuniak Springs, FL | 2.0 | 1.0 | 1076 | $1,499 | $1.39 | 21d | 1 | 1.15mi |
| 163 W Chaffin Ave Defuniak Springs, FL | 2.0 | 2.0 | 990 | $1,600 | $1.62 | 21d | 1 | 1.21mi |
Listing history 8 events
-
2026-06-18days on market $180,000 Active 9 DOM
-
2026-06-17days on market $180,000 Active 8 DOM
-
2026-06-16days on market $180,000 Active 7 DOM
-
2026-06-15days on market $180,000 Active 6 DOM
-
2026-06-14days on market $180,000 Active 4 DOM
-
2026-06-13days on market $180,000 Active 3 DOM
-
2026-06-10remarks 695-char remark
-
2026-06-10$180,000 Active 1 DOM
ⓘ Source: listings_history table (triggers on properties + properties_extension) + one-shot
backfill from property_details.listing_events for pre-trigger history.
Tax reassessment forecast FL · Resets to sale price
- Current annual tax
- $1,615 · $135/mo
- Projected year-2 tax
- $1,615 · $135/mo
- Expected delta
- $0/yr ($0/mo · 0.0%)
ⓘ Screening estimate from a state-policy table — verify with the county assessor before closing.
Climate risk First Street
- Flood 1/10 Low FEMA zone X (unshaded) · 0% chance over 30 yrs
- Wildfire 4/10 Moderate
- Heat 9/10 Extreme 7 d/yr ≥107°F today · 20 d/yr by 30 yrs out
- Wind 9/10 Extreme 99% chance of damaging wind over 30 yrs
- Air quality 1/10 Low 0 unhealthy d/yr today · 0 by 30 yrs out
Nearby sold comps map
Loading sold comps map…
Walkable amenities ~0.75 mi
Loading nearby amenities…
Taxation est. · year 1
- Rental income
- $18,065
- − Mortgage interest
- −$10,083
- − Property taxes
- −$1,615
- − Insurance
- −$900
- − Repairs & maintenance
- −$1,445
- − Management
- −$1,445
- − Depreciation
- −$5,236
- Taxable loss
- −$2,660
- Est. tax savings @ 24.0%
- +$638
- After-tax cash flow
- $1,067/yr
For passive investors: Depreciation is non-cash, so a rental often shows a tax loss while cash-flowing — sheltering income. Rental losses are passive: they offset passive income freely, and up to $25,000/yr can offset ordinary (W-2) income if you actively participate and your MAGI is under $100k (phasing out to $0 by $150k); unused losses carry forward. On sale, claimed depreciation is recaptured at up to 25%, and gains may owe capital-gains tax (a 1031 exchange can defer both). Figures are a year-1 estimate at your 24.0% rate — not tax advice; consult a CPA.
Schools (NCES district)
- District
- Walton
- NCES district ID
- 1201980
- Math proficiency
- 62% ▼ -4.00%
- Reading proficiency
- 61% ▼ -2.00%
- Median HH income
- $46,794
- Composite
- 52.03/100
- National rank
- #1634
- State rank
- #10 of 73 in FL
Livability — DeFuniak Springs
- Score
- 64/100
- State rank
- #694
- US rank
- #14475
Category grades
Schools grade is shown separately in the Schools card above.
Census & demographics
- Census place
- DeFuniak Springs, FL
- City population
- 19,746
- Population (ZIP)
- 6,359
Population outlook (Walton County) Hauer SSP2
- Today (2025)
- 80,014 people
- By 2030
- 88,120 · +10.1%
- By 2040
- 103,537 · +29.4%
- By 2050
- 117,034 · +46.3%
- By 2075
- 143,901 · +79.8%
- By 2100
- 155,138 · +93.9%
Race, ethnicity, and origin ACS 2023
- Neighborhood character
- Predominantly White (83%)
- Race & ethnicity
- White 83% Black 6% Two or more races 6% Hispanic / Latino 4%
- Common ancestry
- Slovak 5% Scottish 2% Serbian 1%
- Foreign-born
- 3% · Canada
- Languages at home
- 97% English-only · Spanish 2%
Political lean MEDSL · Walton
- 2024 margin
- Solid R (+57.8) · D 20.7% · R 78.6%
- 2008→2024 swing
- -12.0pp toward R · 2008: -45.8pp · 2024: -57.8pp
- All cycles
- 2024: R+57.8 2020: R+51.7 2016: R+56.1 2012: R+52.0 2008: R+45.8
Not yet ingested
- Civics
- —
Market trends
- HPI YoY
- ▲ 12.25%
- Current HPI
- 314.8146
- Rent YoY
- —
- Metro
- —
- State GDP YoY
- ▲ 3.28%
- F500 in state
- 36
Industry mix (Fortune 500 HQ in FL)
| Industry | F500 HQs | Revenue |
|---|---|---|
| Industrial Technology | 2 | $29B |
|
||
| Insurance | 2 | $17B |
|
||
| Retail | 1 | $60B |
|
||
| Technology Distribution | 1 | $58B |
|
||
| Homebuilding | 1 | $35B |
|
||
| Technology Manufacturing | 1 | $35B |
|
||
Price history
+140.3% since first listed5 events — show timeline
- 2026-06-10 Listed $180,000 FSBO.com
- 2019-07-02 Sold (Public Records) $70,000 Public Records
- 2019-06-28 Sold (MLS) $70,000 NAMLS
- 2019-06-28 Sold (MLS) $70,000 ECAR
- 2019-05-08 Listed $74,900 NAMLS
Property tax history
+13.2%/yrLatest (2025): $1,615 · +13.5% YoY. Source: county tax records.
Cash-flow waterfall
monthlySold comps — $/sqft
last 12 mo · ≤1 miLoading sold comps…