143 Lark Meadow Dr · Runaway Bay, TX
Flood risk 1/10 · Minimal
- FEMA flood zone
- X (unshaded)
- Chance of flooding over 30 yrs
- 0.0%
- Est. flood insurance / yr
- $507 – $1,088
Fire risk 4/10 · Minor
- Est. fire insurance / yr
- $1,222 – $2,270
Heat risk 7/10 · Major
- Hot days now (above 111°F)
- 7 days/yr
- Hot days in 30 yrs
- 21 days/yr
Wind risk 4/10 · Minor
- Chance of severe wind over 30 yrs
- 18.0%
Air-quality risk 1/10 · Minimal
- Unhealthy air days now
- 0 days/yr
- Unhealthy air days in 30 yrs
- 0 days/yr
Risk factors via First Street. Map © Google.
Why this score? — see what drove the D+ grade
The composite is a weighted blend of 9 inputs, each scored 0–100. Each bar is that input's sub-score; the figure is the points it added to the 100-point composite (weight × sub-score).
- ARV discount +12.2/15.0
- Cash flow +10.8/30.0
- Appreciation +4.6/10.0
- Condition / age +4.0/5.0
- Schools +3.6/10.0
- Livability +3.4/5.0
- 1% rule +3.2/10.0
- DSCR +3.1/10.0
- Rent growth +2.5/5.0
$209,999
🖨 Deal sheet (PDF) 📄 Offer letter ✓ Due diligence
Listing remarks
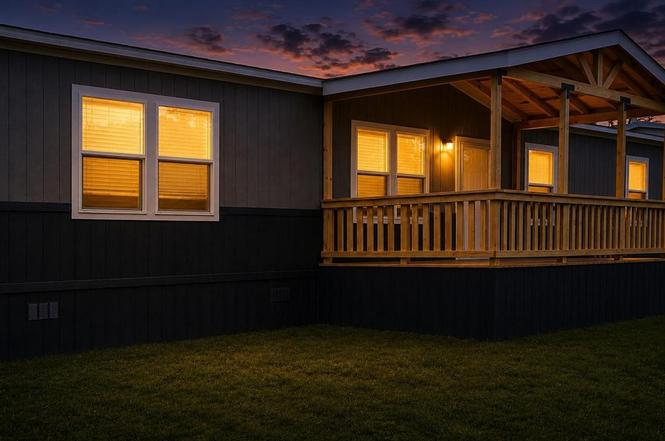
Welcome home to this brand-new 4-bedroom, 2-bath home offering comfort, quality construction, and an unbeatable location just minutes from beautiful Lake Bridgeport. Situated on almost a quarter acre. Step inside to discover a spacious, open-concept floor plan designed for both everyday living and entertaining. The home features a stylish kitchen (includes a new dishwasher, refrigerator, and range), generous living areas, and a private primary suite with an en-suite bath. Enjoy outdoor living from the inviting covered front deck, perfect for morning coffee or evening relaxation, along with a rear deck that offers additional space for grilling, gathering, and enjoying the outdoors. Property
Key facts
- Smart panel skirting
- Stylish kitchen
- Covered front deck
Tags
Property features AI
Finance
- Other: Builder special listing condition; Possession at closing/funding; Exclusions: signs, locks, temporary watering system, temporary security system
- Financial info: Accepts Cash, Conventional, FHA, USDA loan, VA loan; No second mortgage
- HOA & community: No association
Exterior
- Parking: Driveway; Gravel parking
- Security: Smoke detector(s)
- Utilities: City water; City sewer; Co-op electric; Electricity available; Outside city limits / unincorporated area
- Home design: Manufactured home; One level; Property attached
- Construction: Composition roof; Other construction materials; Pillar/post/pier foundation; Built in 2026 (new construction - complete)
- Exterior features: Covered deck; Covered front and rear porches; Patio; Deck; Front porch; Rear porch; Acreage lot with few trees; Interior lot; Easements for utilities
Interior
- Kitchen: Dishwasher; Electric range; Refrigerator; Kitchen island
- Bedrooms: Primary bedroom on level 1 with ensuite bath and walk-in closet; Three additional bedrooms on level 1
- Flooring: Laminate flooring
- Bathrooms: Two full bathrooms
- Heating & cooling: Central heating (electric); Central air conditioning (electric)
- Interior features: Open floorplan; Built-in features; Decorative lighting; Kitchen island; Walk-in closet(s); Other
- Laundry & utility: Full-size washer/dryer area; Electric dryer hookup; Utility room; Utility room with space for a freezer
Neighborhood map
What this means for you Summary
Snapshot
- This is a 4-bed/2.0-bath manufactured listed at $210k. Condition is rated good.
Deal economics
- At list price, monthly cash flow is $-95 ($-1k/yr) — negative.
- To cash-flow at today's rent, offer at most $196k (6.5% below list).
- To meet the 1% rule (rent ≥ 1% of price), the offer needs to be $172k (18.2% below list).
- Recommended offer: $172k (18.2% below list) — sets the bar for 1% rule.
- Cap rate 5.8% vs local median 2.8% in Runaway Bay — top-decile yield for the area; either an underpriced asset or a hidden risk that comps aren't pricing in. Stress-test before assuming the spread holds.
Location & tenants
- Location reads 68/100 on livability (#491 in TX) — a middle-class / working-renter tenant base. Strengths: crime A+, cost of living A+, housing A+; Watch: health & safety D+, amenities F, commute F.
- Jacksboro ISD (town): math 42% / reading 42% proficiency, ranked #337 of 826 in TX (top 41%) — families likely to look elsewhere, expect single-tenant / working-renter base with shorter leases.
- Zoned schools: Jacksboro El (math 39% / reading 36%, grade F, #1,744 of 4,322 statewide, top 41%, 497 students, 68% FRL); Jacksboro Middle (math 44% / reading 40%, grade D-, #572 of 1,662 statewide, top 36%, 251 students, 68% FRL); Jacksboro H S (math 47% / reading 57%, grade D+, #447 of 1,632 statewide, top 29%, 335 students, 68% FRL) — zoned schools average 68% FRL vs 44% district-wide (24 pts higher); higher-poverty schools than district average — tighter screening recommended.
- Market conditions: 340 active listings in the ZIP; 1 comparable units currently listed for rent nearby; solid renter incomes; 460 units permitted in Wise County in 2024 (243 in 5+ unit buildings).
Forward outlook
- Local home prices are declining (-0.8%/yr); year-one equity from $1k of loan paydown is wiped out by about $2k of value loss. Plan a longer hold.
- Wise County population projected at +27% by 2050 — long-run rental-demand tailwind backs the buy-and-hold thesis.
Negotiation context
- Only 4 days on market — expect competitive offers; lowballing is unlikely to land.
Risks & watch-outs
- Climate carrying-cost: extreme-heat days projected 7→21/yr by 2055 (HVAC capex compounding) — expect insurance premiums to compound above CPI over the hold.
Questions for the listing agent
- What do current leases actually rent for vs. the listed asking? Can we see a recent rent roll and the last 12 months of T-12 income?
- Is there a deadline driving the sale (1031 exchange, divorce, estate, relocation)? That informs how much negotiation room exists.
- Schools are D-rated, which usually means shorter tenancies and higher turnover. Who's the typical renter profile here, and what's been the actual vacancy rate?
- The area grade is low — what's the realistic commute time and amenity access for the typical tenant pool here? Any planned neighborhood developments (good or bad) we should know about?
- What's the average days-on-market for RENTAL listings here right now (not sales)? A rising rental-DOM trend means longer vacancies and softer asking-rent achievability than the comps imply.
- What's the recent tenant-quality profile in this submarket — average credit score on applications, eviction rate, late-payment / NSF rate, and stable-employment percentage? A property-management company in the area should have these aggregated.
- How much new for-sale + rental construction is in the pipeline within 1–3 miles? Heavy new supply typically softens prices + rents 12–24 months out; constrained supply supports both.
Investment metrics
- 1% rule
- 0.82% ✗
- Cap rate
- 5.75%
- Cash-on-cash
- -1.93%
- DSCR
- 0.91
- GRM
- 10.2
CMA / ARV
- ARV (on-the-fly)
- $234,525
- Comps found
- 2
Show comp detail 2 sales within ~0.75 mi
| Address | Dist | Beds/Ba | Sqft | Sold | Price | $/sf | Match |
|---|---|---|---|---|---|---|---|
| 147 Lark Meadow Dr | 0.00mi | 4/2.0 | 1,493 (+1%) | 0mo | $215,000 | $144 | 98 |
| 408 Sleepy Meadow Dr | 0.28mi | 4/2.0 | 1,345 (-9%) | 4mo | $214,000 | $159 | 69 |
Match score weights: distance 35% · size 25% · config 20% · recency 20%. Top-matched comps best support the ARV.
Projected returns pro-forma
-0.82% appreciation · 3.0% rent growth · sell at horizon
- IRR
- -7.8%
- Equity multiple
- 0.66×
- Total profit
- $-20,105
- Equity at exit
- $52,507
- IRR
- -1.1%
- Equity multiple
- 0.89×
- Total profit
- $-6,282
- Equity at exit
- $56,699
Cash invested: $58,800 (down + closing). Projections, not guarantees.
Landlord ↔ Tenant lean methodology
- Overall (STATE)
- 87 Strongly Landlord-Friendly
- State Texas
- 87 Strongly Landlord-Friendly · R+5
- County
- — inherits STATE
- City
- — inherits STATE
ZIP-level market 76426
- Home prices YoY
- -0.2%
- Active inventory
- 340
- Price-to-rent
- 10.2×
Monthly cashflow live
- Estimated rent
- $1,717 medium interval (Pro) →
- Mortgage (P&I)
- −$1,101
- Tax est. 1.5%
- −$262 /mo · $3,150/yr
- Insurance
- −$87
- HOA
- −$0
- Vacancy / Maint / Mgmt
- −$361
- Net cashflow
- $-95
Break-even live
Sensitivity live
| Price | -10% $51 | -5% $-22 | +0% $-95 | +5% $-167 | +10% $-240 |
|---|---|---|---|---|---|
| Rent | -10% $-230 | -5% $-162 | +0% $-95 | +5% $-27 | +10% $41 |
| Rate | -1.0pp $11 | -0.5pp $-41 | base $-95 | +0.5pp $-149 | +1.0pp $-204 |
UW: 25.0% down · 7.5% · 30yr · 1.5% tax · 5.0% vac · 8.0% maint · 8.0% mgmt
Financing live
Cash to close
- Down payment
- $52,500
- Closing costs
- $6,300
- Reserves months
- —
- Total cash needed
- —
Loan-product check · same deal, 3 products live
Conventional
25% down · 7.5% · 30yr
- Down + closing
- —
- Monthly P&I
- —
- Monthly cashflow
- —
- DSCR
- —
- Eligible?
- —
Personal DTI + credit; lowest rate.
DSCR
20% down · 8.5% · 30yr
- Down + closing
- —
- Monthly P&I
- —
- Monthly cashflow
- —
- DSCR
- —
- Eligible?
- —
No personal income docs; deal must DSCR.
Hard money
10% down · 12.0% · 12mo
- Down + closing
- —
- Monthly P&I
- —
- Monthly cashflow
- —
- DSCR
- —
- Eligible?
- —
Short-term bridge; refi at stabilization.
Rent comps 1 comps
| Address | Beds | Baths | Sqft | Rent | $/sqft | DOM | Units | Dist |
|---|---|---|---|---|---|---|---|---|
| 10915 Shady Oaks Dr Runaway Bay, TX | 3.0 | 2.0 | 1488 | $1,398 | $0.94 | 0d | 1 | 0.07mi |
Listing history 3 events
-
2026-06-21days on market $209,999 Active 4 DOM
-
2026-06-17remarks 699-char remark
-
2026-06-17$209,999 Active 1 DOM
ⓘ Source: listings_history table (triggers on properties + properties_extension) + one-shot
backfill from property_details.listing_events for pre-trigger history.
Climate risk First Street
- Flood 1/10 Low FEMA zone X (unshaded) · 0% chance over 30 yrs
- Wildfire 4/10 Moderate
- Heat 7/10 Severe 7 d/yr ≥111°F today · 21 d/yr by 30 yrs out
- Wind 4/10 Moderate 18% chance of damaging wind over 30 yrs
- Air quality 1/10 Low 0 unhealthy d/yr today · 0 by 30 yrs out
Nearby sold comps map
Loading sold comps map…
Walkable amenities ~0.75 mi
Loading nearby amenities…
Taxation est. · year 1
- Rental income
- $20,607
- − Mortgage interest
- −$11,763
- − Property taxes
- −$3,150
- − Insurance
- −$1,050
- − Repairs & maintenance
- −$1,649
- − Management
- −$1,649
- − Depreciation
- −$6,109
- Taxable loss
- −$4,762
- Est. tax savings @ 24.0%
- +$1,143
- After-tax cash flow
- $7/yr
For passive investors: Depreciation is non-cash, so a rental often shows a tax loss while cash-flowing — sheltering income. Rental losses are passive: they offset passive income freely, and up to $25,000/yr can offset ordinary (W-2) income if you actively participate and your MAGI is under $100k (phasing out to $0 by $150k); unused losses carry forward. On sale, claimed depreciation is recaptured at up to 25%, and gains may owe capital-gains tax (a 1031 exchange can defer both). Figures are a year-1 estimate at your 24.0% rate — not tax advice; consult a CPA.
Condition & rehab AI · 12 photos
This brand-new 4-bedroom, 2-bath home offers a spacious, open-concept floor plan with modern amenities and a beautiful location. The home is move-in ready with no visible repairs or maintenance needed.
Value-add opportunities
- Both Landscaping improvements — Enhances curb appeal and outdoor living space
- Both Painting exterior — Fresh paint can improve curb appeal and home value
- Both Landscaping and curb appeal — Enhances curb appeal and outdoor living space
Renovation cost estimate screening
Value-add ROI direction
- Both Landscaping improvements — Enhances curb appeal and outdoor living space ↑
- Both Painting exterior — Fresh paint can improve curb appeal and home value ↑
- Both Landscaping and curb appeal — Enhances curb appeal and outdoor living space ↑
ⓘ Cost ranges are severity-bucket heuristics (US national rule-of-thumb). Get contractor quotes + a written scope before underwriting a rehab budget.
Schools (NCES district)
- District
- Jacksboro ISD
- NCES district ID
- 4824530
- Math proficiency
- 42% ▼ -3.00%
- Reading proficiency
- 42% ▬ 0.00%
- Median HH income
- $47,739
- Composite
- 35.94/100
- National rank
- #4802
- State rank
- #337 of 826 in TX
Livability — Runaway Bay
- Score
- 68/100
- State rank
- #491
- US rank
- #9730
Category grades
Schools grade is shown separately in the Schools card above.
Census & demographics
- County
- Wise County · 49,037 people
- Metro
- Dallas-Fort Worth-Arlington, TX
- Population (ZIP)
- 11,632
- Household income
- $92,130
- Rent vs Own
- Severe rent burden
- 74.0
Population outlook (Wise County) Hauer SSP2
- Today (2025)
- 71,620 people
- By 2030
- 75,858 · +5.9%
- By 2040
- 83,908 · +17.2%
- By 2050
- 90,717 · +26.7%
- By 2075
- 107,583 · +50.2%
- By 2100
- 114,996 · +60.6%
Race, ethnicity, and origin ACS 2023
- Neighborhood character
- Majority White (60%)
- Race & ethnicity
- White 60% Hispanic / Latino 32% Two or more races 9% Black 2% Asian 1% Native American 1%
- Hispanic origin (detail)
- Mexican 31%
- Common ancestry
- Slovak 1% Lithuanian 1% Romanian 1%
- Foreign-born
- 14% · Canada, Vietnam
- Languages at home
- 72% English-only · Spanish 27%
Political lean MEDSL · Wise
- 2024 margin
- Solid R (+70.0) · D 14.7% · R 84.7%
- 2008→2024 swing
- -14.3pp toward R · 2008: -55.7pp · 2024: -70.0pp
- All cycles
- 2024: R+70.0 2020: R+68.2 2016: R+69.9 2012: R+67.5 2008: R+55.7
Not yet ingested
- Civics
- —
Market trends
- HPI YoY
- ▼ -0.82%
- Current HPI
- 417.89
- Rent YoY
- —
- Metro
- Dallas-Fort Worth-Arlington, TX
- State GDP YoY
- ▲ 3.95%
- F500 in state
- 110
Industry mix (Fortune 500 HQ in TX)
| Industry | F500 HQs | Revenue |
|---|---|---|
| Energy | 16 | $1,198B |
|
||
| Technology | 5 | $198B |
|
||
| Engineering / Construction | 4 | $72B |
|
||
| Energy Services | 3 | $60B |
|
||
| Utilities | 3 | $41B |
|
||
| Healthcare | 2 | $330B |
|
||
Price history
1 event — show timeline
- 2026-06-17 Listed $209,999 NTREIS
Cash-flow waterfall
monthlySold comps — $/sqft
last 12 mo · ≤1 miLoading sold comps…