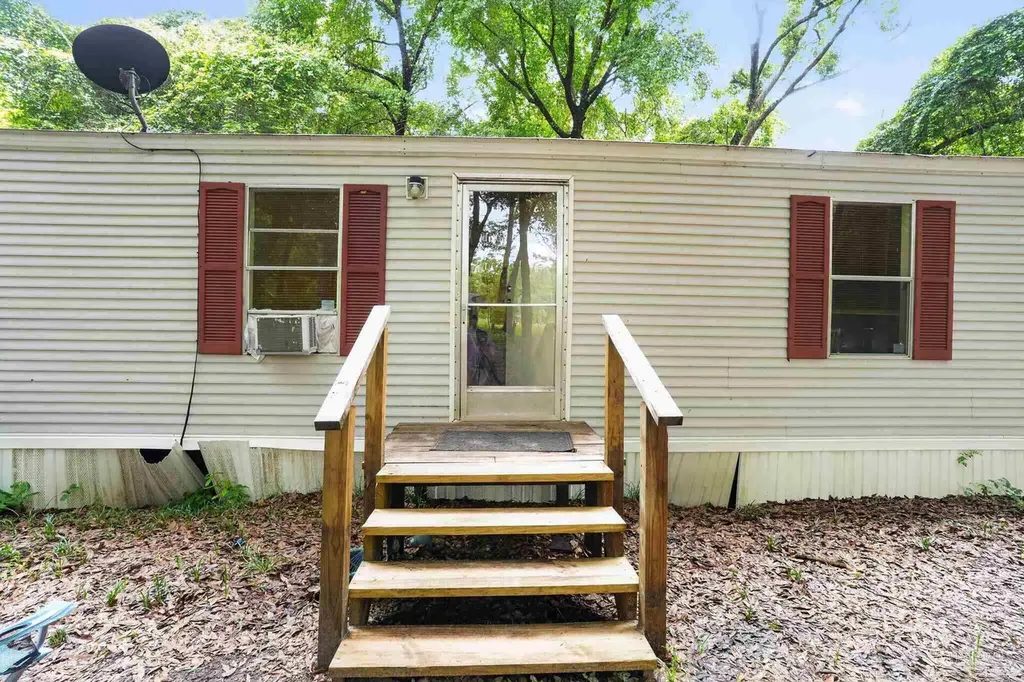
2323 Camors Rd · Brownsdale, FL
Flood risk 4/10 · Minor
- FEMA flood zone
- X (unshaded)
- Chance of flooding over 30 yrs
- 0.2%
- Est. flood insurance / yr
- $507 – $1,088
Fire risk 6/10 · Moderate
- Est. fire insurance / yr
- $947 – $1,759
Heat risk 8/10 · Major
- Hot days now (above 106°F)
- 7 days/yr
- Hot days in 30 yrs
- 20 days/yr
Wind risk 9/10 · Severe
- Chance of severe wind over 30 yrs
- 99.0%
Air-quality risk 2/10 · Minimal
- Unhealthy air days now
- 1 days/yr
- Unhealthy air days in 30 yrs
- 1 days/yr
Risk factors via First Street. Map © Google.
Why this score? — see what drove the B+ grade
The composite is a weighted blend of 9 inputs, each scored 0–100. Each bar is that input's sub-score; the figure is the points it added to the 100-point composite (weight × sub-score).
- Cash flow +29.8/30.0
- DSCR +10.0/10.0
- Appreciation +10.0/10.0
- ARV discount +7.5/15.0
- 1% rule +7.1/10.0
- Schools +5.3/10.0
- Livability +3.1/5.0
- Rent growth +2.5/5.0
- Condition / age +2.5/5.0
$94,900
🖨 Deal sheet (PDF) 📄 Offer letter ✓ Due diligence
Listing remarks
Welcome to Camors Road — a 3-bedroom, 2-bath manufactured home offering 1,280 sq ft of comfortable living on a quiet country road in Jay. The split-bedroom floor plan gives the primary suite its own private side of the home, with two additional bedrooms for family, guests, or a home office. HVAC is only 2 years old, and the home is served by city water and a private septic system for low monthly costs. Set in the rural calm of northwest Santa Rosa County, you're minutes from downtown Jay, Jay Hospital, and State Roads 4 and 89 — with the Escambia River, Blackwater River State Forest, Pensacola, and Gulf Coast beaches all an easy drive away. A solid opportunity for a first-time b
Key facts
- 1 acre lot
- Built 1996
- Listed 31 days
Property features AI
Finance
- Other: Lot approximately 1 acre; Unimproved road with no road maintenance responsibility
- Financial info: Not specified
- HOA & community: No homeowners association
Exterior
- Parking: Open parking with driveway and front entrance access
- Security: Not specified
- Utilities: Electric with circuit breakers; Septic tank sewer
- Home design: Mobile/manufactured home; Single-story; Resale
- Construction: Frame construction; Off-grade foundation; Built as one level
- Exterior features: Shingle roof; Public water; No horseback riding allowed
Interior
- Kitchen: Electric water heater
- Bedrooms: Primary bedroom on the first floor (approx. 16' x 14'); Second bedroom on the first floor (approx. 22' x 15')
- Flooring: Carpet
- Bathrooms: Two full bathrooms
- Heating & cooling: Central air; Ceiling fans; Natural gas heating
- Interior features: Ceiling fans
- Laundry & utility: Not specified
Neighborhood map
What this means for you Summary
Snapshot
- This is a 3-bed/2.0-bath manufactured listed at $95k.
Deal economics
- At list price, monthly cash flow is $348 ($4k/yr) — positive.
- The deal already cash-flows at list — no discount required.
- Meets the 1% rule at list price ($1k rent vs $95k).
- Recommended offer: $92k (3.0% below list) — sets the bar for market timing.
Location & tenants
- Location reads 61/100 on livability (#788 in FL) — a middle-class / working-renter tenant base. Strengths: cost of living A+, employment A; Watch: schools D-, amenities F, commute F.
- Santa Rosa (suburban): math 63% / reading 60% proficiency, ranked #8 of 73 in FL (top 11%) — acceptable for families but not a draw, mixed tenant base, ~2y average lease.
- Market conditions: 129 active listings in the ZIP; 1,983 units permitted in Santa Rosa County in 2024 (128 in 5+ unit buildings).
Forward outlook
- In year one you build about $10k of equity ($656 loan paydown + $9k appreciation (10.0% local appreciation)).
- Santa Rosa County population projected at +31% by 2050 — long-run rental-demand tailwind backs the buy-and-hold thesis.
- At projected returns (10.0% appreciation + 3.0% rent growth), your $27k cash investment doubles in ~2 years — after that, you're playing with house money.
- By year 4, paydown + projected appreciation supports a ~$36k cash-out refi (75% LTV) — recoverable capital for the next deal without selling this one.
Negotiation context
- It's been on market 31 days — a 3% lower offer ($92k) is reasonable based on typical stale-listing flexibility.
Risks & watch-outs
- Climate carrying-cost: severe wind risk, 99% chance of damaging wind over 30y; major wildfire risk; extreme-heat days projected 7→20/yr by 2055 (HVAC capex compounding) — expect insurance premiums to compound above CPI over the hold.
Questions for the listing agent
- It's been on market 31 days. Have you received any prior offers? Is the seller open to a 3% concession, seller financing, or rate buy-down credit?
- Is there a deadline driving the sale (1031 exchange, divorce, estate, relocation)? That informs how much negotiation room exists.
- Schools are D-rated, which usually means shorter tenancies and higher turnover. Who's the typical renter profile here, and what's been the actual vacancy rate?
- What's the average days-on-market for RENTAL listings here right now (not sales)? A rising rental-DOM trend means longer vacancies and softer asking-rent achievability than the comps imply.
- What's the recent tenant-quality profile in this submarket — average credit score on applications, eviction rate, late-payment / NSF rate, and stable-employment percentage? A property-management company in the area should have these aggregated.
- How much new for-sale + rental construction is in the pipeline within 1–3 miles? Heavy new supply typically softens prices + rents 12–24 months out; constrained supply supports both.
Investment metrics
- 1% rule
- 1.21% ✓
- Cap rate
- 10.70%
- Cash-on-cash
- 15.73%
- DSCR
- 1.70
- GRM
- 6.9
CMA / ARV
No comps found within radius.
Projected returns pro-forma
10.0% appreciation · 3.0% rent growth · sell at horizon
- IRR
- 35.9%
- Equity multiple
- 3.78×
- Total profit
- $73,831
- Equity at exit
- $85,493
- IRR
- 30.9%
- Equity multiple
- 8.52×
- Total profit
- $199,885
- Equity at exit
- $184,370
Cash invested: $26,572 (down + closing). Projections, not guarantees.
Landlord ↔ Tenant lean methodology
- Overall (STATE)
- 87 Strongly Landlord-Friendly
- State Florida
- 87 Strongly Landlord-Friendly · R+3
- County
- — inherits STATE
- City
- — inherits STATE
ZIP-level market 32565
- Home prices YoY
- 11.4%
- Active inventory
- 129
- Price-to-rent
- 6.9×
Monthly cashflow live
- Estimated rent
- $1,146 medium interval (Pro) →
- Mortgage (P&I)
- −$498
- Tax from tax record
- −$20 /mo · $240/yr
- Insurance
- −$40
- HOA
- −$0
- Vacancy / Maint / Mgmt
- −$241
- Net cashflow
- $348
Break-even live
Sensitivity live
| Price | -10% $402 | -5% $375 | +0% $348 | +5% $322 | +10% $295 |
|---|---|---|---|---|---|
| Rent | -10% $258 | -5% $303 | +0% $348 | +5% $394 | +10% $439 |
| Rate | -1.0pp $396 | -0.5pp $373 | base $348 | +0.5pp $324 | +1.0pp $299 |
UW: 25.0% down · 7.5% · 30yr · 1.5% tax · 5.0% vac · 8.0% maint · 8.0% mgmt
Financing live
Cash to close
- Down payment
- $23,725
- Closing costs
- $2,847
- Reserves months
- —
- Total cash needed
- —
Loan-product check · same deal, 3 products live
Conventional
25% down · 7.5% · 30yr
- Down + closing
- —
- Monthly P&I
- —
- Monthly cashflow
- —
- DSCR
- —
- Eligible?
- —
Personal DTI + credit; lowest rate.
DSCR
20% down · 8.5% · 30yr
- Down + closing
- —
- Monthly P&I
- —
- Monthly cashflow
- —
- DSCR
- —
- Eligible?
- —
No personal income docs; deal must DSCR.
Hard money
10% down · 12.0% · 12mo
- Down + closing
- —
- Monthly P&I
- —
- Monthly cashflow
- —
- DSCR
- —
- Eligible?
- —
Short-term bridge; refi at stabilization.
Listing history 14 events
-
2026-06-18price $94,900 Active 31 DOM
-
2026-06-18days on market $99,900 Active 31 DOM
-
2026-06-17days on market $99,900 Active 30 DOM
-
2026-06-16days on market $99,900 Active 29 DOM
-
2026-06-15days on market $99,900 Active 28 DOM
-
2026-06-14days on market $99,900 Active 26 DOM
-
2026-06-10days on market $99,900 Active 23 DOM
-
2026-06-09days on market $99,900 Active 22 DOM
-
2026-06-08days on market $99,900 Active 21 DOM
-
2026-06-07days on market $99,900 Active 20 DOM
-
2026-06-05days on market $99,900 Active 17 DOM
-
2026-06-03status $99,900 Active 16 DOM
-
2026-05-31statusdays on market $99,900 Pending 16 DOM
-
2026-05-14$99,900 Active
ⓘ Source: listings_history table (triggers on properties + properties_extension) + one-shot
backfill from property_details.listing_events for pre-trigger history.
Tax reassessment forecast FL · Resets to sale price
- Current annual tax
- $240 · $20/mo
- Projected year-2 tax
- $788 · $66/mo
- Expected delta
- +$548/yr (+$46/mo · 228.7%)
ⓘ Screening estimate from a state-policy table — verify with the county assessor before closing.
Climate risk First Street
- Flood 4/10 Moderate FEMA zone X (unshaded) · 20% chance over 30 yrs
- Wildfire 6/10 Major
- Heat 8/10 Severe 7 d/yr ≥106°F today · 20 d/yr by 30 yrs out
- Wind 9/10 Extreme 99% chance of damaging wind over 30 yrs
- Air quality 2/10 Low 1 unhealthy d/yr today · 1 by 30 yrs out
Nearby sold comps map
Loading sold comps map…
Walkable amenities ~0.75 mi
Loading nearby amenities…
Taxation est. · year 1
- Rental income
- $13,756
- − Mortgage interest
- −$5,316
- − Property taxes
- −$240
- − Insurance
- −$474
- − Repairs & maintenance
- −$1,100
- − Management
- −$1,100
- − Depreciation
- −$2,761
- Taxable income
- $2,764
- Est. tax owed @ 24.0%
- −$663
- After-tax cash flow
- $3,517/yr
For passive investors: Depreciation is non-cash, so a rental often shows a tax loss while cash-flowing — sheltering income. Rental losses are passive: they offset passive income freely, and up to $25,000/yr can offset ordinary (W-2) income if you actively participate and your MAGI is under $100k (phasing out to $0 by $150k); unused losses carry forward. On sale, claimed depreciation is recaptured at up to 25%, and gains may owe capital-gains tax (a 1031 exchange can defer both). Figures are a year-1 estimate at your 24.0% rate — not tax advice; consult a CPA.
Schools (NCES district)
- District
- Santa Rosa
- NCES district ID
- 1201650
- Math proficiency
- 63% ▼ -6.00%
- Reading proficiency
- 60% ▼ -5.00%
- Median HH income
- $58,161
- Composite
- 53.12/100
- National rank
- #1511
- State rank
- #8 of 73 in FL
Livability — Brownsdale
- Score
- 61/100
- State rank
- #788
- US rank
- #18034
Category grades
Schools grade is shown separately in the Schools card above.
Census & demographics
- Population (ZIP)
- 5,653
Population outlook (Santa Rosa County) Hauer SSP2
- Today (2025)
- 195,978 people
- By 2030
- 209,782 · +7.0%
- By 2040
- 235,293 · +20.1%
- By 2050
- 256,408 · +30.8%
- By 2075
- 298,074 · +52.1%
- By 2100
- 303,216 · +54.7%
Race, ethnicity, and origin ACS 2023
- Neighborhood character
- Predominantly White (91%)
- Race & ethnicity
- White 91% Asian 5% Two or more races 3%
- Common ancestry
- Slovak 3% Lithuanian 2% Serbian 1%
- Foreign-born
- 3% · China, Vietnam
- Languages at home
- 94% English-only · Chinese 4% Spanish 1% Tagalog/Filipino 1%
Political lean MEDSL · Santa Rosa
- 2024 margin
- Solid R (+51.0) · D 24.1% · R 75.0%
- 2008→2024 swing
- -3.0pp toward R · 2008: -47.9pp · 2024: -51.0pp
- All cycles
- 2024: R+51.0 2020: R+46.5 2016: R+53.5 2012: R+52.6 2008: R+47.9
Not yet ingested
- Civics
- —
Market trends
- HPI YoY
- ▲ 33.17%
- Current HPI
- 324.7547
- Rent YoY
- —
- Metro
- —
- State GDP YoY
- ▲ 3.28%
- F500 in state
- 36
Industry mix (Fortune 500 HQ in FL)
| Industry | F500 HQs | Revenue |
|---|---|---|
| Industrial Technology | 2 | $29B |
|
||
| Insurance | 2 | $17B |
|
||
| Retail | 1 | $60B |
|
||
| Technology Distribution | 1 | $58B |
|
||
| Homebuilding | 1 | $35B |
|
||
| Technology Manufacturing | 1 | $35B |
|
||
Price history
1 event — show timeline
- 2026-05-14 Listed $99,900 PARMLS
Property tax history
+1.8%/yrLatest (2025): $240 · +21.6% YoY. Source: county tax records.
Cash-flow waterfall
monthlySold comps — $/sqft
last 12 mo · ≤1 miLoading sold comps…