 Multi-family
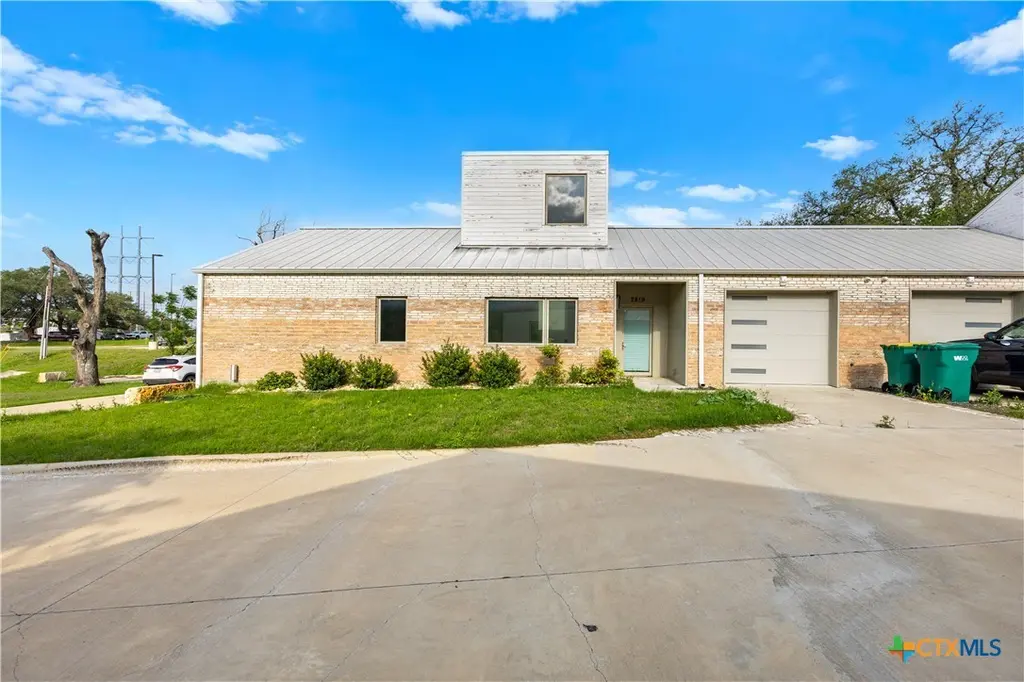
2819 Lone Oak Dr · Belton, TX
Flood risk 1/10 · Minimal
- FEMA flood zone
- X (unshaded)
- Chance of flooding over 30 yrs
- 0.0%
- Est. flood insurance / yr
- $507 – $1,088
Fire risk 3/10 · Minor
- Est. fire insurance / yr
- $1,222 – $2,270
Heat risk 8/10 · Major
- Hot days now (above 108°F)
- 7 days/yr
- Hot days in 30 yrs
- 24 days/yr
Wind risk 6/10 · Moderate
- Chance of severe wind over 30 yrs
- 70.0%
Air-quality risk 1/10 · Minimal
- Unhealthy air days now
- 0 days/yr
- Unhealthy air days in 30 yrs
- 0 days/yr
Risk factors via First Street. Map © Google.
Why this score? — see what drove the B grade
The composite is a weighted blend of 9 inputs, each scored 0–100. Each bar is that input's sub-score; the figure is the points it added to the 100-point composite (weight × sub-score).
- Cash flow +30.0/30.0
- ARV discount +12.7/15.0
- DSCR +10.0/10.0
- 1% rule +9.5/10.0
- Schools +3.8/10.0
- Livability +3.4/5.0
- Rent growth +2.8/5.0
- Condition / age +2.5/5.0
- Appreciation +0.0/10.0
$250,000
🖨 Deal sheet 📄 Offer letter ✓ Due diligence
Multi-family units
County records classify this as Multi-Family (2-4 Unit). Listing-text estimate: 1 unit. estimate disagrees with records
Listing remarks
In the heart of Belton, Texas. Minutes from HEB, Walgreens, and Sonic. Two bedroom, two bath with open concept. Handicap accesible living. Laminate flooring throughout the home. Stainless steel appliances. Minimal yard to maintain.
Key facts
- Laminate flooring
- Garage
- Built 2021
Tags
Property features AI
Exterior
- Parking: 1-car garage
- Utilities: Electricity available and on property; Public sewer
- Home design: Single-story; Brick exterior; Entry on main level; Metal roof; Resale property
- Construction: Built of brick; Metal roof; Slab foundation; Year built (assessor source)
- Exterior features: Covered patio; Covered porch/patio
Interior
- Kitchen: Dishwasher; Electric range; Range; Refrigerator; Some electric appliances
- Bedrooms: All bedrooms on main level
- Flooring: Laminate flooring
- Bathrooms: 2 full bathrooms
- Heating & cooling: Central heating; Central air (one unit)
- Interior features: Open floorplan; Built-in features; Breakfast area; Eat-in kitchen; Kitchen/family room combo; Custom cabinets; Solid surface counters
- Laundry & utility: Laundry room / laundry in utility room
Neighborhood map
What this means for you Summary
Snapshot
- This is a 2-bed/2.0-bath multifamily listed at $250k.
Deal economics
- At list price, monthly cash flow is $1k ($15k/yr) — positive.
- The deal already cash-flows at list — no discount required.
- Meets the 1% rule at list price ($4k rent vs $250k).
- Recommended offer: $242k (3.0% below list) — sets the bar for market timing.
- Cap rate 12.1% vs local median 3.6% in Belton — top-decile yield for the area; either an underpriced asset or a hidden risk that comps aren't pricing in. Stress-test before assuming the spread holds.
Location & tenants
- Location reads 68/100 on livability (#462 in TX) — a middle-class / working-renter tenant base. Strengths: cost of living A+, housing A+, crime A-; Watch: employment C-, schools D, amenities F.
- Belton ISD (suburban): math 39% / reading 46% proficiency, ranked #285 of 826 in TX (top 34%) — families likely to look elsewhere, expect single-tenant / working-renter base with shorter leases.
- Market conditions: Rents rising (+1.3%/yr); 745 active listings in the ZIP; 2 comparable units currently listed for rent nearby; solid renter incomes; 3,222 units permitted in Bell County in 2024 (246 in 5+ unit buildings).
- At $3,631/mo this rent would consume 54% of the median local household income ($81k/yr) (locally 1198% of renters already pay >50% of income on rent) — very limited rent-growth headroom before tenants either downsize or default.
Forward outlook
- Local home prices are declining (-3.0%/yr); year-one equity from $2k of loan paydown is wiped out by about $8k of value loss. Plan a longer hold.
- Bell County population projected at +21% by 2050 — long-run rental-demand tailwind backs the buy-and-hold thesis.
- At projected returns (-3.0% appreciation + 1.3% rent growth), your $70k cash investment doubles in ~7 years — after that, you're playing with house money.
Negotiation context
- It's been on market 51 days — a 3% lower offer ($242k) is reasonable based on typical stale-listing flexibility.
Risks & watch-outs
- Climate carrying-cost: major wind risk, 70% chance of damaging wind over 30y; extreme-heat days projected 7→24/yr by 2055 (HVAC capex compounding) — expect insurance premiums to compound above CPI over the hold.
Questions for the listing agent
- It's been on market 51 days. Have you received any prior offers? Is the seller open to a 3% concession, seller financing, or rate buy-down credit?
- Is there a deadline driving the sale (1031 exchange, divorce, estate, relocation)? That informs how much negotiation room exists.
- Schools are D-rated, which usually means shorter tenancies and higher turnover. Who's the typical renter profile here, and what's been the actual vacancy rate?
- What's the average days-on-market for RENTAL listings here right now (not sales)? A rising rental-DOM trend means longer vacancies and softer asking-rent achievability than the comps imply.
- What's the recent tenant-quality profile in this submarket — average credit score on applications, eviction rate, late-payment / NSF rate, and stable-employment percentage? A property-management company in the area should have these aggregated.
- How much new apartment / multifamily construction is in the pipeline within 1–3 miles? Heavy new supply (>2% of stock underway) typically softens rents 12–24 months out; light construction supports rent growth.
Investment metrics
- 1% rule
- 1.45% ✓
- Cap rate
- 12.15%
- Cash-on-cash
- 20.91%
- DSCR
- 1.93
- GRM
- 5.7
CMA / ARV
- ARV (median comp)
- $283,000
- List price
- $250,000
- Delta
- -11.66%
- Verdict
- UNDERPRICED
- Comps
- 1 within 2.0 mi
Projected returns pro-forma
-3.0% appreciation · 1.29% rent growth · sell at horizon
- IRR
- 11.4%
- Equity multiple
- 1.44×
- Total profit
- $31,027
- Equity at exit
- $37,276
- IRR
- 19.0%
- Equity multiple
- 2.47×
- Total profit
- $102,706
- Equity at exit
- $21,615
Cash invested: $70,000 (down + closing). Projections, not guarantees.
Landlord ↔ Tenant lean methodology
- Overall (STATE)
- 87 Strongly Landlord-Friendly
- State Texas
- 87 Strongly Landlord-Friendly · R+5
- County
- — inherits STATE
- City
- — inherits STATE
ZIP-level market 76513
- Rents YoY
- 1.3%
- Active inventory
- 745
- Price-to-rent
- 11.5×
Monthly cashflow live
- Estimated rent
- $3,631 high interval (Pro) →
- Mortgage (P&I)
- −$1,311
- Tax from tax record
- −$234 /mo · $2,805/yr
- Insurance
- −$104
- HOA
- −$0
- Vacancy / Maint / Mgmt
- −$763
- Net cashflow
- $1,220
Break-even live
2-unit breakdown (identical units grouped — click to expand)
| Units | Beds | Baths | Est. rent |
|---|---|---|---|
| 2× units | 2 | 2 | $3,630 |
| #1 | 2 | 2 | $1,815 |
| #2 | 2 | 2 | $1,815 |
| Total (2 units) | $3,631 | ||
UW: 25.0% down · 7.5% · 30yr · 1.5% tax · 5.0% vac · 8.0% maint · 8.0% mgmt
Financing live
Cash to close
- Down payment
- $62,500
- Closing costs
- $7,500
- Reserves months
- —
- Total cash needed
- —
Loan-product check · same deal, 3 products live
Conventional
25% down · 7.5% · 30yr
- Down + closing
- —
- Monthly P&I
- —
- Monthly cashflow
- —
- DSCR
- —
- Eligible?
- —
Personal DTI + credit; lowest rate.
DSCR
20% down · 8.5% · 30yr
- Down + closing
- —
- Monthly P&I
- —
- Monthly cashflow
- —
- DSCR
- —
- Eligible?
- —
No personal income docs; deal must DSCR.
Hard money
10% down · 12.0% · 12mo
- Down + closing
- —
- Monthly P&I
- —
- Monthly cashflow
- —
- DSCR
- —
- Eligible?
- —
Short-term bridge; refi at stabilization.
Rent comps 2 comps
| Address | Beds | Baths | Sqft | Rent | $/sqft | DOM | Units | Dist |
|---|---|---|---|---|---|---|---|---|
| 509 Guthrie Dr Unit 1534804P Belton, TX | 3.0 | 2.0 | 2206 | $6,021 | $2.73 | 21d | 1 | 0.32mi |
| 410 Downing St Belton, TX | 3.0 | 2.0 | 2839 | $1,700 | $0.60 | 43d | 1 | 0.92mi |
Listing history 17 events
-
2026-06-18days on market $250,000 Active 51 DOM
-
2026-06-17days on market $250,000 Active 50 DOM
-
2026-06-16days on market $250,000 Active 49 DOM
-
2026-06-15days on market $250,000 Active 48 DOM
-
2026-06-14days on market $250,000 Active 46 DOM
-
2026-06-13days on market $250,000 Active 45 DOM
-
2026-06-10days on market $250,000 Active 43 DOM
-
2026-06-09days on market $250,000 Active 42 DOM
-
2026-06-08days on market $250,000 Active 41 DOM
-
2026-06-07days on market $250,000 Active 40 DOM
-
2026-06-05days on market $250,000 Active 37 DOM
-
2026-06-03days on market $250,000 Active 36 DOM
-
2026-06-02days on market $250,000 Active 35 DOM
-
2026-06-01days on market $250,000 Active 34 DOM
-
2026-05-31days on market $250,000 Active 33 DOM
-
2026-05-30days on market $250,000 Active 32 DOM
-
2026-04-28$250,000 Active 231-char remark
ⓘ Source: listings_history table (triggers on properties + properties_extension) + one-shot
backfill from property_details.listing_events for pre-trigger history.
Tax reassessment forecast TX · Resets to sale price
- Current annual tax
- $2,805 · $234/mo
- Projected year-2 tax
- $4,575 · $381/mo
- Expected delta
- +$1,770/yr (+$148/mo · 63.1%)
ⓘ Screening estimate from a state-policy table — verify with the county assessor before closing.
Climate risk First Street
- Flood 1/10 Low FEMA zone X (unshaded) · 0% chance over 30 yrs
- Wildfire 3/10 Moderate
- Heat 8/10 Severe 7 d/yr ≥108°F today · 24 d/yr by 30 yrs out
- Wind 6/10 Major 70% chance of damaging wind over 30 yrs
- Air quality 1/10 Low 0 unhealthy d/yr today · 0 by 30 yrs out
Nearby sold comps map
Loading sold comps map…
Walkable amenities ~0.75 mi
Loading nearby amenities…
Taxation est. · year 1
- Rental income
- $43,572
- − Mortgage interest
- −$14,004
- − Property taxes
- −$2,805
- − Insurance
- −$1,250
- − Repairs & maintenance
- −$3,486
- − Management
- −$3,486
- − Depreciation
- −$7,273
- Taxable income
- $11,269
- Est. tax owed @ 24.0%
- −$2,705
- After-tax cash flow
- $11,930/yr
For passive investors: Depreciation is non-cash, so a rental often shows a tax loss while cash-flowing — sheltering income. Rental losses are passive: they offset passive income freely, and up to $25,000/yr can offset ordinary (W-2) income if you actively participate and your MAGI is under $100k (phasing out to $0 by $150k); unused losses carry forward. On sale, claimed depreciation is recaptured at up to 25%, and gains may owe capital-gains tax (a 1031 exchange can defer both). Figures are a year-1 estimate at your 24.0% rate — not tax advice; consult a CPA.
Schools (NCES district)
- District
- Belton ISD
- NCES district ID
- 4809860
- Math proficiency
- 39% ▼ -14.00%
- Reading proficiency
- 46% ▼ -4.00%
- Median HH income
- $61,239
- Composite
- 37.62/100
- National rank
- #4378
- State rank
- #285 of 826 in TX
Livability — Belton
- Score
- 68/100
- State rank
- #462
- US rank
- #9300
Category grades
Schools grade is shown separately in the Schools card above.
Census & demographics
- Census place
- Belton, TX
- County
- Bell County · 345,090 people
- City population
- 45,928
- Metro
- Killeen-Temple, TX
- Population (ZIP)
- 45,928
- Household income
- $80,661
- Rent vs Own
- Severe rent burden
- 1198.0
Population outlook (Bell County) Hauer SSP2
- Today (2025)
- 371,114 people
- By 2030
- 389,104 · +4.8%
- By 2040
- 420,592 · +13.3%
- By 2050
- 447,779 · +20.7%
- By 2075
- 499,130 · +34.5%
- By 2100
- 505,680 · +36.3%
Race, ethnicity, and origin ACS 2023
- Neighborhood character
- Majority White (62%)
- Race & ethnicity
- White 62% Hispanic / Latino 24% Two or more races 14% Black 6% Asian 2%
- Hispanic origin (detail)
- Mexican 19% Puerto Rican 1%
- Common ancestry
- Italian 3% Slovak 2% Lithuanian 2%
- Foreign-born
- 9% · Canada, Vietnam
- Languages at home
- 83% English-only · Spanish 13% Korean 1% Other Indo-European 1%
Political lean MEDSL · Bell
- 2024 margin
- R (+16.2) · D 41.3% · R 57.6% · Other 1.1%
- 2008→2024 swing
- -6.5pp toward R · 2008: -9.8pp · 2024: -16.2pp
- All cycles
- 2024: R+16.2 2020: R+8.5 2016: R+15.1 2012: R+16.4 2008: R+9.8
Not yet ingested
- Civics
- —
Market trends
- HPI YoY
- ▼ -105.10%
- Current HPI
- 183.6715
- Rent YoY
- ▲ 1.29%
- Metro
- Killeen-Temple, TX
- State GDP YoY
- ▲ 3.95%
- F500 in state
- 110
Industry mix (Fortune 500 HQ in TX)
| Industry | F500 HQs | Revenue |
|---|---|---|
| Energy | 16 | $1,198B |
|
||
| Technology | 5 | $198B |
|
||
| Engineering / Construction | 4 | $72B |
|
||
| Energy Services | 3 | $60B |
|
||
| Utilities | 3 | $41B |
|
||
| Healthcare | 2 | $330B |
|
||
Price history
1 event — show timeline
- 2026-04-28 Listed $250,000 CTXMLS
Property tax history
-22.3%/yrLatest (2026): $2,805 · -22.3% YoY. Source: county tax records.
Cash-flow waterfall
monthlySold comps — $/sqft
last 12 mo · ≤1 miLoading sold comps…