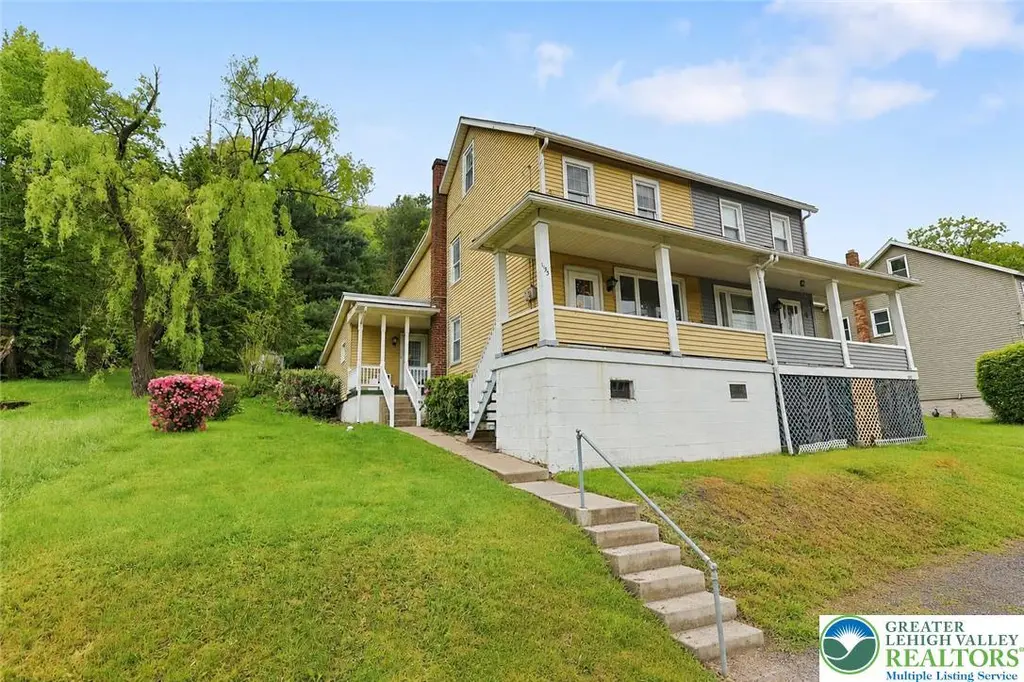
195 Yard St · Nesquehoning, PA
Flood risk 1/10 · Minimal
- FEMA flood zone
- X (unshaded)
- Chance of flooding over 30 yrs
- 0.0%
- Est. flood insurance / yr
- $507 – $1,088
Fire risk 3/10 · Minor
- Est. fire insurance / yr
- $511 – $949
Heat risk 3/10 · Minor
- Hot days now (above 94°F)
- 7 days/yr
- Hot days in 30 yrs
- 16 days/yr
Wind risk 4/10 · Minor
- Chance of severe wind over 30 yrs
- 8.0%
Air-quality risk 2/10 · Minimal
- Unhealthy air days now
- 1 days/yr
- Unhealthy air days in 30 yrs
- 3 days/yr
Risk factors via First Street. Map © Google.
Why this score? — see what drove the D- grade
The composite is a weighted blend of 9 inputs, each scored 0–100. Each bar is that input's sub-score; the figure is the points it added to the 100-point composite (weight × sub-score).
- Cash flow +13.4/30.0
- DSCR +4.0/10.0
- Appreciation +4.0/10.0
- 1% rule +3.7/10.0
- Livability +3.4/5.0
- Rent growth +2.5/5.0
- Condition / age +2.5/5.0
- Schools +2.0/10.0
- ARV discount +0.0/15.0
$149,900
🖨 Deal sheet (PDF) 📄 Offer letter ✓ Due diligence
Listing remarks MLS
Here's your chance to stop renting and start owning! Discover the charm of this wonderfully maintained 3-bedroom, 1-bath half-double on the peaceful outskirts of Nesquehoning! This home blends comfort and functionality with an inviting kitchen that flows to a spacious dining room and warm, inviting living and family room. A soothing neutral palette and plush carpeting, a welcoming atmosphere throughout. Upstairs, you’ll find three spacious bedrooms with ample closet space and 1 full bath. Third floor features a large finished attic for storage, an office, or additional bedroom! Step outside to enjoy a fenced in yard perfect for hosting or relaxing. Located close to Jim Thorpe and Pocono attractions — don’t miss this wonderful opportunity!
Key facts
- Inviting kitchen
- Finished attic
- Spacious dining room
Tags
Property features AI
Exterior
- Parking: On-street parking
- Utilities: Public water; Public sewer; Electric hot water
- Home design: Fee simple ownership
- Construction: Concrete perimeter foundation
- Exterior features: Semi-detached; Aluminum siding; Above- and below-grade structures; Not in a federal flood zone
Interior
- Kitchen: Refrigerator; Electric oven/range
- Bedrooms: Three bedrooms on the first upper level; Rooms include living room, dining room, master bedroom, two additional bedrooms, family room, mud room, attic
- Bathrooms: One full bathroom (all upper levels)
- Heating & cooling: Hot water heating; Coal fuel; Wall unit cooling
- Interior features: Eat-in kitchen; Full basement
- Laundry & utility: Washer and dryer in basement; Electric hot water
Neighborhood map
What this means for you Summary
Snapshot
- This is a 3-bed/1.0-bath townhouse listed at $150k.
Deal economics
- At list price, monthly cash flow is $4 ($46/yr) — positive.
- The deal already cash-flows at list — no discount required.
- To meet the 1% rule (rent ≥ 1% of price), the offer needs to be $131k (12.9% below list).
- Recommended offer: $131k (12.9% below list) — sets the bar for 1% rule.
Location & tenants
- Location reads 68/100 on livability (#872 in PA) — a middle-class / working-renter tenant base. Strengths: crime A+, cost of living A+, housing A+; Watch: employment C-, amenities F, commute F.
- Panther Valley SD (rural): math 14% / reading 35% proficiency, ranked #477 of 539 in PA (top 88%) — low school quality limits family demand, transient renter base, plan for 1-2y turnover.
- Zoned schools: Panther Valley El Sch (math 27% / reading 42%, grade F, #1,049 of 1,518 statewide, top 71%, 622 students, 100% FRL); Panther Valley Intermediate Sch (math 11% / reading 31%, grade F, #432 of 512 statewide, top 85%, 417 students, 100% FRL); Panther Valley Jshs (math 13% / reading 36%, grade F, #376 of 437 statewide, top 86%, 771 students, 100% FRL) — zoned schools average 100% FRL vs 52% district-wide (48 pts higher); higher-poverty schools than district average — tighter screening recommended.
- Market conditions: 26 active listings in the ZIP; 12 comparable units currently listed for rent nearby; rentals at typical pace (median 26d on market — plan ~3-4 weeks tenant-placement turnaround); 42% of comp listings sitting > 30 days — soft ceiling on asking rent; 180 units permitted in Carbon County in 2024 (10 in 5+ unit buildings).
Forward outlook
- Local home prices are declining (-2.1%/yr); year-one equity from $1k of loan paydown is wiped out by about $3k of value loss. Plan a longer hold.
- Carbon County population projected at -18% by 2050 — secular population decline; favor cash flow + early exit over multi-decade hold.
Negotiation context
- It's been on market 17 days — a 2% lower offer ($148k) is reasonable based on typical stale-listing flexibility.
- 4 sale attempts since 8y ago with the ask held roughly flat each time — persistent listings suggest the price (not the market) is what's stuck; bring a comps-based counter.
- Current owner paid $40k; list at $150k implies a 276% gain — meaningful room to come down on a strong offer.
Risks & watch-outs
- Watch-outs: built in 1920 — expect roof / HVAC / electrical / plumbing capex.
Questions for the listing agent
- Built in 1920 — when were the roof, HVAC, electrical panel, plumbing, and water heater last replaced?
- Is there a deadline driving the sale (1031 exchange, divorce, estate, relocation)? That informs how much negotiation room exists.
- Schools are D-rated, which usually means shorter tenancies and higher turnover. Who's the typical renter profile here, and what's been the actual vacancy rate?
- The area grade is low — what's the realistic commute time and amenity access for the typical tenant pool here? Any planned neighborhood developments (good or bad) we should know about?
- What's the average days-on-market for RENTAL listings here right now (not sales)? A rising rental-DOM trend means longer vacancies and softer asking-rent achievability than the comps imply.
- What's the recent tenant-quality profile in this submarket — average credit score on applications, eviction rate, late-payment / NSF rate, and stable-employment percentage? A property-management company in the area should have these aggregated.
- How much new for-sale + rental construction is in the pipeline within 1–3 miles? Heavy new supply typically softens prices + rents 12–24 months out; constrained supply supports both.
Investment metrics
- 1% rule
- 0.87% ✗
- Cap rate
- 6.32%
- Cash-on-cash
- 0.11%
- DSCR
- 1.00
- GRM
- 9.6
CMA / ARV
- ARV (on-the-fly)
- $112,575
- Comps found
- 1
Show comp detail 1 sale within ~0.75 mi
| Address | Dist | Beds/Ba | Sqft | Sold | Price | $/sf | Match |
|---|---|---|---|---|---|---|---|
| 205 Yard St | 0.03mi | 4/1.0 (+1) | 1,447 (+2%) | 8mo | $115,000 | $79 | 85 |
Match score weights: distance 35% · size 25% · config 20% · recency 20%. Top-matched comps best support the ARV.
Projected returns pro-forma
-2.08% appreciation · 3.0% rent growth · sell at horizon
- IRR
- -11.0%
- Equity multiple
- 0.57×
- Total profit
- $-18,196
- Equity at exit
- $28,562
- IRR
- -3.1%
- Equity multiple
- 0.75×
- Total profit
- $-10,289
- Equity at exit
- $23,885
Cash invested: $41,972 (down + closing). Projections, not guarantees.
Landlord ↔ Tenant lean methodology
- Overall (STATE)
- 62 Landlord-Friendly
- State Pennsylvania
- 62 Landlord-Friendly · EVEN
- County
- — inherits STATE
- City
- — inherits STATE
ZIP-level market 18240
- Home prices YoY
- -1.1%
- Active inventory
- 26
- Price-to-rent
- 9.6×
Monthly cashflow live
- Estimated rent
- $1,305 high interval (Pro) →
- Mortgage (P&I)
- −$786
- Tax from tax record
- −$179 /mo · $2,147/yr
- Insurance
- −$62
- HOA
- −$0
- Vacancy / Maint / Mgmt
- −$274
- Net cashflow
- $4
Break-even live
Sensitivity live
| Price | -10% $89 | -5% $46 | +0% $4 | +5% $-39 | +10% $-81 |
|---|---|---|---|---|---|
| Rent | -10% $-99 | -5% $-48 | +0% $4 | +5% $55 | +10% $107 |
| Rate | -1.0pp $79 | -0.5pp $42 | base $4 | +0.5pp $-35 | +1.0pp $-75 |
UW: 25.0% down · 7.5% · 30yr · 1.5% tax · 5.0% vac · 8.0% maint · 8.0% mgmt
Financing live
Cash to close
- Down payment
- $37,475
- Closing costs
- $4,497
- Reserves months
- —
- Total cash needed
- —
Loan-product check · same deal, 3 products live
Conventional
25% down · 7.5% · 30yr
- Down + closing
- —
- Monthly P&I
- —
- Monthly cashflow
- —
- DSCR
- —
- Eligible?
- —
Personal DTI + credit; lowest rate.
DSCR
20% down · 8.5% · 30yr
- Down + closing
- —
- Monthly P&I
- —
- Monthly cashflow
- —
- DSCR
- —
- Eligible?
- —
No personal income docs; deal must DSCR.
Hard money
10% down · 12.0% · 12mo
- Down + closing
- —
- Monthly P&I
- —
- Monthly cashflow
- —
- DSCR
- —
- Eligible?
- —
Short-term bridge; refi at stabilization.
Rent comps 12 comps
| Address | Beds | Baths | Sqft | Rent | $/sqft | DOM | Units | Dist |
|---|---|---|---|---|---|---|---|---|
| 10 Leisenring St Lansford, PA | 3.0 | 1.0 | 1422 | $1,100 | $0.77 | 45d | 1 | 0.95mi |
| 323 E Bertsch St Unit A-1 Lansford, PA | 2.0 | 1.0 | 1250 | $1,450 | $1.16 | 45d | 1 | 1.06mi |
| 317 E Bertsch St Unit 1 Lansford, PA | 2.0 | 1.0 | 1650 | $1,400 | $0.85 | 45d | 1 | 1.06mi |
| 546 E Kline Ave Lansford, PA | 3.0 | 1.0 | 1000 | $900 | $0.90 | 4d | 1 | 1.06mi |
| 149 W Ridge St Unit 1A Lansford, PA | 2.0 | 1.0 | 930 | $1,350 | $1.45 | 25d | 1 | 1.29mi |
| 149 W Ridge St Unit 2b Lansford, PA | 2.0 | 1.0 | 875 | $1,325 | $1.51 | 25d | 1 | 1.29mi |
| 149 W Ridge St Unit 3A Lansford, PA | 3.0 | 1.0 | 1550 | $1,650 | $1.06 | 45d | 1 | 1.29mi |
| 149 W Ridge St Unit 1B Lansford, PA | 3.0 | 1.0 | 1654 | $1,500 | $0.91 | 21d | 1 | 1.29mi |
| 214 N Oak St Summit Hill, PA | 3.0 | 1.0 | 940 | $1,250 | $1.33 | 4d | 1 | 1.46mi |
| 214 N Oak St Unit 2 Summit Hill, PA | 3.0 | 1.0 | 940 | $1,200 | $1.28 | 4d | 1 | 1.46mi |
| 214 N Oak St Unit 2 Summit Hill, PA | 3.0 | 1.0 | 940 | $1,250 | $1.33 | 21d | 1 | 1.46mi |
| 214 N Oak St Unit 2 Summit Hill, PA | 3.0 | 1.0 | 940 | $1,250 | $1.33 | 45d | 1 | 1.46mi |
Listing history 19 events
-
2026-06-13status $149,900 Pending 17 DOM
-
2026-06-10days on market $149,900 Active 17 DOM
-
2026-06-09days on market $149,900 Active 16 DOM
-
2026-06-08days on market $149,900 Active 15 DOM
-
2026-06-07days on market $149,900 Active 14 DOM
-
2026-06-05days on market $149,900 Active 11 DOM
-
2026-06-03days on market $149,900 Active 10 DOM
-
2026-06-02days on market $149,900 Active 9 DOM
-
2026-06-01days on market $149,900 Active 8 DOM
-
2026-05-31days on market $149,900 Active 7 DOM
-
2026-05-31days on market $149,900 Active 6 DOM
-
2026-05-24$149,900 Active
Show marketing remark (766 chars)
Here's your chance to stop renting and start owning! Discover the charm of this wonderfully maintained 3-bedroom, 1-bath half-double on the peaceful outskirts of Nesquehoning! This home blends comfort and functionality with an inviting kitchen that flows to a spacious dining room and warm, inviting living and family room. A soothing neutral palette and plush carpeting, a welcoming atmosphere throughout. Upstairs, you’ll find three spacious bedrooms with ample closet space and 1 full bath. Third floor features a large finished attic for storage, an office, or additional bedroom! Step outside to enjoy a fenced in yard perfect for hosting or relaxing. Located close to Jim Thorpe and Pocono attractions — don’t miss this wonderful opportunity!
-
2026-05-24$149,900 Active 766-char remark
Show marketing remark (766 chars)
Here's your chance to stop renting and start owning! Discover the charm of this wonderfully maintained 3-bedroom, 1-bath half-double on the peaceful outskirts of Nesquehoning! This home blends comfort and functionality with an inviting kitchen that flows to a spacious dining room and warm, inviting living and family room. A soothing neutral palette and plush carpeting, a welcoming atmosphere throughout. Upstairs, you’ll find three spacious bedrooms with ample closet space and 1 full bath. Third floor features a large finished attic for storage, an office, or additional bedroom! Step outside to enjoy a fenced in yard perfect for hosting or relaxing. Located close to Jim Thorpe and Pocono attractions — don’t miss this wonderful opportunity!
-
2022-10-14historical
-
2019-01-18soldstatus $39,900
-
2018-11-19soldstatus $39,000
-
2018-08-21$39,900
-
2018-08-20$39,900
-
2014-04-24soldstatus $15,000
ⓘ Source: listings_history table (triggers on properties + properties_extension) + one-shot
backfill from property_details.listing_events for pre-trigger history.
Tax reassessment forecast PA · Partial reset (capped growth)
- Current annual tax
- $2,147 · $179/mo
- Projected year-2 tax
- $2,258 · $188/mo
- Expected delta
- +$111/yr (+$9/mo · 5.2%)
ⓘ Screening estimate from a state-policy table — verify with the county assessor before closing.
Climate risk First Street
- Flood 1/10 Low FEMA zone X (unshaded) · 0% chance over 30 yrs
- Wildfire 3/10 Moderate
- Heat 3/10 Moderate 7 d/yr ≥94°F today · 16 d/yr by 30 yrs out
- Wind 4/10 Moderate 8% chance of damaging wind over 30 yrs
- Air quality 2/10 Low 1 unhealthy d/yr today · 3 by 30 yrs out
Nearby sold comps map
Loading sold comps map…
Walkable amenities ~0.75 mi
Loading nearby amenities…
Taxation est. · year 1
- Rental income
- $15,665
- − Mortgage interest
- −$8,397
- − Property taxes
- −$2,147
- − Insurance
- −$750
- − Repairs & maintenance
- −$1,253
- − Management
- −$1,253
- − Depreciation
- −$4,361
- Taxable loss
- −$2,496
- Est. tax savings @ 24.0%
- +$599
- After-tax cash flow
- $644/yr
For passive investors: Depreciation is non-cash, so a rental often shows a tax loss while cash-flowing — sheltering income. Rental losses are passive: they offset passive income freely, and up to $25,000/yr can offset ordinary (W-2) income if you actively participate and your MAGI is under $100k (phasing out to $0 by $150k); unused losses carry forward. On sale, claimed depreciation is recaptured at up to 25%, and gains may owe capital-gains tax (a 1031 exchange can defer both). Figures are a year-1 estimate at your 24.0% rate — not tax advice; consult a CPA.
Schools (NCES district)
- District
- Panther Valley SD
- NCES district ID
- 4218450
- Math proficiency
- 14% ▼ -7.00%
- Reading proficiency
- 35% ▼ -14.00%
- Median HH income
- $36,914
- Composite
- 20.31/100
- National rank
- #8613
- State rank
- #477 of 539 in PA
Livability — Nesquehoning
- Score
- 68/100
- State rank
- #872
- US rank
- #9211
Category grades
Schools grade is shown separately in the Schools card above.
Census & demographics
- Census place
- Nesquehoning, PA
- City population
- 3,909
- Population (ZIP)
- 3,909
Population outlook (Carbon County) Hauer SSP2
- Today (2025)
- 61,643 people
- By 2030
- 59,840 · -2.9%
- By 2040
- 55,413 · -10.1%
- By 2050
- 50,843 · -17.5%
- By 2075
- 43,326 · -29.7%
- By 2100
- 37,126 · -39.8%
Race, ethnicity, and origin ACS 2023
- Neighborhood character
- Predominantly White (83%)
- Race & ethnicity
- White 83% Hispanic / Latino 11% Two or more races 7% Black 4%
- Hispanic origin (detail)
- Puerto Rican 11%
- Common ancestry
- Romanian 7% Subsaharan African 4% Polish 3%
- Foreign-born
- 3% · Canada
- Languages at home
- 97% English-only · Spanish 2%
Political lean MEDSL · Carbon
- 2024 margin
- Solid R (+34.8) · D 32.2% · R 67.0%
- 2008→2024 swing
- -36.7pp toward R · 2008: 1.9pp · 2024: -34.8pp
- All cycles
- 2024: R+34.8 2020: R+32.0 2016: R+34.1 2012: R+6.9 2008: D+1.9
Not yet ingested
- Civics
- —
Market trends
- HPI YoY
- ▼ -2.08%
- Current HPI
- 190.5896
- Rent YoY
- —
- Metro
- —
- State GDP YoY
- ▲ 1.68%
- F500 in state
- 34
Industry mix (Fortune 500 HQ in PA)
| Industry | F500 HQs | Revenue |
|---|---|---|
| Healthcare | 2 | $309B |
|
||
| Insurance | 2 | $27B |
|
||
| Telecommunications / Media | 1 | $124B |
|
||
| Industrial Distribution | 1 | $22B |
|
||
| Financial Services | 1 | $20B |
|
||
| Chemicals / Materials | 1 | $18B |
|
||
Price history
+899.3% since first listed8 events — show timeline
- 2026-05-24 Listed $149,900 GLVRMLS
- 2026-05-24 Listed $149,900 BRIGHT MLS
- 2022-10-14 Listing Removed — GLVRMLS
- 2019-01-18 Sold (MLS) $39,900 PMAR
- 2018-11-19 Sold (Public Records) $39,000 Public Records
- 2018-08-21 Listed $39,900 GLVRMLS
- 2018-08-20 Listed $39,900 PMAR
- 2014-04-24 Sold (Public Records) $15,000 Public Records
Property tax history
+2.0%/yrLatest (2026): $2,147 · +2.7% YoY. Source: county tax records.
Cash-flow waterfall
monthlySold comps — $/sqft
last 12 mo · ≤1 miLoading sold comps…