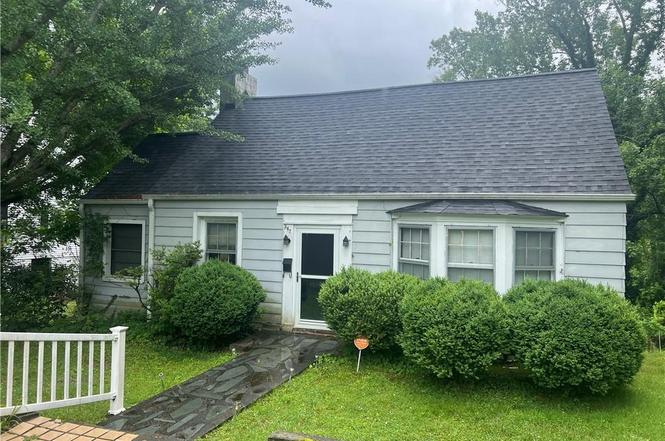
342 Moore Ave · Mount Airy, NC
Flood risk 1/10 · Minimal
- FEMA flood zone
- X (unshaded)
- Chance of flooding over 30 yrs
- 0.0%
- Est. flood insurance / yr
- $473 – $860
Fire risk 3/10 · Minor
- Est. fire insurance / yr
- $906 – $1,684
Heat risk 5/10 · Moderate
- Hot days now (above 100°F)
- 7 days/yr
- Hot days in 30 yrs
- 19 days/yr
Wind risk 2/10 · Minimal
- Chance of severe wind over 30 yrs
- 1.0%
Air-quality risk 1/10 · Minimal
- Unhealthy air days now
- 0 days/yr
- Unhealthy air days in 30 yrs
- 0 days/yr
Risk factors via First Street. Map © Google.
Why this score? — see what drove the B- grade
The composite is a weighted blend of 9 inputs, each scored 0–100. Each bar is that input's sub-score; the figure is the points it added to the 100-point composite (weight × sub-score).
- Cash flow +30.0/30.0
- DSCR +10.0/10.0
- ARV discount +7.5/15.0
- 1% rule +7.3/10.0
- Schools +4.1/10.0
- Livability +3.1/5.0
- Rent growth +2.5/5.0
- Condition / age +2.5/5.0
- Appreciation +0.0/10.0
$119,000
🖨 Deal sheet (PDF) 📄 Offer letter ✓ Due diligence
Listing remarks
This city cottage has 3 bedrooms, 1.5 baths, kitchen, dining, living room and sewing room all on the street level. It is built solid! The construction is block with siding over the block. Knotty pine paneling and some hardwood floors. Repurpose and restore this to a charming home in the city of Mt. Airy in walking distance to the central business district of Mt. Airy with numerous fine dining options, clothing shops, ice cream shops, coffee shops and professional services including banking, insurance, accounting and more. It is right around the corner from Riverside Park. The Ararat Rover offers kayaking and trout fishing. Homes under $250,000 are a bit rare today as inventory is low. Look
Key facts
- Riverside park
- Knotty pine paneling
- Hardwood floors
Tags
Property features AI
Finance
- HOA & community: No homeowners association
Exterior
- Parking: On-street parking
- Utilities: Public water; Public sewer; Electric water heater
- Home design: Single-story house; Stick/site-built residential property; Built in 1945; Existing structure
- Construction: Block and composite siding construction
- Exterior features: City lot that is cleared and sloped; Irregular lot dimensions
Interior
- Kitchen: Kitchen on the main level; Electric water heater
- Bedrooms: Bedrooms located on the main level
- Bathrooms: One full bathroom; One half bathroom
- Heating & cooling: Forced air heating (oil-fired); Central air conditioning
- Interior features: Primary bedroom on the main level; Attic with access only; Unfinished basement with crawl space
- Laundry & utility: Basement utility space
Neighborhood map
What this means for you Summary
Snapshot
- This is a 3-bed/1.0-bath single-family listed at $119k.
Deal economics
- At list price, monthly cash flow is $461 ($6k/yr) — positive.
- The deal already cash-flows at list — no discount required.
- Meets the 1% rule at list price ($1k rent vs $119k).
- Recommended offer: $105k (12.0% below list) — sets the bar for market timing.
- Cap rate 10.9% vs local median 3.1% in Mount Airy — top-decile yield for the area; either an underpriced asset or a hidden risk that comps aren't pricing in. Stress-test before assuming the spread holds.
Location & tenants
- Location reads 62/100 on livability (#473 in NC) — a middle-class / working-renter tenant base. Strengths: cost of living A+; Watch: crime D+, amenities F, commute F.
- Mount Airy City Schools (town): math 51% / reading 49% proficiency, ranked #69 of 178 in NC (top 39%) — acceptable for families but not a draw, mixed tenant base, ~2y average lease.
- Zoned schools: Bruce H. Tharrington Primary (392 students, 99% FRL); Mount Airy Middle (math 49% / reading 49%, grade C-, #122 of 475 statewide, top 26%, 409 students, 57% FRL); Mount Airy High (math 62% / reading 67%, grade B-, #164 of 535 statewide, top 32%, 582 students, 52% FRL) — zoned schools average 70% FRL vs 54% district-wide (15 pts higher); higher-poverty schools than district average — tighter screening recommended.
- Market conditions: 215 active listings in the ZIP; 3 comparable units currently listed for rent nearby; rentals lingering (median 46d on market — plan ~5-8 weeks vacancy on turnover, expect pricing pressure); 100% of comp listings sitting > 30 days — soft ceiling on asking rent; 243 units permitted in Surry County in 2024 (0 in 5+ unit buildings).
- This rent runs 38% of the median local income ($46k/yr) — at the standard rent-burdened threshold; future hikes will face affordability resistance.
Forward outlook
- Local home prices are declining (-3.0%/yr); year-one equity from $823 of loan paydown is wiped out by about $4k of value loss. Plan a longer hold.
- Surry County population projected at -22% by 2050 — secular population decline; favor cash flow + early exit over multi-decade hold.
- At projected returns (-3.0% appreciation + 3.0% rent growth), your $33k cash investment doubles in ~8 years — after that, you're playing with house money.
Negotiation context
- It's been on market 267 days — a 12% lower offer ($105k) is reasonable based on typical stale-listing flexibility.
- 4 sale attempts; this cycle's ask has dropped $10k (8%) from the opening price — seller is motivated, your offer sets the floor, not the list.
Risks & watch-outs
- Watch-outs: built in 1945 — expect roof / HVAC / electrical / plumbing capex.
- Climate carrying-cost: extreme-heat days projected 7→19/yr by 2055 (HVAC capex compounding) — expect insurance premiums to compound above CPI over the hold.
Questions for the listing agent
- It's been on market 267 days. Have you received any prior offers? Is the seller open to a 12% concession, seller financing, or rate buy-down credit?
- Built in 1945 — when were the roof, HVAC, electrical panel, plumbing, and water heater last replaced?
- Why hasn't it sold? Are there any deal-killer items the seller is aware of (foundation, flood, title, zoning, code violations)?
- Is there a deadline driving the sale (1031 exchange, divorce, estate, relocation)? That informs how much negotiation room exists.
- Schools are D-rated, which usually means shorter tenancies and higher turnover. Who's the typical renter profile here, and what's been the actual vacancy rate?
- Crime grade is D in this area — have there been break-ins, vandalism, or insurance claims at this property in the last 3 years? What carrier currently insures it and at what premium?
- What's the average days-on-market for RENTAL listings here right now (not sales)? A rising rental-DOM trend means longer vacancies and softer asking-rent achievability than the comps imply.
- What's the recent tenant-quality profile in this submarket — average credit score on applications, eviction rate, late-payment / NSF rate, and stable-employment percentage? A property-management company in the area should have these aggregated.
- How much new for-sale + rental construction is in the pipeline within 1–3 miles? Heavy new supply typically softens prices + rents 12–24 months out; constrained supply supports both.
Investment metrics
- 1% rule
- 1.23% ✓
- Cap rate
- 10.94%
- Cash-on-cash
- 16.59%
- DSCR
- 1.74
- GRM
- 6.8
CMA / ARV
- ARV (on-the-fly)
- $251,369
- Comps found
- 12
Show comp detail 12 sales within ~0.75 mi
| Address | Dist | Beds/Ba | Sqft | Sold | Price | $/sf | Match |
|---|---|---|---|---|---|---|---|
| 420 Junction St | 0.15mi | 4/1.0 (+1) | 1,620 (+12%) | 0mo | $75,000 | $46 | 68 |
| 611 Arch St | 0.34mi | 3/1.0 | 1,282 (-12%) | 1mo | $226,200 | $176 | 64 |
| 318 E Independence Blvd | 0.17mi | 3/1.0 | 1,267 (-13%) | 10mo | $153,000 | $121 | 62 |
| 239 E Elm St | 0.35mi | 3/2.0 | 1,540 (+6%) | 17mo | $270,000 | $175 | 56 |
| 233 E Elm St | 0.36mi | 3/2.0 | 1,540 (+6%) | 18mo | $270,000 | $175 | 55 |
| 313 Hunter Dr | 0.47mi | 3/2.0 | 1,267 (-13%) | 0mo | $260,000 | $205 | 52 |
| 501 Spring St | 0.46mi | 3/2.0 | 1,325 (-9%) | 12mo | $215,000 | $162 | 50 |
| 517 Kyle St | 0.55mi | 3/2.0 | 1,321 (-9%) | 10mo | $250,000 | $189 | 47 |
| 332 E Wilson St | 0.31mi | 3/2.0 | 1,272 (-12%) | 18mo | $220,000 | $173 | 46 |
| 144 W Elm St | 0.49mi | 2/1.0 (-1) | 1,264 (-13%) | 8mo | $200,000 | $158 | 43 |
| 245 E Lebanon St | 0.57mi | 2/1.0 (-1) | 1,628 (+12%) | 12mo | $154,000 | $95 | 38 |
| 240 Byerly St | 0.73mi | 3/1.5 | 1,260 (-13%) | 11mo | $218,000 | $173 | 33 |
Match score weights: distance 35% · size 25% · config 20% · recency 20%. Top-matched comps best support the ARV.
Projected returns pro-forma
-3.0% appreciation · 3.0% rent growth · sell at horizon
- IRR
- 7.7%
- Equity multiple
- 1.30×
- Total profit
- $9,998
- Equity at exit
- $17,743
- IRR
- 16.9%
- Equity multiple
- 2.39×
- Total profit
- $46,263
- Equity at exit
- $10,289
Cash invested: $33,320 (down + closing). Projections, not guarantees.
Landlord ↔ Tenant lean methodology
- Overall (STATE)
- 85 Strongly Landlord-Friendly
- State North Carolina
- 85 Strongly Landlord-Friendly · R+3
- County
- — inherits STATE
- City
- — inherits STATE
ZIP-level market 27030
- Active inventory
- 215
- Price-to-rent
- 6.8×
Monthly cashflow live
- Estimated rent
- $1,468 medium interval (Pro) →
- Mortgage (P&I)
- −$624
- Tax from tax record
- −$26 /mo · $308/yr
- Insurance
- −$50
- HOA
- −$0
- Vacancy / Maint / Mgmt
- −$308
- Net cashflow
- $461
Break-even live
Sensitivity live
| Price | -10% $528 | -5% $494 | +0% $461 | +5% $427 | +10% $393 |
|---|---|---|---|---|---|
| Rent | -10% $345 | -5% $403 | +0% $461 | +5% $519 | +10% $577 |
| Rate | -1.0pp $521 | -0.5pp $491 | base $461 | +0.5pp $430 | +1.0pp $398 |
UW: 25.0% down · 7.5% · 30yr · 1.5% tax · 5.0% vac · 8.0% maint · 8.0% mgmt
Financing live
Cash to close
- Down payment
- $29,750
- Closing costs
- $3,570
- Reserves months
- —
- Total cash needed
- —
Loan-product check · same deal, 3 products live
Conventional
25% down · 7.5% · 30yr
- Down + closing
- —
- Monthly P&I
- —
- Monthly cashflow
- —
- DSCR
- —
- Eligible?
- —
Personal DTI + credit; lowest rate.
DSCR
20% down · 8.5% · 30yr
- Down + closing
- —
- Monthly P&I
- —
- Monthly cashflow
- —
- DSCR
- —
- Eligible?
- —
No personal income docs; deal must DSCR.
Hard money
10% down · 12.0% · 12mo
- Down + closing
- —
- Monthly P&I
- —
- Monthly cashflow
- —
- DSCR
- —
- Eligible?
- —
Short-term bridge; refi at stabilization.
Rent comps 3 comps
| Address | Beds | Baths | Sqft | Rent | $/sqft | DOM | Units | Dist |
|---|---|---|---|---|---|---|---|---|
| 335 Willow St Mount Airy, NC | 1.0–2.0 | 1.0–2.0 | 815 | $1,641 | $2.01 | 46d | 9 | 0.37mi |
| 148 Churchill Ln Mt Airy, NC | 2.0 | 1.0 | 960 | $1,150 | $1.20 | 46d | 1 | 0.56mi |
| 134 Northwood Dr Mt Airy, NC | 2.0 | 2.0 | 1000 | $1,499 | $1.50 | 46d | 2 | 1.27mi |
Listing history 26 events
-
2026-06-22days on market $119,000 Active 267 DOM
-
2026-06-21days on market $119,000 Active 266 DOM
-
2026-06-19days on market $119,000 Active 264 DOM
-
2026-06-18days on market $119,000 Active 263 DOM
-
2026-06-17days on market $119,000 Active 262 DOM
-
2026-06-16days on market $119,000 Active 261 DOM
-
2026-06-15days on market $119,000 Active 260 DOM
-
2026-06-14days on market $119,000 Active 258 DOM
-
2026-06-12days on market $119,000 Active 257 DOM
-
2026-06-09days on market $119,000 Active 254 DOM
-
2026-06-08days on market $119,000 Active 253 DOM
-
2026-06-07days on market $119,000 Active 252 DOM
-
2026-06-05days on market $119,000 Active 249 DOM
-
2026-06-03days on market $119,000 Active 248 DOM
-
2026-06-02days on market $119,000 Active 247 DOM
-
2026-06-01days on market $119,000 Active 246 DOM
-
2026-05-31days on market $119,000 Active 245 DOM
-
2026-05-30days on market $119,000 Active 244 DOM
-
2026-02-27status Active
-
2026-02-03status Pending
-
2025-10-30status Active
-
2025-10-08status Pending
-
2025-09-25price $119,000
-
2025-08-25status Active
-
2025-06-11status Pending
-
2025-05-30$129,000 Active
ⓘ Source: listings_history table (triggers on properties + properties_extension) + one-shot
backfill from property_details.listing_events for pre-trigger history.
Tax reassessment forecast NC · Resets to sale price
- Current annual tax
- $308 · $26/mo
- Projected year-2 tax
- $976 · $81/mo
- Expected delta
- +$667/yr (+$56/mo · 216.3%)
ⓘ Screening estimate from a state-policy table — verify with the county assessor before closing.
Climate risk First Street
- Flood 1/10 Low FEMA zone X (unshaded) · 0% chance over 30 yrs
- Wildfire 3/10 Moderate
- Heat 5/10 Major 7 d/yr ≥100°F today · 19 d/yr by 30 yrs out
- Wind 2/10 Low 100% chance of damaging wind over 30 yrs
- Air quality 1/10 Low 0 unhealthy d/yr today · 0 by 30 yrs out
Nearby sold comps map
Loading sold comps map…
Walkable amenities ~0.75 mi
Loading nearby amenities…
Taxation est. · year 1
- Rental income
- $17,619
- − Mortgage interest
- −$6,666
- − Property taxes
- −$308
- − Insurance
- −$595
- − Repairs & maintenance
- −$1,410
- − Management
- −$1,410
- − Depreciation
- −$3,462
- Taxable income
- $3,769
- Est. tax owed @ 24.0%
- −$905
- After-tax cash flow
- $4,623/yr
For passive investors: Depreciation is non-cash, so a rental often shows a tax loss while cash-flowing — sheltering income. Rental losses are passive: they offset passive income freely, and up to $25,000/yr can offset ordinary (W-2) income if you actively participate and your MAGI is under $100k (phasing out to $0 by $150k); unused losses carry forward. On sale, claimed depreciation is recaptured at up to 25%, and gains may owe capital-gains tax (a 1031 exchange can defer both). Figures are a year-1 estimate at your 24.0% rate — not tax advice; consult a CPA.
Schools (NCES district)
- District
- Mount Airy City Schools
- NCES district ID
- 3703210
- Math proficiency
- 51% ▲ 8.00%
- Reading proficiency
- 49% ▲ 2.00%
- Median HH income
- $33,113
- Composite
- 41.19/100
- National rank
- #3546
- State rank
- #69 of 178 in NC
Livability — Mount Airy
- Score
- 62/100
- State rank
- #473
- US rank
- #17188
Category grades
Schools grade is shown separately in the Schools card above.
Census & demographics
- Census place
- Mount Airy, NC
- County
- Surry County · 36,241 people
- City population
- 36,241
- Metro
- Mount Airy, NC
- Population (ZIP)
- 36,241
- Household income
- $46,377
- Rent vs Own
- Severe rent burden
- 939.0
Population outlook (Surry County) Hauer SSP2
- Today (2025)
- 69,473 people
- By 2030
- 66,964 · -3.6%
- By 2040
- 60,967 · -12.2%
- By 2050
- 54,102 · -22.1%
- By 2075
- 38,806 · -44.1%
- By 2100
- 24,711 · -64.4%
Race, ethnicity, and origin ACS 2023
- Neighborhood character
- Predominantly White (83%)
- Race & ethnicity
- White 83% Hispanic / Latino 9% Two or more races 5% Black 5%
- Hispanic origin (detail)
- Mexican 7%
- Common ancestry
- Serbian 2% Slovak 2% Italian 1%
- Foreign-born
- 4% · Canada
- Languages at home
- 92% English-only · Spanish 6% Other Asian/Pacific 1%
Political lean MEDSL · Surry
- 2024 margin
- Solid R (+53.3) · D 23.0% · R 76.3%
- 2008→2024 swing
- -25.4pp toward R · 2008: -28.0pp · 2024: -53.3pp
- All cycles
- 2024: R+53.3 2020: R+51.4 2016: R+50.7 2012: R+36.9 2008: R+28.0
Not yet ingested
- Civics
- —
Market trends
- HPI YoY
- ▼ -132.64%
- Current HPI
- 177.1549
- Rent YoY
- —
- Metro
- Mount Airy, NC
- State GDP YoY
- ▲ 3.28%
- F500 in state
- 26
Industry mix (Fortune 500 HQ in NC)
| Industry | F500 HQs | Revenue |
|---|---|---|
| Financial Services | 2 | $213B |
|
||
| Retail | 2 | $95B |
|
||
| Industrial Conglomerate | 1 | $38B |
|
||
| Metals / Steel | 1 | $35B |
|
||
| Utilities | 1 | $30B |
|
||
| Industrial Machinery | 1 | $19B |
|
||
Price history
-7.8% since first listed8 events — show timeline
- 2026-02-27 Relisted — Triad MLS
- 2026-02-03 Pending — Triad MLS
- 2025-10-30 Relisted — Triad MLS
- 2025-10-08 Pending — Triad MLS
- 2025-09-25 Price Changed $119,000 Triad MLS
- 2025-08-25 Relisted — Triad MLS
- 2025-06-11 Pending — Triad MLS
- 2025-05-30 Listed $129,000 Triad MLS
Property tax history
+0.2%/yrLatest (2025): $308 · +21.1% YoY. Source: county tax records.
Cash-flow waterfall
monthlySold comps — $/sqft
last 12 mo · ≤1 miLoading sold comps…