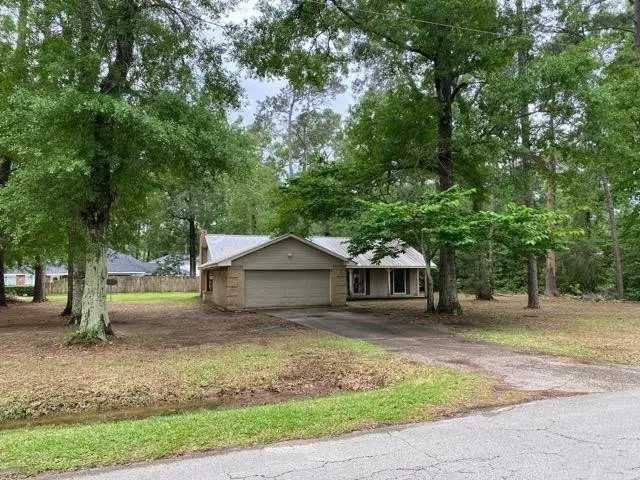
272 County Road 337 · Cleveland, TX
Flood risk 1/10 · Minimal
- FEMA flood zone
- X (unshaded)
- Chance of flooding over 30 yrs
- 0.0%
- Est. flood insurance / yr
- $507 – $1,088
Fire risk 5/10 · Moderate
- Est. fire insurance / yr
- $1,222 – $2,270
Heat risk 9/10 · Severe
- Hot days now (above 111°F)
- 7 days/yr
- Hot days in 30 yrs
- 24 days/yr
Wind risk 8/10 · Major
- Chance of severe wind over 30 yrs
- 99.0%
Air-quality risk 2/10 · Minimal
- Unhealthy air days now
- 1 days/yr
- Unhealthy air days in 30 yrs
- 1 days/yr
Risk factors via First Street. Map © Google.
Why this score? — see what drove the C- grade
The composite is a weighted blend of 9 inputs, each scored 0–100. Each bar is that input's sub-score; the figure is the points it added to the 100-point composite (weight × sub-score).
- ARV discount +15.0/15.0
- Cash flow +14.7/30.0
- 1% rule +4.8/10.0
- DSCR +4.5/10.0
- Rent growth +3.5/5.0
- Livability +3.1/5.0
- Condition / age +2.5/5.0
- Schools +2.1/10.0
- Appreciation +0.0/10.0
$165,000
🖨 Deal sheet (PDF) 📄 Offer letter ✓ Due diligence
Listing remarks MLS
Space, privacy, and a layout that actually makes sense—this 3-bedroom, 2-bath home in Royal Acres sits on a generous lot just under an acre, giving you room to breathe without feeling too far out. Inside, you’ve got a single-story layout with a comfortable flow, central cooling, and a fireplace that adds a nice touch to the living space. The home features an attached 2-car garage, plus a mix of open porch and patio/deck areas that work well for relaxing or weekend hangouts. With a solid brick exterior, metal roof, and slab foundation, it’s built with durability in mind. Located minutes from Plum Grove and a short drive to Cleveland for everyday essentials, dining, and local parks, this one balances space and convenience in a way that’s hard to find.
Key facts
- Single-story layout
- Central cooling
- Attached garage
Tags
Neighborhood map
What this means for you Summary
Snapshot
- This is a 3-bed/3.0-bath single-family listed at $165k.
Deal economics
- At list price, monthly cash flow is $41 ($494/yr) — positive.
- The deal already cash-flows at list — no discount required.
- To meet the 1% rule (rent ≥ 1% of price), the offer needs to be $162k (1.7% below list).
- Recommended offer: $155k (6.0% below list) — sets the bar for market timing.
- Cap rate 6.6% vs local median 4.6% in Cleveland — top-decile yield for the area; either an underpriced asset or a hidden risk that comps aren't pricing in. Stress-test before assuming the spread holds.
Location & tenants
- Location reads 61/100 on livability (#1,013 in TX) — a middle-class / working-renter tenant base. Strengths: cost of living A+, housing A+; Watch: crime D-, amenities F, commute F.
- Cleveland ISD (town): math 24% / reading 25% proficiency, ranked #723 of 826 in TX (top 88%) — low school quality limits family demand, transient renter base, plan for 1-2y turnover; 71% free/reduced lunch — lower-income household profile, screen leases tightly.
- Zoned schools: Northside El (math 33% / reading 31%, grade F, #2,268 of 4,322 statewide, top 55%, 1,235 students, 90% FRL); Cleveland Middle (math 22% / reading 25%, grade F, #1,317 of 1,662 statewide, top 80%, 1,696 students, 98% FRL); Cleveland H S (math 30% / reading 32%, grade F, #1,077 of 1,632 statewide, top 66%, 3,310 students, 92% FRL) — zoned schools average 93% FRL vs 71% district-wide (23 pts higher); higher-poverty schools than district average — tighter screening recommended.
- Market conditions: Rents rising fast (+4.0%/yr); 1577 active listings in the ZIP; 1,321 units permitted in Liberty County in 2024 (0 in 5+ unit buildings).
- This rent runs 31% of the median local income ($62k/yr) — at the standard rent-burdened threshold; future hikes will face affordability resistance.
Forward outlook
- Local home prices are declining (-3.0%/yr); year-one equity from $1k of loan paydown is wiped out by about $5k of value loss. Plan a longer hold.
- Liberty County population projected at +24% by 2050 — long-run rental-demand tailwind backs the buy-and-hold thesis.
Negotiation context
- It's been on market 62 days — a 6% lower offer ($155k) is reasonable based on typical stale-listing flexibility.
Risks & watch-outs
- Climate carrying-cost: severe wind risk, 99% chance of damaging wind over 30y; moderate wildfire risk; extreme-heat days projected 7→24/yr by 2055 (HVAC capex compounding) — expect insurance premiums to compound above CPI over the hold.
Questions for the listing agent
- It's been on market 62 days. Have you received any prior offers? Is the seller open to a 6% concession, seller financing, or rate buy-down credit?
- Why hasn't it sold? Are there any deal-killer items the seller is aware of (foundation, flood, title, zoning, code violations)?
- Is there a deadline driving the sale (1031 exchange, divorce, estate, relocation)? That informs how much negotiation room exists.
- Schools are F-rated, which usually means shorter tenancies and higher turnover. Who's the typical renter profile here, and what's been the actual vacancy rate?
- Crime grade is D in this area — have there been break-ins, vandalism, or insurance claims at this property in the last 3 years? What carrier currently insures it and at what premium?
- What's the average days-on-market for RENTAL listings here right now (not sales)? A rising rental-DOM trend means longer vacancies and softer asking-rent achievability than the comps imply.
- What's the recent tenant-quality profile in this submarket — average credit score on applications, eviction rate, late-payment / NSF rate, and stable-employment percentage? A property-management company in the area should have these aggregated.
- How much new for-sale + rental construction is in the pipeline within 1–3 miles? Heavy new supply typically softens prices + rents 12–24 months out; constrained supply supports both.
Investment metrics
- 1% rule
- 0.98% ✗
- Cap rate
- 6.59%
- Cash-on-cash
- 1.07%
- DSCR
- 1.05
- GRM
- 8.5
CMA / ARV
- ARV (median comp)
- $252,773
- List price
- $165,000
- Delta
- -34.72%
- Verdict
- UNDERPRICED
- Comps
- 19 within 1.0 mi
Show comp detail 4 sales within ~0.75 mi
| Address | Dist | Beds/Ba | Sqft | Sold | Price | $/sf | Match |
|---|---|---|---|---|---|---|---|
| 109 County Road 339 | 0.11mi | 4/2.5 (+1) | 1,601 (+2%) | 21mo | $205,000 | $128 | 66 |
| 714 County Road 3371a | 0.30mi | 3/2.0 | 1,736 (+11%) | 18mo | $199,900 | $115 | 49 |
| 365 County Road 3371 | 0.54mi | 4/3.0 (+1) | 1,764 (+13%) | 3mo | $315,000 | $179 | 46 |
| 424 Road 3371a | 0.35mi | 3/2.0 | 1,350 (-14%) | 15mo | $171,000 | $127 | 44 |
Match score weights: distance 35% · size 25% · config 20% · recency 20%. Top-matched comps best support the ARV.
Projected returns pro-forma
-3.0% appreciation · 4.0% rent growth · sell at horizon
- IRR
- -13.3%
- Equity multiple
- 0.52×
- Total profit
- $-22,381
- Equity at exit
- $24,602
- IRR
- -2.7%
- Equity multiple
- 0.81×
- Total profit
- $-8,862
- Equity at exit
- $14,266
Cash invested: $46,200 (down + closing). Projections, not guarantees.
Landlord ↔ Tenant lean methodology
- Overall (STATE)
- 87 Strongly Landlord-Friendly
- State Texas
- 87 Strongly Landlord-Friendly · R+5
- County
- — inherits STATE
- City
- — inherits STATE
ZIP-level market 77327
- Home prices YoY
- -5.2%
- Rents YoY
- 4.0%
- Active inventory
- 1577
- Price-to-rent
- 8.5×
Monthly cashflow live
- Estimated rent
- $1,622 medium interval (Pro) →
- Mortgage (P&I)
- −$865
- Tax from tax record
- −$306 /mo · $3,675/yr
- Insurance
- −$69
- HOA
- −$0
- Vacancy / Maint / Mgmt
- −$341
- Net cashflow
- $41
Break-even live
Sensitivity live
| Price | -10% $135 | -5% $88 | +0% $41 | +5% $-6 | +10% $-52 |
|---|---|---|---|---|---|
| Rent | -10% $-87 | -5% $-23 | +0% $41 | +5% $105 | +10% $169 |
| Rate | -1.0pp $124 | -0.5pp $83 | base $41 | +0.5pp $-2 | +1.0pp $-45 |
UW: 25.0% down · 7.5% · 30yr · 1.5% tax · 5.0% vac · 8.0% maint · 8.0% mgmt
Financing live
Cash to close
- Down payment
- $41,250
- Closing costs
- $4,950
- Reserves months
- —
- Total cash needed
- —
Loan-product check · same deal, 3 products live
Conventional
25% down · 7.5% · 30yr
- Down + closing
- —
- Monthly P&I
- —
- Monthly cashflow
- —
- DSCR
- —
- Eligible?
- —
Personal DTI + credit; lowest rate.
DSCR
20% down · 8.5% · 30yr
- Down + closing
- —
- Monthly P&I
- —
- Monthly cashflow
- —
- DSCR
- —
- Eligible?
- —
No personal income docs; deal must DSCR.
Hard money
10% down · 12.0% · 12mo
- Down + closing
- —
- Monthly P&I
- —
- Monthly cashflow
- —
- DSCR
- —
- Eligible?
- —
Short-term bridge; refi at stabilization.
Listing history 15 events
-
2026-06-17status $165,000 Pending 62 DOM
-
2026-06-16days on market $165,000 Active 62 DOM
-
2026-06-15days on market $165,000 Active 61 DOM
-
2026-06-13days on market $165,000 Active 59 DOM
-
2026-06-09days on market $165,000 Active 55 DOM
-
2026-06-08days on market $165,000 Active 54 DOM
-
2026-06-07days on market $165,000 Active 53 DOM
-
2026-06-04days on market $165,000 Active 50 DOM
-
2026-06-03days on market $165,000 Active 49 DOM
-
2026-06-02days on market $165,000 Active 48 DOM
-
2026-06-01days on market $165,000 Active 47 DOM
-
2026-05-31days on market $165,000 Active 46 DOM
-
2026-04-15$165,000 Active 783-char remark
Show marketing remark (783 chars)
Space, privacy, and a layout that actually makes sense—this 3-bedroom, 2-bath home in Royal Acres sits on a generous lot just under an acre, giving you room to breathe without feeling too far out. Inside, you’ve got a single-story layout with a comfortable flow, central cooling, and a fireplace that adds a nice touch to the living space. The home features an attached 2-car garage, plus a mix of open porch and patio/deck areas that work well for relaxing or weekend hangouts. With a solid brick exterior, metal roof, and slab foundation, it’s built with durability in mind. Located minutes from Plum Grove and a short drive to Cleveland for everyday essentials, dining, and local parks, this one balances space and convenience in a way that’s hard to find.
-
2013-08-13soldstatus
-
1999-08-20soldstatus
ⓘ Source: listings_history table (triggers on properties + properties_extension) + one-shot
backfill from property_details.listing_events for pre-trigger history.
Tax reassessment forecast TX · Resets to sale price
- Current annual tax
- $3,675 · $306/mo
- Projected year-2 tax
- $3,675 · $306/mo
- Expected delta
- $0/yr ($0/mo · 0.0%)
ⓘ Screening estimate from a state-policy table — verify with the county assessor before closing.
Climate risk First Street
- Flood 1/10 Low FEMA zone X (unshaded) · 0% chance over 30 yrs
- Wildfire 5/10 Major
- Heat 9/10 Extreme 7 d/yr ≥111°F today · 24 d/yr by 30 yrs out
- Wind 8/10 Severe 99% chance of damaging wind over 30 yrs
- Air quality 2/10 Low 1 unhealthy d/yr today · 1 by 30 yrs out
Nearby sold comps map
Loading sold comps map…
Walkable amenities ~0.75 mi
Loading nearby amenities…
Taxation est. · year 1
- Rental income
- $19,465
- − Mortgage interest
- −$9,243
- − Property taxes
- −$3,675
- − Insurance
- −$825
- − Repairs & maintenance
- −$1,557
- − Management
- −$1,557
- − Depreciation
- −$4,800
- Taxable loss
- −$2,192
- Est. tax savings @ 24.0%
- +$526
- After-tax cash flow
- $1,020/yr
For passive investors: Depreciation is non-cash, so a rental often shows a tax loss while cash-flowing — sheltering income. Rental losses are passive: they offset passive income freely, and up to $25,000/yr can offset ordinary (W-2) income if you actively participate and your MAGI is under $100k (phasing out to $0 by $150k); unused losses carry forward. On sale, claimed depreciation is recaptured at up to 25%, and gains may owe capital-gains tax (a 1031 exchange can defer both). Figures are a year-1 estimate at your 24.0% rate — not tax advice; consult a CPA.
Schools (NCES district)
- District
- Cleveland ISD
- NCES district ID
- 4814370
- Math proficiency
- 24% ▼ -13.00%
- Reading proficiency
- 25% ▼ -4.00%
- Median HH income
- $39,173
- Composite
- 20.61/100
- National rank
- #8549
- State rank
- #723 of 826 in TX
Livability — Cleveland
- Score
- 61/100
- State rank
- #1013
- US rank
- #17943
Category grades
Schools grade is shown separately in the Schools card above.
Census & demographics
- County
- Liberty County · 82,189 people
- City population
- 17,208
- Metro
- Houston-The Woodlands-Sugar Land, TX
- Population (ZIP)
- 42,685
- Household income
- $62,219
- Rent vs Own
- Severe rent burden
- 437.0
Population outlook (Liberty County) Hauer SSP2
- Today (2025)
- 87,956 people
- By 2030
- 92,161 · +4.8%
- By 2040
- 100,784 · +14.6%
- By 2050
- 109,471 · +24.5%
- By 2075
- 133,470 · +51.7%
- By 2100
- 147,372 · +67.6%
Race, ethnicity, and origin ACS 2023
- Neighborhood character
- Diverse neighborhood (Simpson 0.57)
- Race & ethnicity
- Hispanic / Latino 54% White 36% Two or more races 18% Black 8% Native American 2%
- Hispanic origin (detail)
- Mexican 42%
- Common ancestry
- Lithuanian 2% Serbian 1% Slovak 0%
- Foreign-born
- 22% · Canada
- Languages at home
- 51% English-only · Spanish 48%
Political lean MEDSL · Liberty
- 2024 margin
- Solid R (+61.6) · D 19.0% · R 80.6%
- 2008→2024 swing
- -17.9pp toward R · 2008: -43.7pp · 2024: -61.6pp
- All cycles
- 2024: R+61.6 2020: R+59.7 2016: R+58.0 2012: R+53.3 2008: R+43.7
Not yet ingested
- Civics
- —
Market trends
- HPI YoY
- ▼ -12.39%
- Current HPI
- 224.9222
- Rent YoY
- ▲ 4.00%
- Metro
- Houston-The Woodlands-Sugar Land, TX
- State GDP YoY
- ▲ 3.95%
- F500 in state
- 110
Industry mix (Fortune 500 HQ in TX)
| Industry | F500 HQs | Revenue |
|---|---|---|
| Energy | 16 | $1,198B |
|
||
| Technology | 5 | $198B |
|
||
| Engineering / Construction | 4 | $72B |
|
||
| Energy Services | 3 | $60B |
|
||
| Utilities | 3 | $41B |
|
||
| Healthcare | 2 | $330B |
|
||
Price history
3 events — show timeline
- 2026-04-15 Listed $165,000 HARMLS
- 2013-08-13 Sold (Public Records) — Public Records
- 1999-08-20 Sold (Public Records) — Public Records
Property tax history
+5.2%/yrLatest (2025): $3,675 · +1.0% YoY. Source: county tax records.
Cash-flow waterfall
monthlySold comps — $/sqft
last 12 mo · ≤1 miLoading sold comps…