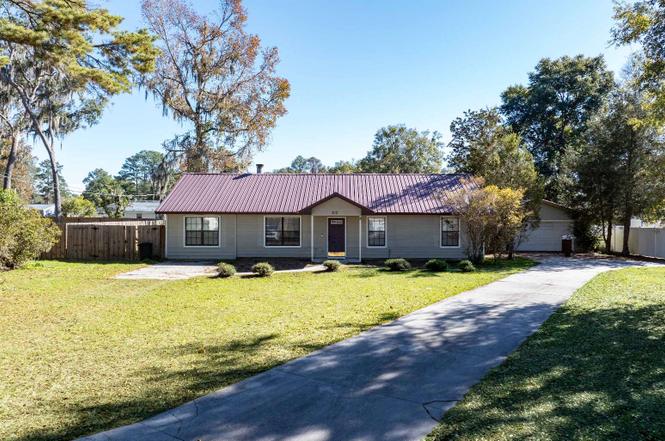
212 SE Carob Gln · Watertown, FL
Flood risk 1/10 · Minimal
- FEMA flood zone
- X (unshaded)
- Chance of flooding over 30 yrs
- 0.0%
- Est. flood insurance / yr
- $507 – $1,088
Fire risk 6/10 · Moderate
- Est. fire insurance / yr
- $947 – $1,759
Heat risk 8/10 · Major
- Hot days now (above 107°F)
- 7 days/yr
- Hot days in 30 yrs
- 20 days/yr
Wind risk 9/10 · Severe
- Chance of severe wind over 30 yrs
- 99.0%
Air-quality risk 5/10 · Moderate
- Unhealthy air days now
- 9 days/yr
- Unhealthy air days in 30 yrs
- 10 days/yr
Risk factors via First Street. Map © Google.
Why this score? — see what drove the F grade
The composite is a weighted blend of 9 inputs, each scored 0–100. Each bar is that input's sub-score; the figure is the points it added to the 100-point composite (weight × sub-score).
- Appreciation +10.0/10.0
- Cash flow +7.6/30.0
- Schools +4.5/10.0
- Livability +3.0/5.0
- Rent growth +2.5/5.0
- Condition / age +2.5/5.0
- DSCR +1.7/10.0
- 1% rule +1.5/10.0
- ARV discount +0.0/15.0
$279,000
🖨 Deal sheet 📄 Offer letter ✓ Due diligence
Listing remarks MLS
Well hello Ms. charming ; ) Request a tour today of this well-cared-for 3/2 on a beautifully landscaped fenced lot. It features a spacious kitchen with stainless steel appliances, high ceilings, cozy fireplace, metal roof, and a 24 x 24 detached garage. The separate sizable family room could function as an office, kids' playroom, or fourth bedroom! It's located at the end of the quiet neighborhood street. You will love this one!
Key facts
- Metal roof
- Versatile room
- Cozy fireplace
Tags
Property features AI
Exterior
- Parking: Detached 2-car garage
- Utilities: Private well water
- Home design: Residential property; Single-story
- Construction: Frame construction; Metal roof
- Exterior features: Screened patio/porch; Wood fencing; Workshop on property
Interior
- Kitchen: Dishwasher; Refrigerator; Microwave
- Flooring: Carpet; Hardwood
- Bathrooms: 2 full bathrooms
- Heating & cooling: Central heating (electric); Central air conditioning; Ceiling fans
- Interior features: Vaulted ceilings
Neighborhood map
What this means for you Summary
Snapshot
- This is a 3-bed/2.0-bath single-family listed at $279k.
Deal economics
- At list price, monthly cash flow is $-330 ($-4k/yr) — negative.
- To cash-flow at today's rent, offer at most $221k (20.9% below list).
- To meet the 1% rule (rent ≥ 1% of price), the offer needs to be $180k (35.3% below list).
- Recommended offer: $180k (35.3% below list) — sets the bar for 1% rule.
Location & tenants
- Location reads 60/100 on livability (#798 in FL) — a middle-class / working-renter tenant base. Strengths: crime A+, cost of living A+, housing A-; Watch: schools F, amenities F, commute F.
- Columbia (town): math 53% / reading 54% proficiency, ranked #25 of 73 in FL (top 34%) — acceptable for families but not a draw, mixed tenant base, ~2y average lease.
- Market conditions: 143 active listings in the ZIP; 178 units permitted in Columbia County in 2024 (0 in 5+ unit buildings).
- This rent runs 39% of the median local income ($55k/yr) — at the standard rent-burdened threshold; future hikes will face affordability resistance.
Forward outlook
- In year one you build about $30k of equity ($2k loan paydown + $28k appreciation (10.0% local appreciation)).
- Columbia County population projected to shrink 7% by 2050 — rents likely to lag national; underwrite the cash flow, not the appreciation.
- By year 2, paydown + projected appreciation supports a ~$48k cash-out refi (75% LTV) — recoverable capital for the next deal without selling this one.
Negotiation context
- It's been on market 175 days — a 12% lower offer ($246k) is reasonable based on typical stale-listing flexibility.
- 2 sale attempts since 3y ago with the ask held roughly flat each time — persistent listings suggest the price (not the market) is what's stuck; bring a comps-based counter.
- Current owner paid $240k; 16% above their basis — modest negotiation headroom, anchor on the comps not their cost.
Risks & watch-outs
- Climate carrying-cost: severe wind risk, 99% chance of damaging wind over 30y; major wildfire risk; extreme-heat days projected 7→20/yr by 2055 (HVAC capex compounding) — expect insurance premiums to compound above CPI over the hold.
Questions for the listing agent
- What do current leases actually rent for vs. the listed asking? Can we see a recent rent roll and the last 12 months of T-12 income?
- It's been on market 175 days. Have you received any prior offers? Is the seller open to a 35% concession, seller financing, or rate buy-down credit?
- Why hasn't it sold? Are there any deal-killer items the seller is aware of (foundation, flood, title, zoning, code violations)?
- Is there a deadline driving the sale (1031 exchange, divorce, estate, relocation)? That informs how much negotiation room exists.
- Schools are F-rated, which usually means shorter tenancies and higher turnover. Who's the typical renter profile here, and what's been the actual vacancy rate?
- The area grade is low — what's the realistic commute time and amenity access for the typical tenant pool here? Any planned neighborhood developments (good or bad) we should know about?
- What's the average days-on-market for RENTAL listings here right now (not sales)? A rising rental-DOM trend means longer vacancies and softer asking-rent achievability than the comps imply.
- What's the recent tenant-quality profile in this submarket — average credit score on applications, eviction rate, late-payment / NSF rate, and stable-employment percentage? A property-management company in the area should have these aggregated.
- How much new for-sale + rental construction is in the pipeline within 1–3 miles? Heavy new supply typically softens prices + rents 12–24 months out; constrained supply supports both.
Investment metrics
- 1% rule
- 0.65% ✗
- Cap rate
- 4.87%
- Cash-on-cash
- -5.07%
- DSCR
- 0.77
- GRM
- 12.9
CMA / ARV
- ARV (on-the-fly)
- $221,832
- Comps found
- 12
Show comp detail 12 sales within ~0.75 mi
| Address | Dist | Beds/Ba | Sqft | Sold | Price | $/sf | Match |
|---|---|---|---|---|---|---|---|
| 186 SE Rosewood Cir | 0.23mi | 2/1.5 (-1) | 1,448 (+3%) | 6mo | $235,000 | $162 | 72 |
| 158 SE Plant St | 0.40mi | 3/2.0 | 1,340 (-5%) | 8mo | $259,000 | $193 | 68 |
| 465 SE Rosewood Cir | 0.31mi | 2/2.0 (-1) | 1,488 (+6%) | 6mo | $255,000 | $171 | 65 |
| 406 SE Pearl Ter | 0.24mi | 2/2.0 (-1) | 1,288 (-8%) | 9mo | $219,000 | $170 | 63 |
| 772 SE Defender Dr | 0.35mi | 3/1.5 | 1,509 (+8%) | 8mo | $170,000 | $113 | 63 |
| 208 SE Elm Loop | 0.28mi | 3/2.0 | 1,230 (-12%) | 7mo | $192,500 | $157 | 60 |
| 173 SE Jenese Way | 0.34mi | 2/2.0 (-1) | 1,216 (-13%) | 0mo | $180,000 | $148 | 57 |
| 741 SE Rosewood Cir | 0.21mi | 2/2.0 (-1) | 1,193 (-15%) | 6mo | $189,000 | $158 | 55 |
| 201 SE Rosewood Cir | 0.26mi | 2/2.0 (-1) | 1,220 (-13%) | 7mo | $187,000 | $153 | 55 |
| 795 SE Defender Dr | 0.37mi | 3/1.5 | 1,568 (+12%) | 8mo | $193,500 | $123 | 55 |
| 465 SE Golf Club Ave | 0.50mi | 3/2.0 | 1,215 (-14%) | 0mo | $175,000 | $144 | 54 |
| 240 SE Cameron Ter | 0.73mi | 3/2.0 | 1,225 (-13%) | 5mo | $235,000 | $192 | 40 |
Match score weights: distance 35% · size 25% · config 20% · recency 20%. Top-matched comps best support the ARV.
Projected returns pro-forma
10.0% appreciation · 3.0% rent growth · sell at horizon
- IRR
- 20.7%
- Equity multiple
- 2.68×
- Total profit
- $130,866
- Equity at exit
- $251,345
- IRR
- 18.8%
- Equity multiple
- 6.14×
- Total profit
- $401,740
- Equity at exit
- $542,036
Cash invested: $78,120 (down + closing). Projections, not guarantees.
Landlord ↔ Tenant lean methodology
- Overall (STATE)
- 87 Strongly Landlord-Friendly
- State Florida
- 87 Strongly Landlord-Friendly · R+3
- County
- — inherits STATE
- City
- — inherits STATE
ZIP-level market 32025
- Home prices YoY
- 6.8%
- Active inventory
- 143
- Price-to-rent
- 12.9×
Monthly cashflow live
- Estimated rent
- $1,804 medium interval (Pro) →
- Mortgage (P&I)
- −$1,463
- Tax from tax record
- −$176 /mo · $2,106/yr
- Insurance
- −$116
- HOA
- −$0
- Vacancy / Maint / Mgmt
- −$379
- Net cashflow
- $-330
Break-even live
UW: 25.0% down · 7.5% · 30yr · 1.5% tax · 5.0% vac · 8.0% maint · 8.0% mgmt
Financing live
Cash to close
- Down payment
- $69,750
- Closing costs
- $8,370
- Reserves months
- —
- Total cash needed
- —
Loan-product check · same deal, 3 products live
Conventional
25% down · 7.5% · 30yr
- Down + closing
- —
- Monthly P&I
- —
- Monthly cashflow
- —
- DSCR
- —
- Eligible?
- —
Personal DTI + credit; lowest rate.
DSCR
20% down · 8.5% · 30yr
- Down + closing
- —
- Monthly P&I
- —
- Monthly cashflow
- —
- DSCR
- —
- Eligible?
- —
No personal income docs; deal must DSCR.
Hard money
10% down · 12.0% · 12mo
- Down + closing
- —
- Monthly P&I
- —
- Monthly cashflow
- —
- DSCR
- —
- Eligible?
- —
Short-term bridge; refi at stabilization.
Listing history 21 events
-
2026-06-19days on market $279,000 Active 175 DOM
-
2026-06-18days on market $279,000 Active 174 DOM
-
2026-06-17days on market $279,000 Active 173 DOM
-
2026-06-16days on market $279,000 Active 172 DOM
-
2026-06-15days on market $279,000 Active 171 DOM
-
2026-06-14days on market $279,000 Active 169 DOM
-
2026-06-12days on market $279,000 Active 168 DOM
-
2026-06-09days on market $279,000 Active 165 DOM
-
2026-06-08days on market $279,000 Active 164 DOM
-
2026-06-07days on market $279,000 Active 163 DOM
-
2026-06-05days on market $279,000 Active 160 DOM
-
2026-06-03days on market $279,000 Active 159 DOM
-
2026-06-02days on market $279,000 Active 158 DOM
-
2026-06-01days on market $279,000 Active 157 DOM
-
2026-05-31days on market $279,000 Active 156 DOM
-
2026-05-30days on market $279,000 Active 155 DOM
-
2026-01-25price $279,000
-
2025-12-26$285,000 Active
-
2023-02-01soldstatus $239,900 Closed 432-char remark
Show marketing remark (432 chars)
Well hello Ms. charming ; ) Request a tour today of this well-cared-for 3/2 on a beautifully landscaped fenced lot. It features a spacious kitchen with stainless steel appliances, high ceilings, cozy fireplace, metal roof, and a 24 x 24 detached garage. The separate sizable family room could function as an office, kids' playroom, or fourth bedroom! It's located at the end of the quiet neighborhood street. You will love this one!
-
2023-01-24$239,900 Active 432-char remark
Show marketing remark (432 chars)
Well hello Ms. charming ; ) Request a tour today of this well-cared-for 3/2 on a beautifully landscaped fenced lot. It features a spacious kitchen with stainless steel appliances, high ceilings, cozy fireplace, metal roof, and a 24 x 24 detached garage. The separate sizable family room could function as an office, kids' playroom, or fourth bedroom! It's located at the end of the quiet neighborhood street. You will love this one!
-
2003-07-17soldstatus $84,900
ⓘ Source: listings_history table (triggers on properties + properties_extension) + one-shot
backfill from property_details.listing_events for pre-trigger history.
Tax reassessment forecast FL · Resets to sale price
- Current annual tax
- $2,106 · $176/mo
- Projected year-2 tax
- $2,316 · $193/mo
- Expected delta
- +$209/yr (+$17/mo · 9.9%)
ⓘ Screening estimate from a state-policy table — verify with the county assessor before closing.
Climate risk First Street
- Flood 1/10 Low FEMA zone X (unshaded) · 0% chance over 30 yrs
- Wildfire 6/10 Major
- Heat 8/10 Severe 7 d/yr ≥107°F today · 20 d/yr by 30 yrs out
- Wind 9/10 Extreme 99% chance of damaging wind over 30 yrs
- Air quality 5/10 Major 9 unhealthy d/yr today · 10 by 30 yrs out
Nearby sold comps map
Loading sold comps map…
Walkable amenities ~0.75 mi
Loading nearby amenities…
Taxation est. · year 1
- Rental income
- $21,647
- − Mortgage interest
- −$15,628
- − Property taxes
- −$2,106
- − Insurance
- −$1,395
- − Repairs & maintenance
- −$1,732
- − Management
- −$1,732
- − Depreciation
- −$8,116
- Taxable loss
- −$9,063
- Est. tax savings @ 24.0%
- +$2,175
- After-tax cash flow
- $-1,783/yr
For passive investors: Depreciation is non-cash, so a rental often shows a tax loss while cash-flowing — sheltering income. Rental losses are passive: they offset passive income freely, and up to $25,000/yr can offset ordinary (W-2) income if you actively participate and your MAGI is under $100k (phasing out to $0 by $150k); unused losses carry forward. On sale, claimed depreciation is recaptured at up to 25%, and gains may owe capital-gains tax (a 1031 exchange can defer both). Figures are a year-1 estimate at your 24.0% rate — not tax advice; consult a CPA.
Schools (NCES district)
- District
- Columbia
- NCES district ID
- 1200360
- Math proficiency
- 53% ▼ -10.00%
- Reading proficiency
- 54% ▼ -3.00%
- Median HH income
- $40,053
- Composite
- 44.74/100
- National rank
- #2750
- State rank
- #25 of 73 in FL
Livability — Watertown
- Score
- 60/100
- State rank
- #798
- US rank
- #18481
Category grades
Schools grade is shown separately in the Schools card above.
Census & demographics
- County
- Columbia County · 40,507 people
- Metro
- Lake City, FL
- Population (ZIP)
- 22,948
- Household income
- $55,004
- Rent vs Own
- Severe rent burden
- 754.0
Population outlook (Columbia County) Hauer SSP2
- Today (2025)
- 68,129 people
- By 2030
- 67,501 · -0.9%
- By 2040
- 65,465 · -3.9%
- By 2050
- 63,058 · -7.4%
- By 2075
- 56,291 · -17.4%
- By 2100
- 45,243 · -33.6%
Race, ethnicity, and origin ACS 2023
- Neighborhood character
- Predominantly White (67%)
- Race & ethnicity
- White 67% Black 20% Hispanic / Latino 8% Two or more races 7%
- Hispanic origin (detail)
- Mexican 1% Puerto Rican 3% Cuban 1%
- Common ancestry
- Serbian 2% Lithuanian 2% Romanian 2%
- Foreign-born
- 3% · Canada
- Languages at home
- 91% English-only · Spanish 6% French/Haitian/Cajun 2%
Political lean MEDSL · Columbia
- 2024 margin
- Solid R (+50.2) · D 24.6% · R 74.7%
- 2008→2024 swing
- -16.4pp toward R · 2008: -33.8pp · 2024: -50.2pp
- All cycles
- 2024: R+50.2 2020: R+45.2 2016: R+44.5 2012: R+36.7 2008: R+33.8
Not yet ingested
- Civics
- —
Market trends
- HPI YoY
- ▲ 17.57%
- Current HPI
- 276.7253
- Rent YoY
- —
- Metro
- Lake City, FL
- State GDP YoY
- ▲ 3.28%
- F500 in state
- 36
Industry mix (Fortune 500 HQ in FL)
| Industry | F500 HQs | Revenue |
|---|---|---|
| Industrial Technology | 2 | $29B |
|
||
| Insurance | 2 | $17B |
|
||
| Retail | 1 | $60B |
|
||
| Technology Distribution | 1 | $58B |
|
||
| Homebuilding | 1 | $35B |
|
||
| Technology Manufacturing | 1 | $35B |
|
||
Price history
+228.6% since first listed5 events — show timeline
- 2026-01-25 Price Changed $279,000 NFMLS
- 2025-12-26 Listed $285,000 NFMLS
- 2023-02-01 Sold (MLS) $239,900 NFMLS
- 2023-01-24 Listed $239,900 NFMLS
- 2003-07-17 Sold (Public Records) $84,900 Public Records
Property tax history
+6.7%/yrLatest (2025): $2,106 · -13.8% YoY. Source: county tax records.
Cash-flow waterfall
monthlySold comps — $/sqft
last 12 mo · ≤1 miLoading sold comps…