 Duplex
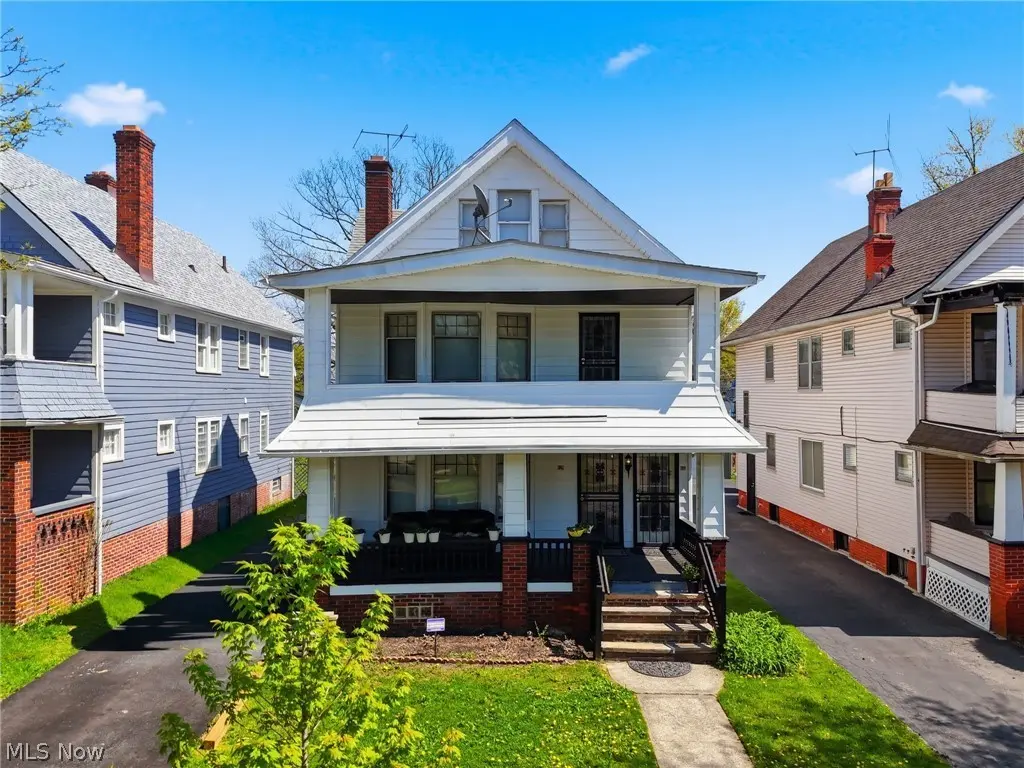
829 Helmsdale Rd · Cleveland Heights, OH
Flood risk 6/10 · Moderate
- FEMA flood zone
- X (unshaded)
- Chance of flooding over 30 yrs
- 0.74%
- Est. flood insurance / yr
- $473 – $860
Fire risk 1/10 · Minimal
- Est. fire insurance / yr
- $713 – $1,323
Heat risk 3/10 · Minor
- Hot days now (above 95°F)
- 7 days/yr
- Hot days in 30 yrs
- 16 days/yr
Wind risk 1/10 · Minimal
- Chance of severe wind over 30 yrs
- —
Air-quality risk 3/10 · Minor
- Unhealthy air days now
- 3 days/yr
- Unhealthy air days in 30 yrs
- 5 days/yr
Risk factors via First Street. Map © Google.
Why this score? — see what drove the C- grade
The composite is a weighted blend of 9 inputs, each scored 0–100. Each bar is that input's sub-score; the figure is the points it added to the 100-point composite (weight × sub-score).
- Cash flow +25.5/30.0
- DSCR +8.5/10.0
- 1% rule +8.4/10.0
- Livability +4.5/5.0
- Rent growth +3.8/5.0
- Condition / age +2.5/5.0
- Schools +0.7/10.0
- ARV discount +0.0/15.0
- Appreciation +0.0/10.0
$169,900
🖨 Deal sheet (PDF) 📄 Offer letter ✓ Due diligence
Multi-family units
County records classify this as Multi-Family (2-4 Unit). Listing-text estimate: 2 units. confirmed
Listing remarks
Stop scrolling! This Cleveland Heights duplex just found your next paycheck. Spacious, updated, and full of classic charm, this 2-family opportunity offers over 2,100 sq ft of living space with strong owner-occupant or investment potential. Each unit delivers generous room sizes, bright interiors, and the character buyers love with modern touches already in place. Inside, you’ll find fresh neutral finishes, attractive flooring, and a clean, move-in-ready feel that keeps vacancy time low and appeal high. The property includes a detached 2-car garage, basement space for storage/laundry, and inviting front porches that add instant curb appeal. Located in desirable Cleveland Heights near
Key facts
- Move-in-ready feel
- Bright interiors
- Quick highway access
Tags
Property features AI
Finance
- Financial info: Owner pays: common area maintenance, exterior maintenance, grounds care, HVAC maintenance, insurance, repairs, sewer, trash collection, water; Tenant pays: electricity, gas, internet; One lower unit currently leased for $1,250/month
Exterior
- Parking: Driveway; Detached garage; On-street parking; 2-car garage
- Utilities: Public water service; Public sewer
- Home design: 3-story multifamily building; Two-unit building (upper and lower units)
- Construction: Built (year per public records); Brick, block, concrete and wood siding construction; Asphalt roof
- Exterior features: Public water; Public sewer; North-facing
Interior
- Bedrooms: Upper unit: 2 bedrooms; Lower unit: 2 bedrooms
- Bathrooms: 2 full bathrooms (total property); Upper unit: 1 bathroom; Lower unit: 1 bathroom
- Heating & cooling: Forced air heating
- Interior features: Full basement
- Laundry & utility: Laundry in basement
Neighborhood map
What this means for you Summary
Snapshot
- This is a 2 × 2-bed/1.0-bath units multifamily listed at $170k.
Deal economics
- At list price, monthly cash flow is $397 ($5k/yr) — positive. Per door: $198/mo.
- The deal already cash-flows at list — no discount required.
- Meets the 1% rule at list price ($2k rent vs $170k).
- Recommended offer: $167k (1.5% below list) — sets the bar for market timing.
- Cap rate 9.1% vs local median 4.4% in Cleveland Heights — top-decile yield for the area; either an underpriced asset or a hidden risk that comps aren't pricing in. Stress-test before assuming the spread holds.
Location & tenants
- Location reads 89/100 on livability (#12 in OH, #124 nationally) — a professional / high-income tenant draw. Strengths: amenities A+, commute A+, cost of living A+.
- East Cleveland City School District (suburban): math 4% / reading 17% proficiency, ranked #652 of 656 in OH (top 99%) — low school quality limits family demand, transient renter base, plan for 1-2y turnover; 92% free/reduced lunch — lower-income household profile, screen leases tightly.
- Market conditions: Rents rising fast (+5.2%/yr); 101 active listings in the ZIP; 18 comparable units currently listed for rent nearby; rentals at typical pace (median 17d on market — plan ~3-4 weeks tenant-placement turnaround); lower-income renter base — watch delinquency; 1,441 units permitted in Cuyahoga County in 2024 (700 in 5+ unit buildings).
- At $2,275/mo this rent would consume 95% of the median local household income ($29k/yr) (locally 1702% of renters already pay >50% of income on rent) — very limited rent-growth headroom before tenants either downsize or default.
Forward outlook
- Local home prices are declining (-3.0%/yr); year-one equity from $1k of loan paydown is wiped out by about $5k of value loss. Plan a longer hold.
- Cuyahoga County population projected to shrink 8% by 2050 — rents likely to lag national; underwrite the cash flow, not the appreciation.
- At projected returns (-3.0% appreciation + 5.2% rent growth), your $48k cash investment doubles in ~9 years — after that, you're playing with house money.
Negotiation context
- It's been on market 20 days — a 2% lower offer ($167k) is reasonable based on typical stale-listing flexibility.
- 2 sale attempts with the ask held roughly flat each time — persistent listings suggest the price (not the market) is what's stuck; bring a comps-based counter.
- Current owner paid $28k; list at $170k implies a 518% gain — meaningful room to come down on a strong offer.
Risks & watch-outs
- Watch-outs: property tax is 3.1% of price; built in 1927 — expect roof / HVAC / electrical / plumbing capex.
- Climate carrying-cost: major flood risk — expect insurance premiums to compound above CPI over the hold.
Questions for the listing agent
- Can we see the unit-by-unit rent roll, current vacancy, and any below-market leases? What's the average tenancy length?
- What capital expenditures (roof, boiler, parking lot, exteriors) have been made in the last 5 years, and what's planned in the next 2?
- Built in 1927 — when were the roof, HVAC, electrical panel, plumbing, and water heater last replaced?
- Property tax is high relative to price — has the assessment been appealed recently, and will the sale trigger a re-assessment?
- Is there a deadline driving the sale (1031 exchange, divorce, estate, relocation)? That informs how much negotiation room exists.
- Schools are A-rated — typically a magnet for longer-tenancy family renters. What's the average tenant stay here, and is there a school-zone premium baked into asking?
- What's the average days-on-market for RENTAL listings here right now (not sales)? A rising rental-DOM trend means longer vacancies and softer asking-rent achievability than the comps imply.
- What's the recent tenant-quality profile in this submarket — average credit score on applications, eviction rate, late-payment / NSF rate, and stable-employment percentage? A property-management company in the area should have these aggregated.
- How much new apartment / multifamily construction is in the pipeline within 1–3 miles? Heavy new supply (>2% of stock underway) typically softens rents 12–24 months out; light construction supports rent growth.
Investment metrics
- 1% rule
- 1.34% ✓
- Cap rate
- 9.10%
- Cash-on-cash
- 10.01%
- DSCR
- 1.45
- GRM
- 6.2
CMA / ARV
- ARV (median comp)
- $128,974
- List price
- $169,900
- Delta
- 31.73%
- Verdict
- OVERPRICED
- Comps
- 20 within 1.0 mi
Show comp detail 12 sales within ~0.75 mi
| Address | Dist | Beds/Ba | Sqft | Sold | Price | $/sf | Match |
|---|---|---|---|---|---|---|---|
| 825 Helmsdale Rd | 0.01mi | 4/2.0 | 2,266 (+3%) | 4mo | $180,000 | $79 | 91 |
| 894 Helmsdale Rd | 0.14mi | 4/2.0 | 2,152 (-2%) | 8mo | $93,000 | $43 | 83 |
| 16118 Greyton Rd | 0.15mi | 4/2.0 | 2,090 (-5%) | 9mo | $62,500 | $30 | 77 |
| 931 Helmsdale Rd | 0.20mi | 4/2.0 | 2,074 (-6%) | 7mo | $150,000 | $72 | 76 |
| 860 Greyton Rd | 0.08mi | 4/2.0 | 2,126 (-3%) | 21mo | $150,000 | $71 | 73 |
| 971 Helmsdale Rd | 0.28mi | 4/2.0 | 2,108 (-4%) | 19mo | $15,000 | $7 | 64 |
| 935 Ravine Dr | 0.22mi | 4/2.5 | 2,519 (+15%) | 3mo | $161,500 | $64 | 61 |
| 872 Eloise Dr | 0.16mi | 4/2.0 | 1,872 (-15%) | 10mo | $125,000 | $67 | 59 |
| 2307 Noble Rd | 0.33mi | 4/2.0 | 2,072 (-6%) | 21mo | $130,000 | $63 | 58 |
| 864 Eloise Dr | 0.16mi | 4/2.0 | 1,872 (-15%) | 18mo | $84,256 | $45 | 53 |
| 2304 Noble Rd | 0.33mi | 5/2.0 (+1) | 2,402 (+9%) | 23mo | $138,000 | $57 | 45 |
| 975 Yellowstone Rd | 0.53mi | 4/2.0 | 1,885 (-14%) | 14mo | $149,900 | $80 | 40 |
Match score weights: distance 35% · size 25% · config 20% · recency 20%. Top-matched comps best support the ARV.
Projected returns pro-forma
-3.0% appreciation · 5.16% rent growth · sell at horizon
- IRR
- 1.6%
- Equity multiple
- 1.06×
- Total profit
- $2,966
- Equity at exit
- $25,333
- IRR
- 13.5%
- Equity multiple
- 2.21×
- Total profit
- $57,493
- Equity at exit
- $14,690
Cash invested: $47,572 (down + closing). Projections, not guarantees.
Landlord ↔ Tenant lean methodology
- Overall (STATE)
- 73 Landlord-Friendly
- State Ohio
- 73 Landlord-Friendly · R+6
- County
- — inherits STATE
- City
- — inherits STATE
ZIP-level market 44112
- Rents YoY
- 5.2%
- Active inventory
- 101
- Price-to-rent
- 12.4×
Monthly cashflow live
- Estimated rent
- $2,275 high interval (Pro) →
- Mortgage (P&I)
- −$891
- Tax from tax record
- −$439 /mo · $5,264/yr
- Insurance
- −$71
- HOA
- −$0
- Vacancy / Maint / Mgmt
- −$478
- Net cashflow
- $397
Break-even live
Sensitivity live
| Price | -10% $493 | -5% $445 | +0% $397 | +5% $349 | +10% $301 |
|---|---|---|---|---|---|
| Rent | -10% $217 | -5% $307 | +0% $397 | +5% $487 | +10% $577 |
| Rate | -1.0pp $482 | -0.5pp $440 | base $397 | +0.5pp $353 | +1.0pp $308 |
2-unit breakdown (identical units grouped — click to expand)
| Units | Beds | Baths | Est. rent |
|---|---|---|---|
| 2× units | 2 | 1 | $2,274 |
| #1 | 2 | 1 | $1,137 |
| #2 | 2 | 1 | $1,137 |
| Total (2 units) | $2,275 | ||
UW: 25.0% down · 7.5% · 30yr · 1.5% tax · 5.0% vac · 8.0% maint · 8.0% mgmt
Financing live
Cash to close
- Down payment
- $42,475
- Closing costs
- $5,097
- Reserves months
- —
- Total cash needed
- —
Loan-product check · same deal, 3 products live
Conventional
25% down · 7.5% · 30yr
- Down + closing
- —
- Monthly P&I
- —
- Monthly cashflow
- —
- DSCR
- —
- Eligible?
- —
Personal DTI + credit; lowest rate.
DSCR
20% down · 8.5% · 30yr
- Down + closing
- —
- Monthly P&I
- —
- Monthly cashflow
- —
- DSCR
- —
- Eligible?
- —
No personal income docs; deal must DSCR.
Hard money
10% down · 12.0% · 12mo
- Down + closing
- —
- Monthly P&I
- —
- Monthly cashflow
- —
- DSCR
- —
- Eligible?
- —
Short-term bridge; refi at stabilization.
Rent comps 18 comps
| Address | Beds | Baths | Sqft | Rent | $/sqft | DOM | Units | Dist |
|---|---|---|---|---|---|---|---|---|
| 821 Nela View Rd Cleveland, OH | 4.0 | 2.5 | 2178 | $2,100 | $0.96 | 8d | 1 | 0.09mi |
| 983 Greyton Rd Cleveland, OH | 3.0 | 2.0 | 1457 | $1,495 | $1.03 | 17d | 1 | 0.26mi |
| 3430 Winsford Rd Cleveland, OH | 4.0 | 1.5 | 1800 | $1,590 | $0.88 | 17d | 1 | 0.29mi |
| 1024 Greyton Rd Cleveland, OH | 5.0 | 2.5 | 1800 | $2,500 | $1.39 | 44d | 1 | 0.33mi |
| 910 Dresden Rd Cleveland, OH | 4.0 | 2.0 | 1839 | $1,800 | $0.98 | 17d | 1 | 0.33mi |
| 16000 Terrace Rd Cleveland, OH | 1.0–3.0 | 1.0–2.0 | 1000 | $1,210 | $1.21 | 2d | 39 | 0.46mi |
| 1099 Woodview Rd Cleveland, OH | 4.0 | 1.0 | 1500 | $2,500 | $1.67 | 2d | 1 | 0.51mi |
| 994 Yellowstone Rd Cleveland, OH | 3.0 | 2.0 | 1475 | $1,395 | $0.95 | 3d | 1 | 0.53mi |
| 15801 Hazel Rd Cleveland, OH | 3.0 | 1.5 | 1908 | $1,550 | $0.81 | 17d | 1 | 0.65mi |
| 3802 Princeton Blvd Cleveland, OH | 3.0 | 1.5 | 1656 | $2,275 | $1.37 | 2d | 1 | 0.92mi |
| 1131 Cleveland Heights Blvd Cleveland, OH | 5.0 | 2.0 | 1500 | $2,550 | $1.70 | 2d | 1 | 0.93mi |
| 3777 Montevista Rd Cleveland, OH | 5.0 | 2.0 | 2050 | $2,900 | $1.41 | 2d | 1 | 1.10mi |
| 3808 Kirkwood Rd Cleveland, OH | 4.0 | 1.5 | 1740 | $2,150 | $1.24 | 15d | 1 | 1.11mi |
| 3917 Bluestone Rd Cleveland, OH | 4.0 | 1.5 | 1700 | $1,650 | $0.97 | 22d | 1 | 1.15mi |
| 1082 Hillstone Rd Cleveland, OH | 3.0 | 2.0 | 2376 | $1,695 | $0.71 | 24d | 1 | 1.17mi |
| 1082 Hillstone Rd Unit 1 Cleveland Heights, OH | 3.0 | 1.5 | 2376 | $1,695 | $0.71 | 24d | 1 | 1.17mi |
| 1462 Parkhill Rd Cleveland, OH | 4.0 | 1.0 | 1451 | $1,950 | $1.34 | 2d | 1 | 1.43mi |
| 3201 Whitethorn Rd Unit 3203 Cleveland Heights, OH | 5.0 | 1.5 | 1485 | $1,725 | $1.16 | 24d | 1 | 1.47mi |
Listing history 4 events
-
2026-05-02$169,900 Active 973-char remark
-
2026-04-30historical
-
2026-02-17$179,500 Active
-
1975-09-01soldstatus $27,500
ⓘ Source: listings_history table (triggers on properties + properties_extension) + one-shot
backfill from property_details.listing_events for pre-trigger history.
Tax reassessment forecast OH · Partial reset (capped growth)
- Current annual tax
- $5,264 · $439/mo
- Projected year-2 tax
- $5,264 · $439/mo
- Expected delta
- $0/yr ($0/mo · 0.0%)
ⓘ Screening estimate from a state-policy table — verify with the county assessor before closing.
Climate risk First Street
- Flood 6/10 Major FEMA zone X (unshaded) · 74% chance over 30 yrs
- Wildfire 1/10 Low
- Heat 3/10 Moderate 7 d/yr ≥95°F today · 16 d/yr by 30 yrs out
- Wind 1/10 Low
- Air quality 3/10 Moderate 3 unhealthy d/yr today · 5 by 30 yrs out
Nearby sold comps map
Loading sold comps map…
Walkable amenities ~0.75 mi
Loading nearby amenities…
Taxation est. · year 1
- Rental income
- $27,300
- − Mortgage interest
- −$9,517
- − Property taxes
- −$5,264
- − Insurance
- −$850
- − Repairs & maintenance
- −$2,184
- − Management
- −$2,184
- − Depreciation
- −$4,943
- Taxable income
- $2,359
- Est. tax owed @ 24.0%
- −$566
- After-tax cash flow
- $4,196/yr
For passive investors: Depreciation is non-cash, so a rental often shows a tax loss while cash-flowing — sheltering income. Rental losses are passive: they offset passive income freely, and up to $25,000/yr can offset ordinary (W-2) income if you actively participate and your MAGI is under $100k (phasing out to $0 by $150k); unused losses carry forward. On sale, claimed depreciation is recaptured at up to 25%, and gains may owe capital-gains tax (a 1031 exchange can defer both). Figures are a year-1 estimate at your 24.0% rate — not tax advice; consult a CPA.
Schools (NCES district)
- District
- East Cleveland City School District
- NCES district ID
- 3904390
- Math proficiency
- 4% ▼ -16.00%
- Reading proficiency
- 17% ▼ -13.00%
- Median HH income
- $22,726
- Composite
- 7.38/100
- National rank
- #9954
- State rank
- #652 of 656 in OH
Livability — Cleveland Heights
- Score
- 89/100
- State rank
- #12
- US rank
- #124
Category grades
Schools grade is shown separately in the Schools card above.
Census & demographics
- Census place
- Cleveland Heights, OH
- County
- Cuyahoga County · 1,090,369 people
- City population
- 32,312
- Metro
- Cleveland-Elyria, OH
- Population (ZIP)
- 17,848
- Household income
- $28,799
- Rent vs Own
- Severe rent burden
- 1702.0
Population outlook (Cuyahoga County) Hauer SSP2
- Today (2025)
- 1,244,621 people
- By 2030
- 1,230,093 · -1.2%
- By 2040
- 1,189,108 · -4.5%
- By 2050
- 1,145,706 · -7.9%
- By 2075
- 1,076,557 · -13.5%
- By 2100
- 978,987 · -21.3%
Race, ethnicity, and origin ACS 2023
- Neighborhood character
- Predominantly Black (89%)
- Race & ethnicity
- Black 89% White 7% Two or more races 2% Hispanic / Latino 1%
- Common ancestry
- Lithuanian 1%
- Foreign-born
- 4% · Canada
- Languages at home
- 93% English-only · French/Haitian/Cajun 3% Spanish 2% Russian/Polish/Slavic 1%
Political lean MEDSL · Cuyahoga
- 2024 margin
- Solid D (+31.5) · D 65.4% · R 33.9%
- 2008→2024 swing
- -7.4pp toward R · 2008: 38.9pp · 2024: 31.5pp
- All cycles
- 2024: D+31.5 2020: D+34.1 2016: D+35.0 2012: D+38.7 2008: D+38.9
Not yet ingested
- Civics
- —
Market trends
- HPI YoY
- ▼ -115.61%
- Current HPI
- 67.2162
- Rent YoY
- ▲ 5.16%
- Metro
- Cleveland-Elyria, OH
- State GDP YoY
- ▲ 1.98%
- F500 in state
- 48
Industry mix (Fortune 500 HQ in OH)
| Industry | F500 HQs | Revenue |
|---|---|---|
| Insurance | 3 | $145B |
|
||
| Industrial Machinery | 3 | $49B |
|
||
| Financial Services | 3 | $24B |
|
||
| Consumer Goods | 2 | $93B |
|
||
| Aerospace / Defense | 2 | $47B |
|
||
| Utilities | 2 | $33B |
|
||
Price history
+517.8% since first listed5 events — show timeline
- 2026-05-22 Pending — MLSNOW
- 2026-05-02 Listed $169,900 MLSNOW
- 2026-04-30 Listing Removed — MLSNOW
- 2026-02-17 Listed $179,500 MLSNOW
- 1975-09-01 Sold (Public Records) $27,500 Public Records
Property tax history
+11.3%/yrLatest (2025): $5,264 · +50.0% YoY. Source: county tax records.
Cash-flow waterfall
monthlySold comps — $/sqft
last 12 mo · ≤1 miLoading sold comps…