26567 H Ave · Hubbard, IA
Flood risk 1/10 · Minimal
- FEMA flood zone
- X (unshaded)
- Chance of flooding over 30 yrs
- 0.0%
- Est. flood insurance / yr
- $473 – $860
Fire risk 1/10 · Minimal
- Est. fire insurance / yr
- $902 – $1,676
Heat risk 2/10 · Minimal
- Hot days now (above 102°F)
- 7 days/yr
- Hot days in 30 yrs
- 15 days/yr
Wind risk 2/10 · Minimal
- Chance of severe wind over 30 yrs
- —
Air-quality risk 1/10 · Minimal
- Unhealthy air days now
- 0 days/yr
- Unhealthy air days in 30 yrs
- 0 days/yr
Risk factors via First Street. Map © Google.
Why this score? — see what drove the B+ grade
The composite is a weighted blend of 9 inputs, each scored 0–100. Each bar is that input's sub-score; the figure is the points it added to the 100-point composite (weight × sub-score).
- Cash flow +30.0/30.0
- 1% rule +10.0/10.0
- DSCR +10.0/10.0
- ARV discount +7.5/15.0
- Appreciation +6.8/10.0
- Schools +5.7/10.0
- Livability +3.3/5.0
- Rent growth +2.5/5.0
- Condition / age +2.5/5.0
$54,900
🖨 Deal sheet (PDF) 📄 Offer letter ✓ Due diligence
Key facts
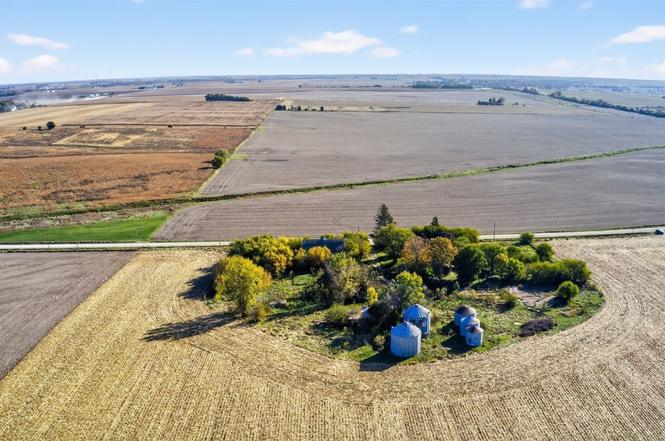
- Hobby farm
- Outbuildings
- Peace in the country
Tags
Neighborhood map
What this means for you Summary
Snapshot
- This is a 3-bed/2.0-bath single-family listed at $55k.
Deal economics
- At list price, monthly cash flow is $653 ($8k/yr) — positive.
- The deal already cash-flows at list — no discount required.
- Meets the 1% rule at list price ($1k rent vs $55k).
- Recommended offer: $54k (1.5% below list) — sets the bar for market timing.
Location & tenants
- Location reads 66/100 on livability (#508 in IA) — a middle-class / working-renter tenant base. Strengths: cost of living A+, housing A+, employment B; Watch: amenities F, commute F, health & safety D-.
- Hubbard-Radcliffe Community School District (rural): math 68% / reading 65% proficiency, ranked #175 of 289 in IA (top 61%) — acceptable for families but not a draw, mixed tenant base, ~2y average lease.
- Zoned schools: Hubbard-Radcliffe Elementary School (math 72% / reading 62%, grade B+, #273 of 616 statewide, top 51%, 184 students, 32% FRL); South Hardin Middle School (math 67% / reading 66%, grade A-, #148 of 246 statewide, top 61%, 193 students, 50% FRL).
- Market conditions: 15 active listings in the ZIP; 6 units permitted in Hardin County in 2024 (0 in 5+ unit buildings).
Forward outlook
- In year one you build about $2k of equity ($380 loan paydown + $2k appreciation (3.7% local appreciation)).
- Hardin County population projected to shrink 6% by 2050 — rents likely to lag national; underwrite the cash flow, not the appreciation.
- At projected returns (3.7% appreciation + 3.0% rent growth), your $15k cash investment doubles in ~2 years — after that, you're playing with house money.
Negotiation context
- It's been on market 19 days — a 2% lower offer ($54k) is reasonable based on typical stale-listing flexibility.
- Current owner paid $30k; list at $55k implies a 84% gain — meaningful room to come down on a strong offer.
Risks & watch-outs
- Watch-outs: built in 1910 — expect roof / HVAC / electrical / plumbing capex.
Questions for the listing agent
- Built in 1910 — when were the roof, HVAC, electrical panel, plumbing, and water heater last replaced?
- Is there a deadline driving the sale (1031 exchange, divorce, estate, relocation)? That informs how much negotiation room exists.
- Schools are B-rated — typically a magnet for longer-tenancy family renters. What's the average tenant stay here, and is there a school-zone premium baked into asking?
- What's the average days-on-market for RENTAL listings here right now (not sales)? A rising rental-DOM trend means longer vacancies and softer asking-rent achievability than the comps imply.
- What's the recent tenant-quality profile in this submarket — average credit score on applications, eviction rate, late-payment / NSF rate, and stable-employment percentage? A property-management company in the area should have these aggregated.
- How much new for-sale + rental construction is in the pipeline within 1–3 miles? Heavy new supply typically softens prices + rents 12–24 months out; constrained supply supports both.
Investment metrics
- 1% rule
- 2.30% ✓
- Cap rate
- 20.56%
- Cash-on-cash
- 50.95%
- DSCR
- 3.27
- GRM
- 3.6
CMA / ARV
No comps found within radius.
Projected returns pro-forma
3.7% appreciation · 3.0% rent growth · sell at horizon
- IRR
- 56.9%
- Equity multiple
- 4.27×
- Total profit
- $50,239
- Equity at exit
- $26,874
- IRR
- 55.8%
- Equity multiple
- 8.68×
- Total profit
- $118,123
- Equity at exit
- $43,205
Cash invested: $15,372 (down + closing). Projections, not guarantees.
Landlord ↔ Tenant lean methodology
- Overall (STATE)
- 83 Strongly Landlord-Friendly
- State Iowa
- 83 Strongly Landlord-Friendly · R+6
- County
- — inherits STATE
- City
- — inherits STATE
ZIP-level market 50122
- Home prices YoY
- 2.3%
- Active inventory
- 15
- Price-to-rent
- 3.6×
Monthly cashflow live
- Estimated rent
- $1,264 medium interval (Pro) →
- Mortgage (P&I)
- −$288
- Tax from tax record
- −$36 /mo · $426/yr
- Insurance
- −$23
- HOA
- −$0
- Vacancy / Maint / Mgmt
- −$266
- Net cashflow
- $653
Break-even live
Sensitivity live
| Price | -10% $684 | -5% $668 | +0% $653 | +5% $637 | +10% $622 |
|---|---|---|---|---|---|
| Rent | -10% $553 | -5% $603 | +0% $653 | +5% $703 | +10% $753 |
| Rate | -1.0pp $680 | -0.5pp $667 | base $653 | +0.5pp $638 | +1.0pp $624 |
UW: 25.0% down · 7.5% · 30yr · 1.5% tax · 5.0% vac · 8.0% maint · 8.0% mgmt
Financing live
Cash to close
- Down payment
- $13,725
- Closing costs
- $1,647
- Reserves months
- —
- Total cash needed
- —
Loan-product check · same deal, 3 products live
Conventional
25% down · 7.5% · 30yr
- Down + closing
- —
- Monthly P&I
- —
- Monthly cashflow
- —
- DSCR
- —
- Eligible?
- —
Personal DTI + credit; lowest rate.
DSCR
20% down · 8.5% · 30yr
- Down + closing
- —
- Monthly P&I
- —
- Monthly cashflow
- —
- DSCR
- —
- Eligible?
- —
No personal income docs; deal must DSCR.
Hard money
10% down · 12.0% · 12mo
- Down + closing
- —
- Monthly P&I
- —
- Monthly cashflow
- —
- DSCR
- —
- Eligible?
- —
Short-term bridge; refi at stabilization.
Listing history 3 events
-
2025-11-17status Pending
-
2025-10-29$54,900 Active
-
2019-09-16soldstatus $29,875
ⓘ Source: listings_history table (triggers on properties + properties_extension) + one-shot
backfill from property_details.listing_events for pre-trigger history.
Tax reassessment forecast IA · Partial reset (capped growth)
- Current annual tax
- $426 · $36/mo
- Projected year-2 tax
- $644 · $54/mo
- Expected delta
- +$218/yr (+$18/mo · 51.2%)
ⓘ Screening estimate from a state-policy table — verify with the county assessor before closing.
Climate risk First Street
- Flood 1/10 Low FEMA zone X (unshaded) · 0% chance over 30 yrs
- Wildfire 1/10 Low
- Heat 2/10 Low 7 d/yr ≥102°F today · 15 d/yr by 30 yrs out
- Wind 2/10 Low
- Air quality 1/10 Low 0 unhealthy d/yr today · 0 by 30 yrs out
Nearby sold comps map
Loading sold comps map…
Walkable amenities ~0.75 mi
Loading nearby amenities…
Taxation est. · year 1
- Rental income
- $15,174
- − Mortgage interest
- −$3,075
- − Property taxes
- −$426
- − Insurance
- −$274
- − Repairs & maintenance
- −$1,214
- − Management
- −$1,214
- − Depreciation
- −$1,597
- Taxable income
- $7,373
- Est. tax owed @ 24.0%
- −$1,770
- After-tax cash flow
- $6,063/yr
For passive investors: Depreciation is non-cash, so a rental often shows a tax loss while cash-flowing — sheltering income. Rental losses are passive: they offset passive income freely, and up to $25,000/yr can offset ordinary (W-2) income if you actively participate and your MAGI is under $100k (phasing out to $0 by $150k); unused losses carry forward. On sale, claimed depreciation is recaptured at up to 25%, and gains may owe capital-gains tax (a 1031 exchange can defer both). Figures are a year-1 estimate at your 24.0% rate — not tax advice; consult a CPA.
Schools (NCES district)
- District
- Hubbard-Radcliffe Community School District
- NCES district ID
- 1914310
- Math proficiency
- 68% ▼ -4.00%
- Reading proficiency
- 65% ▼ -2.00%
- Median HH income
- $56,284
- Composite
- 57.09/100
- National rank
- #1103
- State rank
- #175 of 289 in IA
Livability — Hubbard
- Score
- 66/100
- State rank
- #508
- US rank
- #11245
Category grades
Schools grade is shown separately in the Schools card above.
Census & demographics
- City population
- 1,348
- Population (ZIP)
- 1,348
Population outlook (Hardin County) Hauer SSP2
- Today (2025)
- 17,474 people
- By 2030
- 17,369 · -0.6%
- By 2040
- 17,018 · -2.6%
- By 2050
- 16,454 · -5.8%
- By 2075
- 14,665 · -16.1%
- By 2100
- 12,404 · -29.0%
Race, ethnicity, and origin ACS 2023
- Neighborhood character
- Predominantly White (96%)
- Race & ethnicity
- White 96% Hispanic / Latino 3%
- Common ancestry
- Portuguese 14% Italian 1% Iranian 1%
- Foreign-born
- 2% · South Korea, Canada
Political lean MEDSL · Hardin
- 2024 margin
- Solid R (+38.4) · D 30.3% · R 68.7% · Other 1.1%
- 2008→2024 swing
- -39.3pp toward R · 2008: 0.9pp · 2024: -38.4pp
- All cycles
- 2024: R+38.4 2020: R+32.0 2016: R+29.2 2012: R+7.1 2008: D+0.9
Not yet ingested
- Civics
- —
Market trends
- HPI YoY
- ▲ 3.70%
- Current HPI
- 164.9646
- Rent YoY
- —
- Metro
- —
- State GDP YoY
- ▲ 2.48%
- F500 in state
- 4
Industry mix (Fortune 500 HQ in IA)
| Industry | F500 HQs | Revenue |
|---|---|---|
| Financial Services | 1 | $16B |
|
||
| Retail / Convenience | 1 | $15B |
|
||
Price history
+83.8% since first listed3 events — show timeline
- 2025-11-17 Pending — CRAAR, CDRMLS
- 2025-10-29 Listed $54,900 CRAAR, CDRMLS
- 2019-09-16 Sold (Public Records) $29,875 Public Records
Property tax history
+0.6%/yrLatest (2025): $426 · -47.3% YoY. Source: county tax records.
Cash-flow waterfall
monthlySold comps — $/sqft
last 12 mo · ≤1 miLoading sold comps…