 Triplex
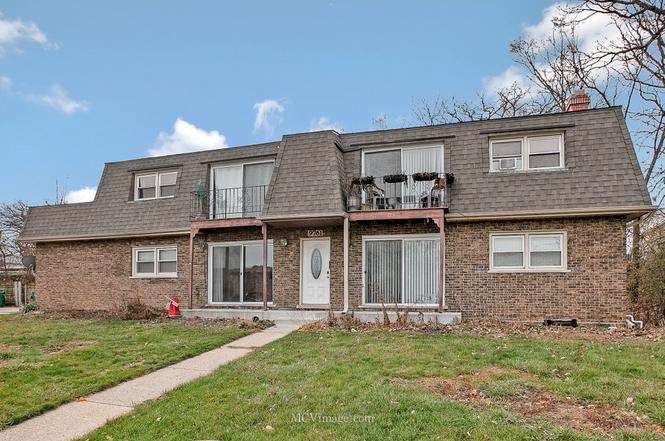
9761 Ravinia Ln · Orland Park, IL
Flood risk No data
- FEMA flood zone
- —
- Chance of flooding over 30 yrs
- —
- Est. flood insurance / yr
- —
Fire risk No data
- Est. fire insurance / yr
- —
Heat risk No data
- Hot days now (above threshold)
- —
- Hot days in 30 yrs
- —
Wind risk No data
- Chance of severe wind over 30 yrs
- —
Air-quality risk No data
- Unhealthy air days now
- —
- Unhealthy air days in 30 yrs
- —
Risk factors via First Street. Map © Google.
Why this score? — see what drove the C+ grade
The composite is a weighted blend of 9 inputs, each scored 0–100. Each bar is that input's sub-score; the figure is the points it added to the 100-point composite (weight × sub-score).
- Cash flow +26.6/30.0
- DSCR +9.1/10.0
- ARV discount +7.5/15.0
- 1% rule +7.1/10.0
- Livability +4.2/5.0
- Schools +3.4/10.0
- Rent growth +2.5/5.0
- Condition / age +2.5/5.0
- Appreciation +0.0/10.0
$849,900
🖨 Deal sheet (PDF) 📄 Offer letter ✓ Due diligence
Multi-family units
County records classify this as Multi-Family (2-4 Unit). Listing-text estimate: 3 units. confirmed
Listing remarks
Superb investment opportunity in the heart of Orland Park. Cap Rate of 6.7 and GRM of 10.3 Located on a quiet cul-de-sac, this fully leased four-unit building is an exceptional find for a savvy investor looking for immediate cash flow or an owner-occupant wanting to live rent-free while tenants pay the mortgage. The building features a massive owner's unit with 3 spacious bedrooms, 3 full bathrooms, and a fully finished basement-ideal for a primary residence or a premium rental. The other three units, feature 2-bedroom, 1-bathroom layouts. Tenants will love the convenience of the large private parking lot with ample space for residents and guests. The property has been meticulously maintain
Key facts
- 0.31 acre lot
- 8 parking spots
- Built 1971
Property features AI
Finance
- Other: Possession: at closing subject to tenant's rights; Earnest money is held
- Financial info: Gross annual income reported: $82,200; Annual taxes reported; Water/sewer, electric, and insurance expenses reported
Exterior
- Parking: Eight total parking spaces; Assigned parking; Off-street parking; Owned parking
- Utilities: Water/sewer expenses reported; Electric expenses reported
- Home design: Two-to-four unit property; Fee simple ownership; Not a conversion; Not rebuilt; Facing/entry level not specified
- Construction: Brick construction; Asphalt roof; Concrete perimeter foundation; Built 51–60 years ago (built before 1978)
- Exterior features: Cul-de-sac lot; Lot dimensions approximately 60 x 122 x 72 x 92 x 115; Lot between 0.25 and 0.49 acre; Zoned for multi-family
Interior
- Bedrooms: Nine bedrooms total (9)
- Bathrooms: Five full bathrooms
- Interior features: Finished full basement; Building contains 4 units; 3-bedroom unit(s) present
Neighborhood map
What this means for you Summary
Snapshot
- This is a 3 × 3-bed/?-bath units multifamily listed at $850k.
Deal economics
- At list price, monthly cash flow is $2k ($27k/yr) — positive. Per door: $759/mo.
- The deal already cash-flows at list — no discount required.
- Meets the 1% rule at list price ($10k rent vs $850k).
- Cap rate 9.5% vs local median 4.5% in Orland Park — top-decile yield for the area; either an underpriced asset or a hidden risk that comps aren't pricing in. Stress-test before assuming the spread holds.
Location & tenants
- Location reads 85/100 on livability (#29 in IL, #529 nationally) — a professional / high-income tenant draw. Strengths: crime A+, amenities A+, commute A+.
- Cons Hsd 230 (suburban): math 35% / reading 39% proficiency, ranked #146 of 620 in IL (top 24%) — families likely to look elsewhere, expect single-tenant / working-renter base with shorter leases.
- Market conditions: Rents soft (-0.2%/yr); 106 active listings in the ZIP; solid renter incomes; 6,272 units permitted in Cook County in 2024 (4,658 in 5+ unit buildings).
- At $10,316/mo this rent would consume 128% of the median local household income ($97k/yr) (locally 668% of renters already pay >50% of income on rent) — very limited rent-growth headroom before tenants either downsize or default.
Forward outlook
- Local home prices are declining (-3.0%/yr); year-one equity from $6k of loan paydown is wiped out by about $25k of value loss. Plan a longer hold.
Negotiation context
- Only 4 days on market — expect competitive offers; lowballing is unlikely to land.
Questions for the listing agent
- Can we see the unit-by-unit rent roll, current vacancy, and any below-market leases? What's the average tenancy length?
- What capital expenditures (roof, boiler, parking lot, exteriors) have been made in the last 5 years, and what's planned in the next 2?
- Built in 1971 — when were the roof, HVAC, electrical panel, plumbing, and water heater last replaced?
- Is there a deadline driving the sale (1031 exchange, divorce, estate, relocation)? That informs how much negotiation room exists.
- What's the average days-on-market for RENTAL listings here right now (not sales)? A rising rental-DOM trend means longer vacancies and softer asking-rent achievability than the comps imply.
- What's the recent tenant-quality profile in this submarket — average credit score on applications, eviction rate, late-payment / NSF rate, and stable-employment percentage? A property-management company in the area should have these aggregated.
- How much new apartment / multifamily construction is in the pipeline within 1–3 miles? Heavy new supply (>2% of stock underway) typically softens rents 12–24 months out; light construction supports rent growth.
Investment metrics
- 1% rule
- 1.21% ✓
- Cap rate
- 9.51%
- Cash-on-cash
- 11.48%
- DSCR
- 1.51
- GRM
- 6.9
CMA / ARV
No comps found within radius.
Show comp detail 1 sale within ~0.75 mi
| Address | Dist | Beds/Ba | Sqft | Sold | Price | $/sf | Match |
|---|---|---|---|---|---|---|---|
| 14425 Jefferson Ave | 0.19mi | 8/4.0 (-1) | — | 17mo | $1,670,000 | — | 52 |
Match score weights: distance 35% · size 25% · config 20% · recency 20%. Top-matched comps best support the ARV.
Projected returns pro-forma
-3.0% appreciation · 0.0% rent growth · sell at horizon
- IRR
- -2.6%
- Equity multiple
- 0.90×
- Total profit
- $-22,826
- Equity at exit
- $126,723
- IRR
- 3.4%
- Equity multiple
- 1.21×
- Total profit
- $50,593
- Equity at exit
- $73,484
Cash invested: $237,972 (down + closing). Projections, not guarantees.
Landlord ↔ Tenant lean methodology
- Overall (STATE)
- 43 Moderately Tenant-Leaning
- State Illinois
- 43 Moderately Tenant-Leaning · D+7
- County
- — inherits STATE
- City
- — inherits STATE
ZIP-level market 60462
- Rents YoY
- -0.2%
- Active inventory
- 106
- Price-to-rent
- 20.6×
Monthly cashflow live
- Estimated rent
- $10,316 high interval (Pro) →
- Mortgage (P&I)
- −$4,457
- Tax est. 1.5%
- −$1,062 /mo · $12,748/yr
- Insurance
- −$354
- HOA
- −$0
- Vacancy / Maint / Mgmt
- −$2,166
- Net cashflow
- $2,276
Break-even live
Sensitivity live
| Price | -10% $2,864 | -5% $2,570 | +0% $2,276 | +5% $1,982 | +10% $1,689 |
|---|---|---|---|---|---|
| Rent | -10% $1,461 | -5% $1,869 | +0% $2,276 | +5% $2,684 | +10% $3,091 |
| Rate | -1.0pp $2,704 | -0.5pp $2,492 | base $2,276 | +0.5pp $2,056 | +1.0pp $1,832 |
3-unit breakdown (identical units grouped — click to expand)
| Units | Beds | Baths | Est. rent |
|---|---|---|---|
| 3× units | 3 | — | $10,317 |
| #1 | 3 | — | $3,439 |
| #2 | 3 | — | $3,439 |
| #3 | 3 | — | $3,439 |
| Total (3 units) | $10,316 | ||
UW: 25.0% down · 7.5% · 30yr · 1.5% tax · 5.0% vac · 8.0% maint · 8.0% mgmt
Financing live
Cash to close
- Down payment
- $212,475
- Closing costs
- $25,497
- Reserves months
- —
- Total cash needed
- —
Loan-product check · same deal, 3 products live
Conventional
25% down · 7.5% · 30yr
- Down + closing
- —
- Monthly P&I
- —
- Monthly cashflow
- —
- DSCR
- —
- Eligible?
- —
Personal DTI + credit; lowest rate.
DSCR
20% down · 8.5% · 30yr
- Down + closing
- —
- Monthly P&I
- —
- Monthly cashflow
- —
- DSCR
- —
- Eligible?
- —
No personal income docs; deal must DSCR.
Hard money
10% down · 12.0% · 12mo
- Down + closing
- —
- Monthly P&I
- —
- Monthly cashflow
- —
- DSCR
- —
- Eligible?
- —
Short-term bridge; refi at stabilization.
Listing history 9 events
-
2026-06-21days on market $849,900 Active 4 DOM
-
2026-06-17pricestatusdays on market $849,900 Active 1 DOM
-
2026-06-17pricestatusdays on market
-
2026-06-17days on market $849,900 Coming Soon 6 DOM
-
2026-06-16days on market $849,900 Coming Soon 5 DOM
-
2026-06-16remarks 699-char remark
-
2026-06-15days on market $849,900 Coming Soon 4 DOM
-
2026-06-13remarks 61-char remark
-
2026-06-13$849,900 Coming Soon 2 DOM
ⓘ Source: listings_history table (triggers on properties + properties_extension) + one-shot
backfill from property_details.listing_events for pre-trigger history.
Nearby sold comps map
Loading sold comps map…
Walkable amenities ~0.75 mi
Loading nearby amenities…
Taxation est. · year 1
- Rental income
- $123,792
- − Mortgage interest
- −$47,608
- − Property taxes
- −$12,748
- − Insurance
- −$4,250
- − Repairs & maintenance
- −$9,903
- − Management
- −$9,903
- − Depreciation
- −$24,724
- Taxable income
- $14,655
- Est. tax owed @ 24.0%
- −$3,517
- After-tax cash flow
- $23,797/yr
For passive investors: Depreciation is non-cash, so a rental often shows a tax loss while cash-flowing — sheltering income. Rental losses are passive: they offset passive income freely, and up to $25,000/yr can offset ordinary (W-2) income if you actively participate and your MAGI is under $100k (phasing out to $0 by $150k); unused losses carry forward. On sale, claimed depreciation is recaptured at up to 25%, and gains may owe capital-gains tax (a 1031 exchange can defer both). Figures are a year-1 estimate at your 24.0% rate — not tax advice; consult a CPA.
Schools (NCES district)
- District
- Cons Hsd 230
- NCES district ID
- 1708400
- Math proficiency
- 35% ▼ -8.00%
- Reading proficiency
- 39% ▼ -6.00%
- Median HH income
- $73,953
- Composite
- 34.29/100
- National rank
- #5244
- State rank
- #146 of 620 in IL
Livability — Orland Park
- Score
- 85/100
- State rank
- #29
- US rank
- #529
Category grades
Schools grade is shown separately in the Schools card above.
Census & demographics
- Census place
- Orland Park, IL
- County
- Cook County · 4,486,803 people
- City population
- 41,456
- Metro
- Chicago-Naperville-Elgin, IL-IN-WI
- Population (ZIP)
- 41,456
- Household income
- $96,526
- Rent vs Own
- Severe rent burden
- 668.0
Population outlook (Cook County) Hauer SSP2
- Today (2025)
- 5,347,519 people
- By 2030
- 5,357,703 · +0.2%
- By 2040
- 5,324,924 · -0.4%
- By 2050
- 5,230,762 · -2.2%
- By 2075
- 4,785,735 · -10.5%
- By 2100
- 4,188,836 · -21.7%
Race, ethnicity, and origin ACS 2023
- Neighborhood character
- Predominantly White (78%)
- Race & ethnicity
- White 78% Hispanic / Latino 12% Two or more races 8% Asian 6% Black 3%
- Hispanic origin (detail)
- Mexican 7% Cuban 2%
- Common ancestry
- Romanian 17% Armenian 2% Iranian 2%
- Foreign-born
- 16% · Canada, South Korea
- Languages at home
- 73% English-only · Spanish 7% Arabic 7% Russian/Polish/Slavic 6%
Political lean MEDSL · Cook
- 2024 margin
- Solid D (+42.0) · D 70.4% · R 28.4% · Other 1.2%
- 2008→2024 swing
- -11.4pp toward R · 2008: 53.4pp · 2024: 42.0pp
- All cycles
- 2024: D+42.0 2020: D+50.3 2016: D+53.0 2012: D+49.4 2008: D+53.4
Not yet ingested
- Civics
- —
Market trends
- HPI YoY
- ▼ -198.71%
- Current HPI
- 203.5329
- Rent YoY
- ▼ -0.17%
- Metro
- Chicago-Naperville-Elgin, IL-IN-WI
- State GDP YoY
- ▲ 1.59%
- F500 in state
- 60
Industry mix (Fortune 500 HQ in IL)
| Industry | F500 HQs | Revenue |
|---|---|---|
| Insurance | 4 | $201B |
|
||
| Consumer Goods | 4 | $87B |
|
||
| Industrial Machinery | 3 | $64B |
|
||
| Healthcare | 2 | $55B |
|
||
| Retail / Pharmacy | 1 | $148B |
|
||
| Agriculture / Food | 1 | $86B |
|
||
Cash-flow waterfall
monthlySold comps — $/sqft
last 12 mo · ≤1 miLoading sold comps…