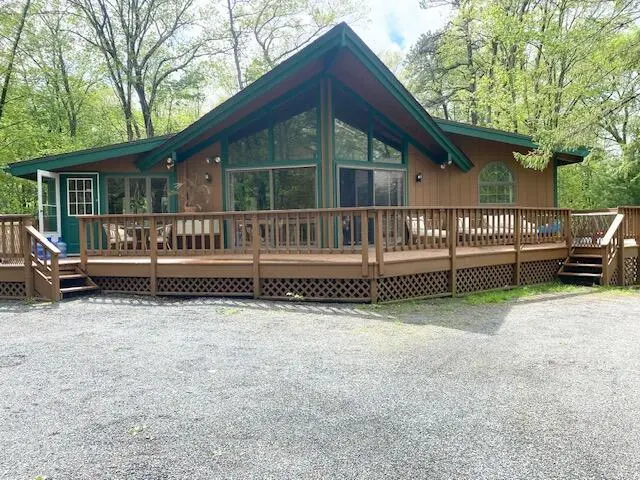
106 Palomino Ln · Hemlock Farms, PA
Flood risk 1/10 · Minimal
- FEMA flood zone
- X (unshaded)
- Chance of flooding over 30 yrs
- 0.0%
- Est. flood insurance / yr
- $473 – $860
Fire risk 4/10 · Minor
- Est. fire insurance / yr
- $511 – $949
Heat risk 2/10 · Minimal
- Hot days now (above 90°F)
- 7 days/yr
- Hot days in 30 yrs
- 15 days/yr
Wind risk 3/10 · Minor
- Chance of severe wind over 30 yrs
- 6.0%
Air-quality risk 2/10 · Minimal
- Unhealthy air days now
- 1 days/yr
- Unhealthy air days in 30 yrs
- 2 days/yr
Risk factors via First Street. Map © Google.
Why this score? — see what drove the C grade
The composite is a weighted blend of 9 inputs, each scored 0–100. Each bar is that input's sub-score; the figure is the points it added to the 100-point composite (weight × sub-score).
- Cash flow +22.4/30.0
- Appreciation +10.0/10.0
- DSCR +7.2/10.0
- 1% rule +6.5/10.0
- Schools +4.2/10.0
- Livability +3.4/5.0
- Rent growth +2.5/5.0
- Condition / age +2.5/5.0
- ARV discount +0.0/15.0
$298,900
🖨 Deal sheet (PDF) 📄 Offer letter ✓ Due diligence
Listing remarks MLS
This is an 4 Bed/ 2 Bath RANCH in r HEMLOCK FARMS! features include updated kitchen w/ stainless appliances, new bathroom, HARDWOOD flooring, VAULTED wood ceilings throughout, MINI SPLIT, propane fireplace, newer septic and water main!
Key facts
- Hardwood flooring
- New bathroom
- Stainless appliances
Tags
Property features AI
Finance
- Other: Zoning: R1 (residential); Subdivision: Hemlock Farms
- HOA & community: Homeowners association present; Association amenities include gated access, security, clubhouse, playground, indoor pool, outdoor pool, tennis courts, basketball court; Association fee collected annually (derived monthly: $243.17); Association fee includes trash, security, and grounds maintenance
Exterior
- Parking: Open parking for 4 vehicles
- Security: Association offers security and gated access
- Utilities: Septic tank
- Home design: Single-family residence; Residential property
- Construction: House (structure type)
- Exterior features: Deck; Shingle roof; Private maintained road
Interior
- Kitchen: Electric cooktop; Range; Refrigerator; Dishwasher
- Bedrooms: 6 total rooms (includes bedrooms and other rooms)
- Flooring: Hardwood; Laminate; Tile
- Bathrooms: 2 full bathrooms
- Heating & cooling: Ductless cooling; Baseboard heating; Ductless heating; Fireplace(s) heating option; Electric heating; Propane heating; Has fireplace (1)
- Interior features: Eat-in kitchen; Unfurnished; Deck (patio/porch)
- Laundry & utility: Washer and dryer; Laundry located in basement
Neighborhood map
What this means for you Summary
Snapshot
- This is a 4-bed/2.0-bath single-family listed at $299k.
Deal economics
- At list price, monthly cash flow is $497 ($6k/yr) — positive.
- The deal already cash-flows at list — no discount required.
- Meets the 1% rule at list price ($3k rent vs $299k).
- Cap rate 8.3% vs local median 6.9% in Hemlock Farms — meaningfully above typical; check what's discounted (condition, days-on-market, listing class) to confirm the premium yield is real.
Location & tenants
- Location reads 68/100 on livability (#884 in PA) — a middle-class / working-renter tenant base. Strengths: crime A+, housing A+, health & safety A+; Watch: amenities F, commute F.
- Wallenpaupack Area SD (rural): math 39% / reading 59% proficiency, ranked #192 of 539 in PA (top 36%) — families likely to look elsewhere, expect single-tenant / working-renter base with shorter leases.
- Zoned schools: Wallenpaupack South El Sch (math 47% / reading 52%, grade D, #654 of 1,518 statewide, top 47%, 255 students, 72% FRL); Wallenpaupack Area Ms (math 23% / reading 57%, grade F, #257 of 512 statewide, top 52%, 644 students, 59% FRL); Wallenpaupack Area Hs (math 74% / reading 67%, grade B+, #48 of 437 statewide, top 11%, 990 students, 62% FRL) — zoned schools average 64% FRL vs 44% district-wide (21 pts higher); higher-poverty schools than district average — tighter screening recommended.
- Market conditions: 375 active listings in the ZIP; 2 comparable units currently listed for rent nearby; 213 units permitted in Pike County in 2024 (0 in 5+ unit buildings).
Forward outlook
- In year one you build about $32k of equity ($2k loan paydown + $30k appreciation (10.0% local appreciation)).
- Pike County population projected at -25% by 2050 — secular population decline; favor cash flow + early exit over multi-decade hold.
- At projected returns (10.0% appreciation + 3.0% rent growth), your $84k cash investment doubles in ~3 years — after that, you're playing with house money.
- By year 2, paydown + projected appreciation supports a ~$51k cash-out refi (75% LTV) — recoverable capital for the next deal without selling this one.
Negotiation context
- Only 10 days on market — expect competitive offers; lowballing is unlikely to land.
- 4 sale attempts since 8y ago with the ask held roughly flat each time — persistent listings suggest the price (not the market) is what's stuck; bring a comps-based counter.
Questions for the listing agent
- Built in 1975 — when were the roof, HVAC, electrical panel, plumbing, and water heater last replaced?
- What does the HOA fee cover, when was the last increase, and are there any pending special assessments or reserve-fund shortfalls?
- Is there a deadline driving the sale (1031 exchange, divorce, estate, relocation)? That informs how much negotiation room exists.
- What's the average days-on-market for RENTAL listings here right now (not sales)? A rising rental-DOM trend means longer vacancies and softer asking-rent achievability than the comps imply.
- What's the recent tenant-quality profile in this submarket — average credit score on applications, eviction rate, late-payment / NSF rate, and stable-employment percentage? A property-management company in the area should have these aggregated.
- How much new for-sale + rental construction is in the pipeline within 1–3 miles? Heavy new supply typically softens prices + rents 12–24 months out; constrained supply supports both.
Investment metrics
- 1% rule
- 1.15% ✓
- Cap rate
- 8.29%
- Cash-on-cash
- 7.12%
- DSCR
- 1.32
- GRM
- 7.3
CMA / ARV
- ARV (median comp)
- $247,459
- List price
- $298,900
- Delta
- 20.79%
- Verdict
- OVERPRICED
- Comps
- 20 within 1.0 mi
Show comp detail 5 sales within ~0.75 mi
| Address | Dist | Beds/Ba | Sqft | Sold | Price | $/sf | Match |
|---|---|---|---|---|---|---|---|
| 106 Palomino Ln | 0.00mi | 4/2.0 | 1,375 (+1%) | 0mo | $294,000 | $214 | 97 |
| 801 Granite Ct S | 0.57mi | 3/2.0 (-1) | 1,305 (-4%) | 4mo | $283,000 | $217 | 59 |
| 138 West End Drive Dr | 0.47mi | 3/2.0 (-1) | 1,491 (+10%) | 6mo | $310,000 | $208 | 52 |
| 800 Colt Ct | 0.23mi | 3/3.0 (-1) | 1,556 (+15%) | 12mo | $295,000 | $190 | 46 |
| 226 Maple Ridge Dr | 0.67mi | 3/2.5 (-1) | 1,432 (+6%) | 20mo | $343,500 | $240 | 36 |
Match score weights: distance 35% · size 25% · config 20% · recency 20%. Top-matched comps best support the ARV.
Projected returns pro-forma
10.0% appreciation · 3.0% rent growth · sell at horizon
- IRR
- 29.5%
- Equity multiple
- 3.32×
- Total profit
- $194,573
- Equity at exit
- $269,273
- IRR
- 25.6%
- Equity multiple
- 7.55×
- Total profit
- $548,375
- Equity at exit
- $580,697
Cash invested: $83,692 (down + closing). Projections, not guarantees.
Landlord ↔ Tenant lean methodology
- Overall (STATE)
- 62 Landlord-Friendly
- State Pennsylvania
- 62 Landlord-Friendly · EVEN
- County
- — inherits STATE
- City
- — inherits STATE
ZIP-level market 18428
- Home prices YoY
- 9.2%
- Active inventory
- 375
- Price-to-rent
- 7.3×
Monthly cashflow live
- Estimated rent
- $3,423 medium interval (Pro) →
- Mortgage (P&I)
- −$1,567
- Tax from tax record
- −$272 /mo · $3,268/yr
- Insurance
- −$125
- HOA
- −$243
- Vacancy / Maint / Mgmt
- −$719
- Net cashflow
- $497
Break-even live
Sensitivity live
| Price | -10% $666 | -5% $581 | +0% $497 | +5% $412 | +10% $328 |
|---|---|---|---|---|---|
| Rent | -10% $226 | -5% $362 | +0% $497 | +5% $632 | +10% $767 |
| Rate | -1.0pp $647 | -0.5pp $573 | base $497 | +0.5pp $419 | +1.0pp $341 |
UW: 25.0% down · 7.5% · 30yr · 1.5% tax · 5.0% vac · 8.0% maint · 8.0% mgmt
Financing live
Cash to close
- Down payment
- $74,725
- Closing costs
- $8,967
- Reserves months
- —
- Total cash needed
- —
Loan-product check · same deal, 3 products live
Conventional
25% down · 7.5% · 30yr
- Down + closing
- —
- Monthly P&I
- —
- Monthly cashflow
- —
- DSCR
- —
- Eligible?
- —
Personal DTI + credit; lowest rate.
DSCR
20% down · 8.5% · 30yr
- Down + closing
- —
- Monthly P&I
- —
- Monthly cashflow
- —
- DSCR
- —
- Eligible?
- —
No personal income docs; deal must DSCR.
Hard money
10% down · 12.0% · 12mo
- Down + closing
- —
- Monthly P&I
- —
- Monthly cashflow
- —
- DSCR
- —
- Eligible?
- —
Short-term bridge; refi at stabilization.
Rent comps 2 comps
| Address | Beds | Baths | Sqft | Rent | $/sqft | DOM | Units | Dist |
|---|---|---|---|---|---|---|---|---|
| 811 Hickory Ct Hawley, PA | 3.0 | 2.0 | 1100 | $2,500 | $2.27 | 0d | 1 | 1.43mi |
| 101 Pommel Dr Hawley, PA | 3.0 | 2.0 | 1691 | $4,400 | $2.60 | 3d | 1 | 1.49mi |
HOA detail
- Monthly dues
- $243 · $2,916/yr
- Likely covers
- water
Listing history 7 events
-
2026-05-08status Pending 378-char remark
-
2026-04-28$298,900 Active 378-char remark
-
2025-05-23$305,000 Active
-
2018-07-02soldstatus $147,000
-
2018-06-28soldstatus $147,000
-
2018-01-26$153,500
-
1982-09-10soldstatus $55,000
ⓘ Source: listings_history table (triggers on properties + properties_extension) + one-shot
backfill from property_details.listing_events for pre-trigger history.
Tax reassessment forecast PA · Partial reset (capped growth)
- Current annual tax
- $3,268 · $272/mo
- Projected year-2 tax
- $3,995 · $333/mo
- Expected delta
- +$727/yr (+$61/mo · 22.3%)
ⓘ Screening estimate from a state-policy table — verify with the county assessor before closing.
Climate risk First Street
- Flood 1/10 Low FEMA zone X (unshaded) · 0% chance over 30 yrs
- Wildfire 4/10 Moderate
- Heat 2/10 Low 7 d/yr ≥90°F today · 15 d/yr by 30 yrs out
- Wind 3/10 Moderate 6% chance of damaging wind over 30 yrs
- Air quality 2/10 Low 1 unhealthy d/yr today · 2 by 30 yrs out
Nearby sold comps map
Loading sold comps map…
Walkable amenities ~0.75 mi
Loading nearby amenities…
Taxation est. · year 1
- Rental income
- $41,076
- − Mortgage interest
- −$16,743
- − Property taxes
- −$3,268
- − Insurance
- −$1,494
- − Repairs & maintenance
- −$3,286
- − Management
- −$3,286
- − HOA
- −$2,916
- − Depreciation
- −$8,695
- Taxable income
- $1,387
- Est. tax owed @ 24.0%
- −$333
- After-tax cash flow
- $5,629/yr
For passive investors: Depreciation is non-cash, so a rental often shows a tax loss while cash-flowing — sheltering income. Rental losses are passive: they offset passive income freely, and up to $25,000/yr can offset ordinary (W-2) income if you actively participate and your MAGI is under $100k (phasing out to $0 by $150k); unused losses carry forward. On sale, claimed depreciation is recaptured at up to 25%, and gains may owe capital-gains tax (a 1031 exchange can defer both). Figures are a year-1 estimate at your 24.0% rate — not tax advice; consult a CPA.
Schools (NCES district)
- District
- Wallenpaupack Area SD
- NCES district ID
- 4224750
- Math proficiency
- 39% ▼ -10.00%
- Reading proficiency
- 59% ▼ -5.00%
- Median HH income
- $51,027
- Composite
- 41.97/100
- National rank
- #3345
- State rank
- #192 of 539 in PA
Livability — Hemlock Farms
- Score
- 68/100
- State rank
- #884
- US rank
- #9421
Category grades
Schools grade is shown separately in the Schools card above.
Census & demographics
- Census place
- Hemlock Farms, PA
- Population (ZIP)
- 12,446
Population outlook (Pike County) Hauer SSP2
- Today (2025)
- 53,548 people
- By 2030
- 51,622 · -3.6%
- By 2040
- 46,490 · -13.2%
- By 2050
- 40,372 · -24.6%
- By 2075
- 31,951 · -40.3%
- By 2100
- 26,821 · -49.9%
Race, ethnicity, and origin ACS 2023
- Neighborhood character
- Predominantly White (85%)
- Race & ethnicity
- White 85% Hispanic / Latino 8% Two or more races 6% Black 1% Asian 1%
- Hispanic origin (detail)
- Puerto Rican 5%
- Common ancestry
- Romanian 5% Portuguese 3% Italian 2%
- Foreign-born
- 5% · Canada
- Languages at home
- 91% English-only · Spanish 5% Russian/Polish/Slavic 1% Other Asian/Pacific 1%
Political lean MEDSL · Pike
- 2024 margin
- Strong R (+24.1) · D 37.6% · R 61.6%
- 2008→2024 swing
- -19.8pp toward R · 2008: -4.2pp · 2024: -24.1pp
- All cycles
- 2024: R+24.1 2020: R+19.0 2016: R+26.0 2012: R+11.0 2008: R+4.2
Not yet ingested
- Civics
- —
Market trends
- HPI YoY
- ▲ 28.60%
- Current HPI
- 340.8254
- Rent YoY
- —
- Metro
- —
- State GDP YoY
- ▲ 1.68%
- F500 in state
- 34
Industry mix (Fortune 500 HQ in PA)
| Industry | F500 HQs | Revenue |
|---|---|---|
| Healthcare | 2 | $309B |
|
||
| Insurance | 2 | $27B |
|
||
| Telecommunications / Media | 1 | $124B |
|
||
| Industrial Distribution | 1 | $22B |
|
||
| Financial Services | 1 | $20B |
|
||
| Chemicals / Materials | 1 | $18B |
|
||
Price history
+434.5% since first listed10 events — show timeline
- 2026-06-11 Sold (MLS) $294,000 PMAR
- 2026-06-10 Sold (MLS) $294,000 PWMLS
- 2026-06-09 Listed $294,000 PWMLS
- 2026-05-08 Pending — PMAR
- 2026-04-28 Listed $298,900 PMAR
- 2025-05-23 Listed $305,000 PMAR
- 2018-07-02 Sold (Public Records) $147,000 Public Records
- 2018-06-28 Sold (MLS) $147,000 PWMLS
- 2018-01-26 Listed $153,500 PWMLS
- 1982-09-10 Sold (Public Records) $55,000 Public Records
Property tax history
+2.8%/yrLatest (2026): $3,268 · +3.0% YoY. Source: county tax records.
Cash-flow waterfall
monthlySold comps — $/sqft
last 12 mo · ≤1 miLoading sold comps…