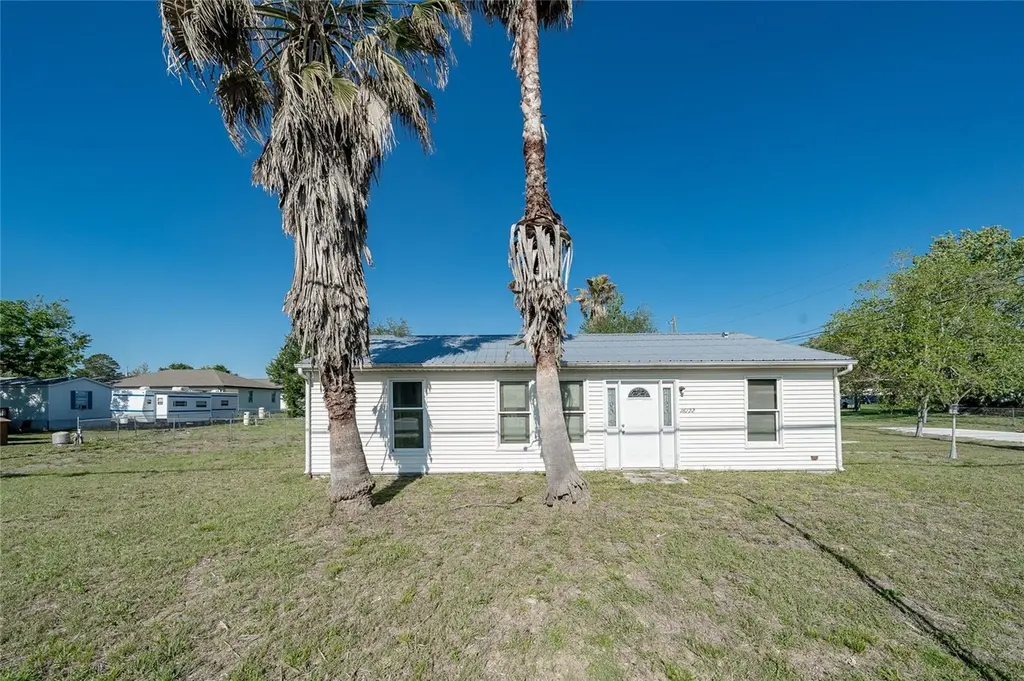
16172 Chancas St · Spring Hill, FL
Flood risk 1/10 · Minimal
- FEMA flood zone
- X (unshaded)
- Chance of flooding over 30 yrs
- 0.0%
- Est. flood insurance / yr
- $507 – $1,088
Fire risk 5/10 · Moderate
- Est. fire insurance / yr
- $947 – $1,759
Heat risk 10/10 · Severe
- Hot days now (above 109°F)
- 7 days/yr
- Hot days in 30 yrs
- 26 days/yr
Wind risk 10/10 · Severe
- Chance of severe wind over 30 yrs
- 99.0%
Air-quality risk 2/10 · Minimal
- Unhealthy air days now
- 2 days/yr
- Unhealthy air days in 30 yrs
- 2 days/yr
Risk factors via First Street. Map © Google.
Why this score? — see what drove the C- grade
The composite is a weighted blend of 9 inputs, each scored 0–100. Each bar is that input's sub-score; the figure is the points it added to the 100-point composite (weight × sub-score).
- Cash flow +18.2/30.0
- ARV discount +11.5/15.0
- DSCR +5.7/10.0
- 1% rule +4.6/10.0
- Schools +4.2/10.0
- Livability +3.2/5.0
- Rent growth +2.9/5.0
- Condition / age +2.5/5.0
- Appreciation +0.0/10.0
$159,000
🖨 Deal sheet (PDF) 📄 Offer letter ✓ Due diligence
Listing remarks MLS
HUD property sold as-is. Case no. 093-617844 Information from sources deemed to be reliable but not guaranteed. Buyer to verify all information. This home is priced below market and is a true must see.
Key facts
- 6,871 sq ft lot
- Built 2001
- Listed 35 days
Property features AI
Finance
- Other: Property type: Residential, Single Family Residence; Lot approximately 0.16 acres (0 to less than 1/4 acre); Road surface: dirt and paved; Living area about 960 square feet; Furnished: Unfurnished; Universal property ID available
- HOA & community: Pets allowed; No HOA/association
Exterior
- Parking: Directions: Powell to California to Chancas
- Utilities: Well water; Septic tank; Cable available; Electricity connected; Water connected
- Home design: Single family residence; One story; Faces west
- Construction: Vinyl siding and frame construction; Metal roof; Slab foundation; Built as a residential single-family home
- Exterior features: Private mailbox
Interior
- Kitchen: Dishwasher; Microwave; Range; Refrigerator
- Bedrooms: 2 bedrooms
- Flooring: Laminate
- Bathrooms: 2 full bathrooms
- Heating & cooling: Central heating; Central air conditioning
- Interior features: Open living room and dining room combo; Solid wood cabinets; Window treatments
- Laundry & utility: Laundry inside
Neighborhood map
What this means for you Summary
Snapshot
- This is a 2-bed/2.0-bath single-family listed at $159k.
Deal economics
- At list price, monthly cash flow is $142 ($2k/yr) — positive.
- The deal already cash-flows at list — no discount required.
- To meet the 1% rule (rent ≥ 1% of price), the offer needs to be $153k (3.6% below list).
- Recommended offer: $153k (3.6% below list) — sets the bar for 1% rule.
- Cap rate 7.4% vs local median 4.4% in Spring Hill — top-decile yield for the area; either an underpriced asset or a hidden risk that comps aren't pricing in. Stress-test before assuming the spread holds.
Location & tenants
- Location reads 63/100 on livability (#738 in FL) — a middle-class / working-renter tenant base. Strengths: cost of living A+, housing A+; Watch: health & safety C-, employment D+, amenities F.
- Hernando (suburban): math 50% / reading 50% proficiency, ranked #38 of 73 in FL (top 52%) — acceptable for families but not a draw, mixed tenant base, ~2y average lease.
- Market conditions: Rents rising (+1.6%/yr); 196 active listings in the ZIP; 2 comparable units currently listed for rent nearby; solid renter incomes; 2,505 units permitted in Hernando County in 2024 (318 in 5+ unit buildings).
Forward outlook
- Local home prices are declining (-3.0%/yr); year-one equity from $1k of loan paydown is wiped out by about $5k of value loss. Plan a longer hold.
- Hernando County population projected at +11% by 2050 — modest demand growth; plan on rents tracking national, not racing it.
Negotiation context
- It's been on market 35 days — a 3% lower offer ($154k) is reasonable based on typical stale-listing flexibility.
- 4 sale attempts since 22y ago; this cycle's ask has dropped $26k (14%) from the opening price — seller is motivated, your offer sets the floor, not the list.
- Current owner paid $27k; list at $159k implies a 489% gain — meaningful room to come down on a strong offer.
Risks & watch-outs
- Climate carrying-cost: severe wind risk, 99% chance of damaging wind over 30y; moderate wildfire risk; extreme-heat days projected 7→26/yr by 2055 (HVAC capex compounding) — expect insurance premiums to compound above CPI over the hold.
Questions for the listing agent
- It's been on market 35 days. Have you received any prior offers? Is the seller open to a 4% concession, seller financing, or rate buy-down credit?
- Is there a deadline driving the sale (1031 exchange, divorce, estate, relocation)? That informs how much negotiation room exists.
- What's the average days-on-market for RENTAL listings here right now (not sales)? A rising rental-DOM trend means longer vacancies and softer asking-rent achievability than the comps imply.
- What's the recent tenant-quality profile in this submarket — average credit score on applications, eviction rate, late-payment / NSF rate, and stable-employment percentage? A property-management company in the area should have these aggregated.
- How much new for-sale + rental construction is in the pipeline within 1–3 miles? Heavy new supply typically softens prices + rents 12–24 months out; constrained supply supports both.
Investment metrics
- 1% rule
- 0.96% ✗
- Cap rate
- 7.36%
- Cash-on-cash
- 3.83%
- DSCR
- 1.17
- GRM
- 8.6
CMA / ARV
- ARV (on-the-fly)
- $174,720
- Comps found
- 7
Show comp detail 7 sales within ~0.75 mi
| Address | Dist | Beds/Ba | Sqft | Sold | Price | $/sf | Match |
|---|---|---|---|---|---|---|---|
| 16172 Chancas St | 0.00mi | 2/2.0 | 960 (0%) | 0mo | $140,000 | $146 | 100 |
| 16160 Sarasota St | 0.17mi | 2/2.0 | 924 (-4%) | 22mo | $168,000 | $182 | 67 |
| 4307 Orlando Ave | 0.27mi | 2/2.0 | 910 (-5%) | 19mo | $143,000 | $157 | 63 |
| 16130 Schaffer St | 0.10mi | 2/2.0 | 840 (-12%) | 18mo | $134,900 | $161 | 60 |
| 16094 Putnam St | 0.37mi | 2/2.0 | 901 (-6%) | 20mo | $184,000 | $204 | 56 |
| 16076 Narrow St | 0.16mi | 3/2.0 (+1) | 1,067 (+11%) | 16mo | $195,000 | $183 | 56 |
| 16066 Narrow St | 0.18mi | 3/2.0 (+1) | 1,067 (+11%) | 16mo | $198,000 | $186 | 55 |
Match score weights: distance 35% · size 25% · config 20% · recency 20%. Top-matched comps best support the ARV.
Projected returns pro-forma
-3.0% appreciation · 1.61% rent growth · sell at horizon
- IRR
- -11.8%
- Equity multiple
- 0.58×
- Total profit
- $-18,830
- Equity at exit
- $23,707
- IRR
- -4.8%
- Equity multiple
- 0.70×
- Total profit
- $-13,166
- Equity at exit
- $13,747
Cash invested: $44,520 (down + closing). Projections, not guarantees.
Landlord ↔ Tenant lean methodology
- Overall (STATE)
- 87 Strongly Landlord-Friendly
- State Florida
- 87 Strongly Landlord-Friendly · R+3
- County
- — inherits STATE
- City
- — inherits STATE
ZIP-level market 34604
- Home prices YoY
- -23.4%
- Rents YoY
- 1.6%
- Active inventory
- 196
- Price-to-rent
- 8.6×
Monthly cashflow live
- Estimated rent
- $1,532 medium interval (Pro) →
- Mortgage (P&I)
- −$834
- Tax from tax record
- −$168 /mo · $2,019/yr
- Insurance
- −$66
- HOA
- −$0
- Vacancy / Maint / Mgmt
- −$322
- Net cashflow
- $142
Break-even live
Sensitivity live
| Price | -10% $232 | -5% $187 | +0% $142 | +5% $97 | +10% $52 |
|---|---|---|---|---|---|
| Rent | -10% $21 | -5% $81 | +0% $142 | +5% $203 | +10% $263 |
| Rate | -1.0pp $222 | -0.5pp $182 | base $142 | +0.5pp $101 | +1.0pp $59 |
UW: 25.0% down · 7.5% · 30yr · 1.5% tax · 5.0% vac · 8.0% maint · 8.0% mgmt
Financing live
Cash to close
- Down payment
- $39,750
- Closing costs
- $4,770
- Reserves months
- —
- Total cash needed
- —
Loan-product check · same deal, 3 products live
Conventional
25% down · 7.5% · 30yr
- Down + closing
- —
- Monthly P&I
- —
- Monthly cashflow
- —
- DSCR
- —
- Eligible?
- —
Personal DTI + credit; lowest rate.
DSCR
20% down · 8.5% · 30yr
- Down + closing
- —
- Monthly P&I
- —
- Monthly cashflow
- —
- DSCR
- —
- Eligible?
- —
No personal income docs; deal must DSCR.
Hard money
10% down · 12.0% · 12mo
- Down + closing
- —
- Monthly P&I
- —
- Monthly cashflow
- —
- DSCR
- —
- Eligible?
- —
Short-term bridge; refi at stabilization.
Rent comps 2 comps
| Address | Beds | Baths | Sqft | Rent | $/sqft | DOM | Units | Dist |
|---|---|---|---|---|---|---|---|---|
| 16108 Putnam St Brooksville, FL | 1.0 | 1.0 | 960 | $1,000 | $1.04 | 19d | 1 | 0.40mi |
| 286 Cherry Birch LN Masaryktown, FL | 3.0 | 1.0–2.0 | 964 | $1,702 | $1.77 | 0d | 44 | 0.61mi |
Listing history 12 events
-
2026-05-22status Pending
-
2026-05-18price $159,000
-
2026-05-05price $169,000
-
2026-04-24price $179,000
-
2026-04-17$185,000 Active
-
2015-08-12soldstatus $27,000 201-char remark
Show marketing remark (201 chars)
HUD property sold as-is. Case no. 093-617844 Information from sources deemed to be reliable but not guaranteed. Buyer to verify all information. This home is priced below market and is a true must see.
-
2015-07-02$25,000 201-char remark
Show marketing remark (201 chars)
HUD property sold as-is. Case no. 093-617844 Information from sources deemed to be reliable but not guaranteed. Buyer to verify all information. This home is priced below market and is a true must see.
-
2005-08-02soldstatus $77,000
-
2005-04-19$74,990
-
2004-11-17soldstatus $66,000
-
2004-11-10soldstatus $66,000
-
2004-02-27$69,900
ⓘ Source: listings_history table (triggers on properties + properties_extension) + one-shot
backfill from property_details.listing_events for pre-trigger history.
Tax reassessment forecast FL · Resets to sale price
- Current annual tax
- $2,019 · $168/mo
- Projected year-2 tax
- $2,019 · $168/mo
- Expected delta
- $0/yr ($0/mo · -0.0%)
ⓘ Screening estimate from a state-policy table — verify with the county assessor before closing.
Climate risk First Street
- Flood 1/10 Low FEMA zone X (unshaded) · 0% chance over 30 yrs
- Wildfire 5/10 Major
- Heat 10/10 Extreme 7 d/yr ≥109°F today · 26 d/yr by 30 yrs out
- Wind 10/10 Extreme 99% chance of damaging wind over 30 yrs
- Air quality 2/10 Low 2 unhealthy d/yr today · 2 by 30 yrs out
Nearby sold comps map
Loading sold comps map…
Walkable amenities ~0.75 mi
Loading nearby amenities…
Taxation est. · year 1
- Rental income
- $18,384
- − Mortgage interest
- −$8,906
- − Property taxes
- −$2,019
- − Insurance
- −$795
- − Repairs & maintenance
- −$1,471
- − Management
- −$1,471
- − Depreciation
- −$4,625
- Taxable loss
- −$903
- Est. tax savings @ 24.0%
- +$217
- After-tax cash flow
- $1,921/yr
For passive investors: Depreciation is non-cash, so a rental often shows a tax loss while cash-flowing — sheltering income. Rental losses are passive: they offset passive income freely, and up to $25,000/yr can offset ordinary (W-2) income if you actively participate and your MAGI is under $100k (phasing out to $0 by $150k); unused losses carry forward. On sale, claimed depreciation is recaptured at up to 25%, and gains may owe capital-gains tax (a 1031 exchange can defer both). Figures are a year-1 estimate at your 24.0% rate — not tax advice; consult a CPA.
Schools (NCES district)
- District
- Hernando
- NCES district ID
- 1200810
- Math proficiency
- 50% ▼ -8.00%
- Reading proficiency
- 50% ▼ -4.00%
- Median HH income
- $41,985
- Composite
- 42.03/100
- National rank
- #3329
- State rank
- #38 of 73 in FL
Livability — Spring Hill
- Score
- 63/100
- State rank
- #738
- US rank
- #15937
Category grades
Schools grade is shown separately in the Schools card above.
Census & demographics
- Census place
- Spring Hill, FL
- County
- Hernando County · 169,677 people
- City population
- 83,915
- Metro
- Tampa-St. Petersburg-Clearwater, FL
- Population (ZIP)
- 13,642
- Household income
- $84,833
- Rent vs Own
- Severe rent burden
- 142.0
Population outlook (Hernando County) Hauer SSP2
- Today (2025)
- 189,218 people
- By 2030
- 194,367 · +2.7%
- By 2040
- 203,398 · +7.5%
- By 2050
- 209,589 · +10.8%
- By 2075
- 218,452 · +15.4%
- By 2100
- 205,923 · +8.8%
Race, ethnicity, and origin ACS 2023
- Neighborhood character
- Predominantly White (74%)
- Race & ethnicity
- White 74% Hispanic / Latino 16% Two or more races 10% Black 3% Asian 2%
- Hispanic origin (detail)
- Mexican 1% Puerto Rican 10% Cuban 3%
- Common ancestry
- Romanian 3% Lithuanian 2% Scotch-Irish 2%
- Foreign-born
- 4% · Canada
- Languages at home
- 89% English-only · Spanish 8% Other Indo-European 1% Russian/Polish/Slavic 1%
Political lean MEDSL · Hernando
- 2024 margin
- Solid R (+37.0) · D 31.1% · R 68.2%
- 2008→2024 swing
- -33.5pp toward R · 2008: -3.6pp · 2024: -37.0pp
- All cycles
- 2024: R+37.0 2020: R+30.2 2016: R+29.0 2012: R+8.5 2008: R+3.6
Not yet ingested
- Civics
- —
Market trends
- HPI YoY
- ▼ -84.38%
- Current HPI
- 276.4751
- Rent YoY
- ▲ 1.61%
- Metro
- Tampa-St. Petersburg-Clearwater, FL
- State GDP YoY
- ▲ 3.28%
- F500 in state
- 36
Industry mix (Fortune 500 HQ in FL)
| Industry | F500 HQs | Revenue |
|---|---|---|
| Industrial Technology | 2 | $29B |
|
||
| Insurance | 2 | $17B |
|
||
| Retail | 1 | $60B |
|
||
| Technology Distribution | 1 | $58B |
|
||
| Homebuilding | 1 | $35B |
|
||
| Technology Manufacturing | 1 | $35B |
|
||
Price history
+127.5% since first listed12 events — show timeline
- 2026-05-22 Pending — Stellar MLS as Distributed by MLS Grid
- 2026-05-18 Price Changed $159,000 Stellar MLS as Distributed by MLS Grid
- 2026-05-05 Price Changed $169,000 Stellar MLS as Distributed by MLS Grid
- 2026-04-24 Price Changed $179,000 Stellar MLS as Distributed by MLS Grid
- 2026-04-17 Listed $185,000 Stellar MLS as Distributed by MLS Grid
- 2015-08-12 Sold (MLS) $27,000 Stellar MLS as Distributed by MLS Grid
- 2015-07-02 Listed $25,000 Stellar MLS as Distributed by MLS Grid
- 2005-08-02 Sold (Public Records) $77,000 Public Records
- 2005-04-19 Listed $74,990 HCAR
- 2004-11-17 Sold (Public Records) $66,000 Public Records
- 2004-11-10 Sold (MLS) $66,000 HCAR
- 2004-02-27 Listed $69,900 HCAR
Property tax history
+17.3%/yrLatest (2025): $2,019 · -1.7% YoY. Source: county tax records.
Cash-flow waterfall
monthlySold comps — $/sqft
last 12 mo · ≤1 miLoading sold comps…