10825 Dennington Rd · Fort Myers, FL
Flood risk 1/10 · Minimal
- FEMA flood zone
- X (unshaded)
- Chance of flooding over 30 yrs
- 0.0%
- Est. flood insurance / yr
- $507 – $1,088
Fire risk 3/10 · Minor
- Est. fire insurance / yr
- $947 – $1,759
Heat risk 10/10 · Severe
- Hot days now (above 107°F)
- 7 days/yr
- Hot days in 30 yrs
- 30 days/yr
Wind risk 10/10 · Severe
- Chance of severe wind over 30 yrs
- 99.0%
Air-quality risk 2/10 · Minimal
- Unhealthy air days now
- 1 days/yr
- Unhealthy air days in 30 yrs
- 1 days/yr
Risk factors via First Street. Map © Google.
Why this score? — see what drove the D grade
The composite is a weighted blend of 9 inputs, each scored 0–100. Each bar is that input's sub-score; the figure is the points it added to the 100-point composite (weight × sub-score).
- Cash flow +16.9/30.0
- 1% rule +5.5/10.0
- DSCR +5.2/10.0
- Livability +4.3/5.0
- Schools +4.1/10.0
- ARV discount +2.9/15.0
- Rent growth +2.6/5.0
- Condition / age +2.5/5.0
- Appreciation +0.0/10.0
$480,000
🖨 Deal sheet 📄 Offer letter ✓ Due diligence
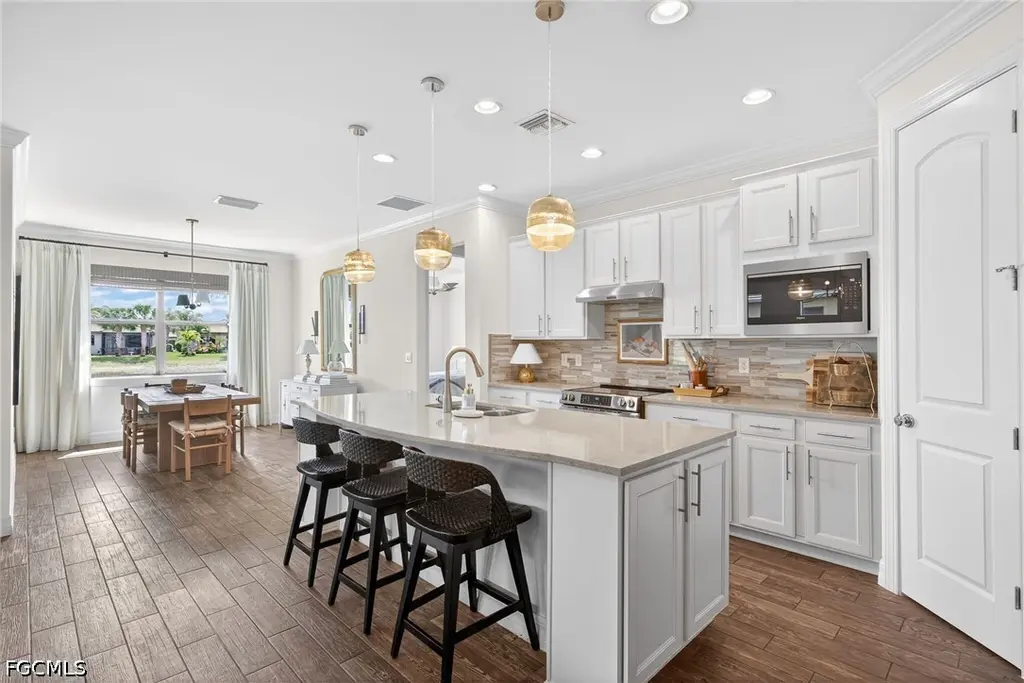
Listing remarks
Style, comfort, and thoughtful upgrades come together beautifully in this 3 Bedroom + Den, 2 Bathroom home with serene lake views. Crown molding and upgraded lighting throughout add a touch of sophistication, while the gorgeous Kitchen stands out with quartz countertops, a stylish tile backsplash, recessed lighting, and eye-catching pendant lights. Designed for both beauty and functionality, the Kitchen also includes lower cabinet pull-outs along with a low-profile stove and newer refrigerator and microwave, making organization and everyday cooking effortless. The Laundry Room is exceptionally well-equipped with abundant cabinetry for storage along with a convenient sink—perfect for k
Key facts
- 8,276 sq ft lot
- 2 garage spots
- Community pool
Property features AI
Finance
- Other: Community size: 985 units; Community pool
- Financial info: Pets allowed (call/conditional)
- HOA & community: Homeowners association (quarterly fee); Association fee includes management, cable TV, internet, irrigation water, pest control, recreation facilities, reserve fund, road maintenance and street lights; Community amenities: clubhouse, fitness center, pool, spa/hot tub, tennis courts, pickleball, bocce court, playground, park, barbecue/picnic area, sidewalks; On-site management; Gated community with street lights
Exterior
- Parking: Attached 2-car garage; Covered parking; Driveway (paved); Garage with door opener; Two parking spaces
- Security: Gated community; Security gate; Smoke detector(s)
- Utilities: Public water; Public sewer; Cable available; High speed internet available; Underground utilities; Reclaimed irrigation water
- Home design: Single-story; Entry level: 1; Resale property; North-facing
- Construction: Block, metal frame, concrete and stucco construction; Tile roof
- Exterior features: Lanai; Screened porch; Porch; Sprinkler/irrigation; Room for pool; Manual shutters; Pond on lot; Rectangular lot; South exposure; Private paved road frontage; Private maintained road
Interior
- Kitchen: Dishwasher; Freezer; Icemaker; Microwave; Range; Self-cleaning oven; Disposal; Refrigerator; Refrigerator with ice maker; Pantry; Breakfast bar; Eat-in kitchen
- Bedrooms: Main level bedroom(s)
- Flooring: Carpet; Tile
- Bathrooms: 2 full bathrooms; Dual sinks; Separate shower; Bathtub
- Heating & cooling: Central heating (electric); Central air conditioning (electric)
- Interior features: Breakfast bar; Built-in features; Entrance foyer; High ceilings; Tray ceiling(s); Living/dining room; Eat-in kitchen; Pantry; Cable TV available; High speed internet available; Home office; Split bedrooms; Main level primary; Bedroom on main level; Dual sinks; Separate shower; Bathtub; Walk-in closet(s); French doors
- Laundry & utility: Washer; Dryer; Laundry tub; Laundry inside
Neighborhood map
What this means for you Summary
Snapshot
- This is a 3-bed/2.0-bath single-family listed at $480k.
Deal economics
- At list price, monthly cash flow is $313 ($4k/yr) — positive.
- The deal already cash-flows at list — no discount required.
- Meets the 1% rule at list price ($5k rent vs $480k).
- Recommended offer: $451k (6.0% below list) — sets the bar for market timing.
- Cap rate 7.1% vs local median 3.0% in Fort Myers — top-decile yield for the area; either an underpriced asset or a hidden risk that comps aren't pricing in. Stress-test before assuming the spread holds.
Location & tenants
- Location reads 86/100 on livability (#14 in FL, #383 nationally) — a professional / high-income tenant draw. Strengths: amenities A+, commute A+, housing A+.
- Lee (suburban): math 47% / reading 50% proficiency, ranked #42 of 73 in FL (top 58%) — families likely to look elsewhere, expect single-tenant / working-renter base with shorter leases.
- Market conditions: Rents flat; 811 active listings in the ZIP; 40 comparable units currently listed for rent nearby; rentals at typical pace (median 24d on market — plan ~3-4 weeks tenant-placement turnaround); high-income renter base; 15,411 units permitted in Lee County in 2024 (4,686 in 5+ unit buildings).
- At $5,051/mo this rent would consume 55% of the median local household income ($110k/yr) (locally 276% of renters already pay >50% of income on rent) — very limited rent-growth headroom before tenants either downsize or default.
Forward outlook
- Local home prices are declining (-3.0%/yr); year-one equity from $3k of loan paydown is wiped out by about $14k of value loss. Plan a longer hold.
- Lee County population projected at +44% by 2050 — long-run rental-demand tailwind backs the buy-and-hold thesis.
Negotiation context
- It's been on market 83 days — a 6% lower offer ($451k) is reasonable based on typical stale-listing flexibility.
Risks & watch-outs
- Climate carrying-cost: severe wind risk, 99% chance of damaging wind over 30y; extreme-heat days projected 7→30/yr by 2055 (HVAC capex compounding) — expect insurance premiums to compound above CPI over the hold.
Questions for the listing agent
- It's been on market 83 days. Have you received any prior offers? Is the seller open to a 6% concession, seller financing, or rate buy-down credit?
- What does the HOA fee cover, when was the last increase, and are there any pending special assessments or reserve-fund shortfalls?
- Why hasn't it sold? Are there any deal-killer items the seller is aware of (foundation, flood, title, zoning, code violations)?
- Is there a deadline driving the sale (1031 exchange, divorce, estate, relocation)? That informs how much negotiation room exists.
- The area grade is low — what's the realistic commute time and amenity access for the typical tenant pool here? Any planned neighborhood developments (good or bad) we should know about?
- What's the average days-on-market for RENTAL listings here right now (not sales)? A rising rental-DOM trend means longer vacancies and softer asking-rent achievability than the comps imply.
- What's the recent tenant-quality profile in this submarket — average credit score on applications, eviction rate, late-payment / NSF rate, and stable-employment percentage? A property-management company in the area should have these aggregated.
- How much new for-sale + rental construction is in the pipeline within 1–3 miles? Heavy new supply typically softens prices + rents 12–24 months out; constrained supply supports both.
Investment metrics
- 1% rule
- 1.05% ✓
- Cap rate
- 7.07%
- Cash-on-cash
- 2.79%
- DSCR
- 1.12
- GRM
- 7.9
CMA / ARV
- ARV (on-the-fly)
- $435,812
- Comps found
- 12
Show comp detail 12 sales within ~0.75 mi
| Address | Dist | Beds/Ba | Sqft | Sold | Price | $/sf | Match |
|---|---|---|---|---|---|---|---|
| 12120 Corcoran Pl | 0.37mi | 3/2.0 | 1,939 (-2%) | 7mo | $575,000 | $297 | 74 |
| 11800 Meadowrun Cir | 0.38mi | 2/2.0 (-1) | 2,104 (+7%) | 2mo | $550,000 | $261 | 64 |
| 10911 Glenhurst St | 0.20mi | 3/3.0 | 2,171 (+10%) | 10mo | $409,000 | $188 | 62 |
| 11897 Clifton Ter | 0.61mi | 3/2.0 | 1,862 (-6%) | 4mo | $550,000 | $295 | 58 |
| 11884 Bourke Pl | 0.68mi | 3/2.0 | 2,107 (+7%) | 15mo | $615,000 | $292 | 44 |
| 11548 Lakewood Preserve Pl | 0.64mi | 3/2.5 | 2,242 (+14%) | 2mo | $490,000 | $219 | 43 |
| 12051 Lakewood Preserve Pl | 0.72mi | 2/2.0 (-1) | 1,857 (-6%) | 12mo | $410,000 | $221 | 42 |
| 11643 Riverstone Ln | 0.63mi | 3/2.5 | 2,242 (+14%) | 7mo | $390,000 | $174 | 40 |
| 11581 Riverstone Ln | 0.73mi | 3/2.5 | 2,242 (+14%) | 4mo | $495,000 | $221 | 38 |
| 11872 Bourke Pl | 0.71mi | 3/2.0 | 2,107 (+7%) | 22mo | $670,000 | $318 | 38 |
| 11520 Foxbriar Ln | 0.74mi | 3/2.5 | 2,242 (+14%) | 5mo | $490,000 | $219 | 36 |
| 11530 Foxbriar Ln | 0.73mi | 3/2.5 | 2,242 (+14%) | 6mo | $445,000 | $198 | 36 |
Match score weights: distance 35% · size 25% · config 20% · recency 20%. Top-matched comps best support the ARV.
Projected returns pro-forma
-3.0% appreciation · 0.37% rent growth · sell at horizon
- IRR
- -15.1%
- Equity multiple
- 0.47×
- Total profit
- $-70,600
- Equity at exit
- $71,570
- IRR
- -12.3%
- Equity multiple
- 0.37×
- Total profit
- $-85,338
- Equity at exit
- $41,502
Cash invested: $134,400 (down + closing). Projections, not guarantees.
Landlord ↔ Tenant lean methodology
- Overall (STATE)
- 87 Strongly Landlord-Friendly
- State Florida
- 87 Strongly Landlord-Friendly · R+3
- County
- — inherits STATE
- City
- — inherits STATE
ZIP-level market 33913
- Home prices YoY
- -10.3%
- Rents YoY
- 0.4%
- Active inventory
- 811
- Price-to-rent
- 7.9×
Monthly cashflow live
- Estimated rent
- $5,051 high interval (Pro) →
- Mortgage (P&I)
- −$2,517
- Tax from tax record
- −$489 /mo · $5,864/yr
- Insurance
- −$200
- HOA
- −$472
- Vacancy / Maint / Mgmt
- −$1,061
- Net cashflow
- $313
Break-even live
UW: 25.0% down · 7.5% · 30yr · 1.5% tax · 5.0% vac · 8.0% maint · 8.0% mgmt
Financing live
Cash to close
- Down payment
- $120,000
- Closing costs
- $14,400
- Reserves months
- —
- Total cash needed
- —
Loan-product check · same deal, 3 products live
Conventional
25% down · 7.5% · 30yr
- Down + closing
- —
- Monthly P&I
- —
- Monthly cashflow
- —
- DSCR
- —
- Eligible?
- —
Personal DTI + credit; lowest rate.
DSCR
20% down · 8.5% · 30yr
- Down + closing
- —
- Monthly P&I
- —
- Monthly cashflow
- —
- DSCR
- —
- Eligible?
- —
No personal income docs; deal must DSCR.
Hard money
10% down · 12.0% · 12mo
- Down + closing
- —
- Monthly P&I
- —
- Monthly cashflow
- —
- DSCR
- —
- Eligible?
- —
Short-term bridge; refi at stabilization.
Rent comps 40 comps
| Address | Beds | Baths | Sqft | Rent | $/sqft | DOM | Units | Dist |
|---|---|---|---|---|---|---|---|---|
| 10908 Clarendon St Fort Myers, FL | 3.0 | 2.0 | 1433 | $8,000 | $5.58 | 14d | 1 | 0.09mi |
| 10908 Clarendon St Fort Myers, FL | 3.0 | 2.0 | 1433 | $8,000 | $5.58 | 23d | 1 | 0.09mi |
| 10900 Glenhurst St Fort Myers, FL | 2.0 | 2.0 | 1355 | $2,200 | $1.62 | 2d | 1 | 0.16mi |
| 10952 Clarendon St Fort Myers, FL | 2.0 | 2.0 | 1582 | $4,000 | $2.53 | 23d | 1 | 0.18mi |
| 12016 Five Waters Cir Fort Myers, FL | 3.0 | 2.0 | 1646 | $4,500 | $2.73 | 23d | 1 | 0.27mi |
| 10271 Glastonbury Cir #102 Fort Myers, FL | 2.0 | 2.0 | 1550 | $4,500 | $2.90 | 23d | 1 | 0.32mi |
| 11619 Meadowrun Cir Fort Myers, FL | 3.0 | 2.5 | 2242 | $2,495 | $1.11 | 23d | 1 | 0.32mi |
| 11012 Castlereagh St Fort Myers, FL | 3.0 | 3.0 | 2517 | $12,000 | $4.77 | 23d | 1 | 0.33mi |
| 12171 Treeline Ave Fort Myers, FL | 1.0–3.0 | 1.0–2.0 | 1321 | $3,402 | $2.58 | 3d | 23 | 0.35mi |
| 10879 Rutherford Rd Fort Myers, FL | 2.0 | 2.0 | 1566 | $3,500 | $2.23 | 23d | 1 | 0.37mi |
| 10535 Carolina Willow Dr Fort Myers, FL | 3.0 | 2.0 | 1290 | $2,300 | $1.78 | 21d | 1 | 0.50mi |
| 11701 Avingston Ter Fort Myers, FL | 2.0 | 2.0 | 1553 | $5,500 | $3.54 | 14d | 1 | 0.55mi |
| 11541 Stonecreek Cir Fort Myers, FL | 3.0 | 3.0 | 2147 | $3,300 | $1.54 | 23d | 1 | 0.58mi |
| 11617 Lakewood Preserve Pl Fort Myers, FL | 3.0 | 2.5 | 2242 | $3,100 | $1.38 | 16d | 1 | 0.59mi |
| 11593 Lakewood Preserve Pl Fort Myers, FL | 2.0 | 2.0 | 1985 | $2,800 | $1.41 | 23d | 1 | 0.59mi |
| 11869 Lakewood Preserve Pl Fort Myers, FL | 2.0 | 2.0 | 1646 | $5,000 | $3.04 | 23d | 1 | 0.71mi |
| 11225 Lithgow Ln Fort Myers, FL | 2.0 | 2.0 | 2153 | $8,000 | $3.72 | 23d | 1 | 0.71mi |
| 11230 Suffield St Fort Myers, FL | 2.0 | 2.0 | 1560 | $8,500 | $5.45 | 23d | 1 | 0.80mi |
| 12908 New Market St #201 Fort Myers, FL | 3.0 | 2.5 | 2198 | $3,000 | $1.36 | 23d | 1 | 0.85mi |
| 10280 Crepe Jasmine Ln Unit 1546286P Fort Myers, FL | 3.0 | 2.0 | 1571 | $4,526 | $2.88 | 16d | 1 | 0.90mi |
| 11442 Tiverton Trce Fort Myers, FL | 3.0 | 2.0 | 2010 | $9,500 | $4.73 | 23d | 1 | 1.00mi |
| 11075 Lancewood St Fort Myers, FL | 3.0 | 2.0 | 1575 | $2,300 | $1.46 | 16d | 1 | 1.04mi |
| 11075 Lancewood St Fort Myers, FL | 3.0 | 2.0 | 1575 | $2,300 | $1.46 | 23d | 1 | 1.04mi |
| 10791 Palazzo Way #301 Fort Myers, FL | 2.0 | 2.0 | 1390 | $5,300 | $3.81 | 23d | 1 | 1.06mi |
| 10751 Palazzo Way #103 Fort Myers, FL | 2.0 | 2.0 | 1235 | $5,000 | $4.05 | 23d | 1 | 1.07mi |
| 10711 Palazzo Way Fort Myers, FL | 2.0 | 2.0 | 1257 | $3,900 | $3.10 | 16d | 2 | 1.09mi |
| 10711 Palazzo Way Unit 203 Fort Myers, FL | 2.0 | 2.0 | 1257 | $5,300 | $4.22 | 21d | 1 | 1.09mi |
| 10820 Palazzo Way #203 Fort Myers, FL | 2.0 | 2.0 | 1235 | $5,400 | $4.37 | 23d | 1 | 1.11mi |
| 11343 Tiverton Trce Fort Myers, FL | 2.0 | 2.0 | 1685 | $4,000 | $2.37 | 3d | 1 | 1.14mi |
| 10700 Palazzo Way #201 Fort Myers, FL | 2.0 | 2.0 | 1390 | $5,000 | $3.60 | 21d | 1 | 1.15mi |
| 13068 Georges Cay Pl Fort Myers, FL | 3.0 | 2.5 | 1590 | $2,900 | $1.82 | 14d | 1 | 1.17mi |
| 13071 Georges Cay Pl Fort Myers, FL | 3.0 | 3.0 | 1600 | $3,800 | $2.38 | 23d | 1 | 1.18mi |
| 10121 Colonial Country Club Blvd #1802 Fort Myers, FL | 2.0 | 2.0 | 1530 | $4,800 | $3.14 | 3d | 1 | 1.18mi |
| 10128 Colonial Country Club Blvd #602 Fort Myers, FL | 2.0 | 2.0 | 1530 | $4,600 | $3.01 | 23d | 1 | 1.22mi |
| 13104 Georges Cay Pl Fort Myers, FL | 3.0 | 2.5 | 1590 | $3,100 | $1.95 | 23d | 1 | 1.24mi |
| 10602 Camarelle Cir Fort Myers, FL | 2.0 | 2.0 | 1690 | $5,500 | $3.25 | 23d | 1 | 1.26mi |
| 11012 Mill Creek Way #2205 Fort Myers, FL | 2.0 | 2.0 | 1749 | $5,500 | $3.14 | 23d | 1 | 1.27mi |
| 10112 Colonial Country Club Blvd #209 Fort Myers, FL | 2.0 | 2.0 | 1530 | $5,000 | $3.27 | 23d | 1 | 1.27mi |
| 10111 Colonial Country Club Blvd #2308 Fort Myers, FL | 2.0 | 2.0 | 1309 | $2,000 | $1.53 | 11d | 1 | 1.27mi |
| 11011 Mill Creek Way #1307 Fort Myers, FL | 2.0 | 2.0 | 1379 | $5,000 | $3.63 | 23d | 1 | 1.31mi |
HOA detail
- Monthly dues
- $472 · $5,664/yr
Listing history 13 events
-
2026-06-17days on market $480,000 Active 83 DOM
-
2026-06-16days on market $480,000 Active 82 DOM
-
2026-06-15days on market $480,000 Active 81 DOM
-
2026-06-13pricedays on market $480,000 Active 79 DOM
-
2026-06-10days on market $482,500 Active 76 DOM
-
2026-06-09days on market $482,500 Active 75 DOM
-
2026-06-07days on market $482,500 Active 73 DOM
-
2026-06-03days on market $482,500 Active 69 DOM
-
2026-06-02days on market $482,500 Active 68 DOM
-
2026-06-01days on market $482,500 Active 67 DOM
-
2026-06-01days on market $482,500 Active 66 DOM
-
2026-04-23price $485,000
-
2026-03-11$499,000 Active
ⓘ Source: listings_history table (triggers on properties + properties_extension) + one-shot
backfill from property_details.listing_events for pre-trigger history.
Tax reassessment forecast FL · Resets to sale price
- Current annual tax
- $5,864 · $489/mo
- Projected year-2 tax
- $5,864 · $489/mo
- Expected delta
- $0/yr ($0/mo · 0.0%)
ⓘ Screening estimate from a state-policy table — verify with the county assessor before closing.
Climate risk First Street
- Flood 1/10 Low FEMA zone X (unshaded) · 0% chance over 30 yrs
- Wildfire 3/10 Moderate
- Heat 10/10 Extreme 7 d/yr ≥107°F today · 30 d/yr by 30 yrs out
- Wind 10/10 Extreme 99% chance of damaging wind over 30 yrs
- Air quality 2/10 Low 1 unhealthy d/yr today · 1 by 30 yrs out
Nearby sold comps map
Loading sold comps map…
Walkable amenities ~0.75 mi
Loading nearby amenities…
Taxation est. · year 1
- Rental income
- $60,614
- − Mortgage interest
- −$26,887
- − Property taxes
- −$5,864
- − Insurance
- −$2,400
- − Repairs & maintenance
- −$4,849
- − Management
- −$4,849
- − HOA
- −$5,664
- − Depreciation
- −$13,964
- Taxable loss
- −$3,864
- Est. tax savings @ 24.0%
- +$927
- After-tax cash flow
- $4,678/yr
For passive investors: Depreciation is non-cash, so a rental often shows a tax loss while cash-flowing — sheltering income. Rental losses are passive: they offset passive income freely, and up to $25,000/yr can offset ordinary (W-2) income if you actively participate and your MAGI is under $100k (phasing out to $0 by $150k); unused losses carry forward. On sale, claimed depreciation is recaptured at up to 25%, and gains may owe capital-gains tax (a 1031 exchange can defer both). Figures are a year-1 estimate at your 24.0% rate — not tax advice; consult a CPA.
Schools (NCES district)
- District
- Lee
- NCES district ID
- 1201080
- Math proficiency
- 47% ▼ -11.00%
- Reading proficiency
- 50% ▼ -4.00%
- Median HH income
- $49,518
- Composite
- 41.49/100
- National rank
- #3458
- State rank
- #42 of 73 in FL
Livability — Fort Myers
- Score
- 86/100
- State rank
- #14
- US rank
- #383
Category grades
Schools grade is shown separately in the Schools card above.
Census & demographics
- Census place
- Fort Myers, FL
- County
- Lee County · 788,662 people
- City population
- 278,598
- Metro
- Cape Coral-Fort Myers, FL
- Population (ZIP)
- 31,538
- Household income
- $110,373
- Rent vs Own
- Severe rent burden
- 276.0
Population outlook (Lee County) Hauer SSP2
- Today (2025)
- 871,946 people
- By 2030
- 955,468 · +9.6%
- By 2040
- 1,113,587 · +27.7%
- By 2050
- 1,256,891 · +44.1%
- By 2075
- 1,560,270 · +78.9%
- By 2100
- 1,726,848 · +98.0%
Race, ethnicity, and origin ACS 2023
- Neighborhood character
- Predominantly White (74%)
- Race & ethnicity
- White 74% Hispanic / Latino 13% Two or more races 11% Black 5% Asian 2%
- Hispanic origin (detail)
- Mexican 3% Puerto Rican 3% Cuban 2%
- Common ancestry
- Romanian 5% Lithuanian 3% Slovak 2%
- Foreign-born
- 14% · Canada, Vietnam, China
- Languages at home
- 84% English-only · Spanish 10% Other Indo-European 2% French/Haitian/Cajun 2%
Political lean MEDSL · Lee
- 2024 margin
- Strong R (+28.4) · D 35.5% · R 63.9%
- 2008→2024 swing
- -18.0pp toward R · 2008: -10.4pp · 2024: -28.4pp
- All cycles
- 2024: R+28.4 2020: R+19.2 2016: R+20.4 2012: R+16.6 2008: R+10.4
Not yet ingested
- Civics
- —
Market trends
- HPI YoY
- ▼ -25.45%
- Current HPI
- 221.7115
- Rent YoY
- ▲ 0.37%
- Metro
- Cape Coral-Fort Myers, FL
- State GDP YoY
- ▲ 3.28%
- F500 in state
- 36
Industry mix (Fortune 500 HQ in FL)
| Industry | F500 HQs | Revenue |
|---|---|---|
| Industrial Technology | 2 | $29B |
|
||
| Insurance | 2 | $17B |
|
||
| Retail | 1 | $60B |
|
||
| Technology Distribution | 1 | $58B |
|
||
| Homebuilding | 1 | $35B |
|
||
| Technology Manufacturing | 1 | $35B |
|
||
Price history
-2.8% since first listed2 events — show timeline
- 2026-04-23 Price Changed $485,000 FORTMLS
- 2026-03-11 Listed $499,000 FORTMLS
Property tax history
+8.4%/yrLatest (2025): $5,864 · +2.2% YoY. Source: county tax records.
Cash-flow waterfall
monthlySold comps — $/sqft
last 12 mo · ≤1 miLoading sold comps…