 Triplex
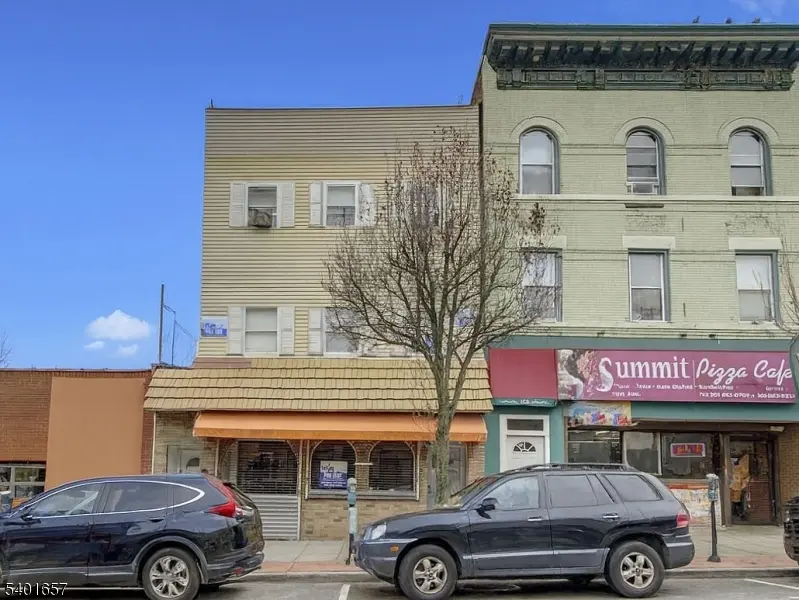
1011 SUMMIT Ave · Union City, NJ
Flood risk No data
- FEMA flood zone
- —
- Chance of flooding over 30 yrs
- —
- Est. flood insurance / yr
- —
Fire risk No data
- Est. fire insurance / yr
- —
Heat risk No data
- Hot days now (above threshold)
- —
- Hot days in 30 yrs
- —
Wind risk No data
- Chance of severe wind over 30 yrs
- —
Air-quality risk No data
- Unhealthy air days now
- —
- Unhealthy air days in 30 yrs
- —
Risk factors via First Street. Map © Google.
Why this score? — see what drove the C- grade
The composite is a weighted blend of 9 inputs, each scored 0–100. Each bar is that input's sub-score; the figure is the points it added to the 100-point composite (weight × sub-score).
- Cash flow +14.9/30.0
- Appreciation +10.0/10.0
- ARV discount +7.5/15.0
- DSCR +4.6/10.0
- 1% rule +4.1/10.0
- Livability +3.9/5.0
- Rent growth +2.7/5.0
- Condition / age +2.5/5.0
- Schools +2.2/10.0
$899,000
🖨 Deal sheet 📄 Offer letter ✓ Due diligence
Multi-family units
County records classify this as Multi-Family (2-4 Unit). Listing-text estimate: 3 units. confirmed
Listing remarks MLS
Excellent investment opportunity on Summit Ave in Union City featuring 3 apartments plus ground-level commercial space. Prime location just 5 miles from Manhattan, one bus stop to Port Authority, and minutes to the PATH train. High-demand rental area with exceptional transit access, strong income potential, and long-term appreciation. Ideal for investors seeking a mixed-use asset in the heart of Hudson County.
Key facts
- Prime location
- Listed 81 days
Tags
Neighborhood map
What this means for you Summary
Snapshot
- This is a 3 × 3-bed/1.8-bath units multifamily listed at $899k.
Deal economics
- At list price, monthly cash flow is $266 ($3k/yr) — positive. Per door: $89/mo.
- The deal already cash-flows at list — no discount required.
- To meet the 1% rule (rent ≥ 1% of price), the offer needs to be $820k (8.8% below list).
- Recommended offer: $820k (8.8% below list) — sets the bar for 1% rule.
- Cap rate 6.6% vs local median 2.3% in Union City — top-decile yield for the area; either an underpriced asset or a hidden risk that comps aren't pricing in. Stress-test before assuming the spread holds.
Location & tenants
- Location reads 77/100 on livability (#117 in NJ, #2,998 nationally) — a middle-class / working-renter tenant base. Strengths: amenities A+, commute A+, health & safety A; Watch: cost of living F.
- Union City School District (suburban): math 15% / reading 36% proficiency, ranked #399 of 472 in NJ (top 84%) — low school quality limits family demand, transient renter base, plan for 1-2y turnover; 85% free/reduced lunch — lower-income household profile, screen leases tightly.
- Market conditions: Rents flat; 226 active listings in the ZIP; 5,310 units permitted in Hudson County in 2024 (4,154 in 5+ unit buildings).
- At $8,201/mo this rent would consume 153% of the median local household income ($64k/yr) (locally 6042% of renters already pay >50% of income on rent) — very limited rent-growth headroom before tenants either downsize or default.
Forward outlook
- In year one you build about $96k of equity ($6k loan paydown + $90k appreciation (10.0% local appreciation)).
- Hudson County population projected at +29% by 2050 — long-run rental-demand tailwind backs the buy-and-hold thesis.
- At projected returns (10.0% appreciation + 0.9% rent growth), your $252k cash investment doubles in ~3 years — after that, you're playing with house money.
- By year 2, paydown + projected appreciation supports a ~$155k cash-out refi (75% LTV) — recoverable capital for the next deal without selling this one.
Negotiation context
- It's been on market 81 days — a 6% lower offer ($845k) is reasonable based on typical stale-listing flexibility.
- 4 sale attempts with the ask held roughly flat each time — persistent listings suggest the price (not the market) is what's stuck; bring a comps-based counter.
Questions for the listing agent
- It's been on market 81 days. Have you received any prior offers? Is the seller open to a 9% concession, seller financing, or rate buy-down credit?
- Can we see the unit-by-unit rent roll, current vacancy, and any below-market leases? What's the average tenancy length?
- What capital expenditures (roof, boiler, parking lot, exteriors) have been made in the last 5 years, and what's planned in the next 2?
- Why hasn't it sold? Are there any deal-killer items the seller is aware of (foundation, flood, title, zoning, code violations)?
- Is there a deadline driving the sale (1031 exchange, divorce, estate, relocation)? That informs how much negotiation room exists.
- What's the average days-on-market for RENTAL listings here right now (not sales)? A rising rental-DOM trend means longer vacancies and softer asking-rent achievability than the comps imply.
- What's the recent tenant-quality profile in this submarket — average credit score on applications, eviction rate, late-payment / NSF rate, and stable-employment percentage? A property-management company in the area should have these aggregated.
- How much new apartment / multifamily construction is in the pipeline within 1–3 miles? Heavy new supply (>2% of stock underway) typically softens rents 12–24 months out; light construction supports rent growth.
Investment metrics
- 1% rule
- 0.91% ✗
- Cap rate
- 6.65%
- Cash-on-cash
- 1.27%
- DSCR
- 1.06
- GRM
- 9.1
CMA / ARV
No comps found within radius.
Show comp detail 12 sales within ~0.75 mi
| Address | Dist | Beds/Ba | Sqft | Sold | Price | $/sf | Match |
|---|---|---|---|---|---|---|---|
| 615 11TH St | 0.15mi | 9/3.5 | — | 6mo | $995,000 | — | 68 |
| 1111 6TH St | 0.22mi | 10/4.5 (+1) | — | 0mo | $940,000 | — | 68 |
| 419 16TH St | 0.40mi | 10/5.0 (+1) | — | 6mo | $900,000 | — | 57 |
| 103 POPLAR St | 0.48mi | 8/7.0 (-1) | — | 6mo | $1,999,999 | — | 49 |
| 300-302 BERGENLINE Ave | 0.43mi | 8/4.0 (-1) | — | 10mo | $1,300,000 | — | 48 |
| 2105 NEW YORK Ave | 0.65mi | 9/4.0 | — | 5mo | $942,500 | — | 47 |
| 308 18TH St | 0.56mi | 8/5.0 (-1) | — | 11mo | $1,400,000 | — | 46 |
| 2211 NEW YORK Ave | 0.70mi | 9/4.0 | — | 4mo | $960,000 | — | 46 |
| 811 24TH St | 0.70mi | 10/6.0 (+1) | — | 2mo | $948,000 | — | 45 |
| 313 18TH St | 0.53mi | 8/3.0 (-1) | — | 5mo | $999,000 | — | 44 |
| 315 22ND St | 0.69mi | 8/4.0 (-1) | — | 1mo | $1,150,000 | — | 44 |
| 116 BLEECKER St | 0.75mi | 8/5.0 (-1) | — | 4mo | $1,430,000 | — | 43 |
Match score weights: distance 35% · size 25% · config 20% · recency 20%. Top-matched comps best support the ARV.
Projected returns pro-forma
10.0% appreciation · 0.89% rent growth · sell at horizon
- IRR
- 24.5%
- Equity multiple
- 2.95×
- Total profit
- $489,632
- Equity at exit
- $809,890
- IRR
- 21.1%
- Equity multiple
- 6.55×
- Total profit
- $1,397,104
- Equity at exit
- $1,746,559
Cash invested: $251,720 (down + closing). Projections, not guarantees.
Landlord ↔ Tenant lean methodology
- Overall (STATE)
- 21 Tenant-Leaning
- State New Jersey
- 21 Tenant-Leaning · D+6
- County
- — inherits STATE
- City
- — inherits STATE
ZIP-level market 07087
- Home prices YoY
- 9.6%
- Rents YoY
- 0.9%
- Active inventory
- 226
- Price-to-rent
- 27.4×
Monthly cashflow live
- Estimated rent
- $8,201 high interval (Pro) →
- Mortgage (P&I)
- −$4,714
- Tax est. 1.5%
- −$1,124 /mo · $13,485/yr
- Insurance
- −$375
- HOA
- −$0
- Vacancy / Maint / Mgmt
- −$1,722
- Net cashflow
- $266
Break-even live
3-unit breakdown (identical units grouped — click to expand)
| Units | Beds | Baths | Est. rent |
|---|---|---|---|
| 3× units | 3 | 1.8 | $8,202 |
| #1 | 3 | 1.8 | $2,734 |
| #2 | 3 | 1.8 | $2,734 |
| #3 | 3 | 1.8 | $2,734 |
| Total (3 units) | $8,201 | ||
UW: 25.0% down · 7.5% · 30yr · 1.5% tax · 5.0% vac · 8.0% maint · 8.0% mgmt
Financing live
Cash to close
- Down payment
- $224,750
- Closing costs
- $26,970
- Reserves months
- —
- Total cash needed
- —
Loan-product check · same deal, 3 products live
Conventional
25% down · 7.5% · 30yr
- Down + closing
- —
- Monthly P&I
- —
- Monthly cashflow
- —
- DSCR
- —
- Eligible?
- —
Personal DTI + credit; lowest rate.
DSCR
20% down · 8.5% · 30yr
- Down + closing
- —
- Monthly P&I
- —
- Monthly cashflow
- —
- DSCR
- —
- Eligible?
- —
No personal income docs; deal must DSCR.
Hard money
10% down · 12.0% · 12mo
- Down + closing
- —
- Monthly P&I
- —
- Monthly cashflow
- —
- DSCR
- —
- Eligible?
- —
Short-term bridge; refi at stabilization.
Listing history 7 events
-
2026-03-11status Under Contract
-
2026-02-25historical Active Under Contract 413-char remark
Show marketing remark (413 chars)
Excellent investment opportunity on Summit Ave in Union City featuring 3 apartments plus ground-level commercial space. Prime location just 5 miles from Manhattan, one bus stop to Port Authority, and minutes to the PATH train. High-demand rental area with exceptional transit access, strong income potential, and long-term appreciation. Ideal for investors seeking a mixed-use asset in the heart of Hudson County.
-
2026-02-25status Active 413-char remark
Show marketing remark (413 chars)
Excellent investment opportunity on Summit Ave in Union City featuring 3 apartments plus ground-level commercial space. Prime location just 5 miles from Manhattan, one bus stop to Port Authority, and minutes to the PATH train. High-demand rental area with exceptional transit access, strong income potential, and long-term appreciation. Ideal for investors seeking a mixed-use asset in the heart of Hudson County.
-
2026-02-17status Under Contract 413-char remark
Show marketing remark (413 chars)
Excellent investment opportunity on Summit Ave in Union City featuring 3 apartments plus ground-level commercial space. Prime location just 5 miles from Manhattan, one bus stop to Port Authority, and minutes to the PATH train. High-demand rental area with exceptional transit access, strong income potential, and long-term appreciation. Ideal for investors seeking a mixed-use asset in the heart of Hudson County.
-
2025-12-15$899,000 Active 413-char remark
Show marketing remark (413 chars)
Excellent investment opportunity on Summit Ave in Union City featuring 3 apartments plus ground-level commercial space. Prime location just 5 miles from Manhattan, one bus stop to Port Authority, and minutes to the PATH train. High-demand rental area with exceptional transit access, strong income potential, and long-term appreciation. Ideal for investors seeking a mixed-use asset in the heart of Hudson County.
-
2025-12-14$899,000 Active
ⓘ Source: listings_history table (triggers on properties + properties_extension) + one-shot
backfill from property_details.listing_events for pre-trigger history.
Nearby sold comps map
Loading sold comps map…
Walkable amenities ~0.75 mi
Loading nearby amenities…
Taxation est. · year 1
- Rental income
- $98,412
- − Mortgage interest
- −$50,358
- − Property taxes
- −$13,485
- − Insurance
- −$4,495
- − Repairs & maintenance
- −$7,873
- − Management
- −$7,873
- − Depreciation
- −$26,153
- Taxable loss
- −$11,825
- Est. tax savings @ 24.0%
- +$2,838
- After-tax cash flow
- $6,030/yr
For passive investors: Depreciation is non-cash, so a rental often shows a tax loss while cash-flowing — sheltering income. Rental losses are passive: they offset passive income freely, and up to $25,000/yr can offset ordinary (W-2) income if you actively participate and your MAGI is under $100k (phasing out to $0 by $150k); unused losses carry forward. On sale, claimed depreciation is recaptured at up to 25%, and gains may owe capital-gains tax (a 1031 exchange can defer both). Figures are a year-1 estimate at your 24.0% rate — not tax advice; consult a CPA.
Schools (NCES district)
- District
- Union City School District
- NCES district ID
- 3416380
- Math proficiency
- 15% ▼ -19.00%
- Reading proficiency
- 36% ▼ -19.00%
- Median HH income
- $41,210
- Composite
- 21.55/100
- National rank
- #8312
- State rank
- #399 of 472 in NJ
Livability — Union City
- Score
- 77/100
- State rank
- #117
- US rank
- #2998
Category grades
Schools grade is shown separately in the Schools card above.
Census & demographics
- Census place
- Union City, NJ
- County
- Hudson County · 718,323 people
- City population
- 66,463
- Metro
- New York-Newark-Jersey City, NY-NJ-PA
- Population (ZIP)
- 66,463
- Household income
- $64,310
- Rent vs Own
- Severe rent burden
- 6042.0
Population outlook (Hudson County) Hauer SSP2
- Today (2025)
- 771,834 people
- By 2030
- 818,028 · +6.0%
- By 2040
- 907,866 · +17.6%
- By 2050
- 994,480 · +28.8%
- By 2075
- 1,163,301 · +50.7%
- By 2100
- 1,254,703 · +62.6%
Race, ethnicity, and origin ACS 2023
- Neighborhood character
- Predominantly Hispanic (82%)
- Race & ethnicity
- Hispanic / Latino 82% Two or more races 28% White 10% Asian 4% Black 3% Native American 2%
- Hispanic origin (detail)
- Mexican 7% Puerto Rican 8% Cuban 9% Dominican 17%
- Foreign-born
- 55% · Canada, Jamaica, China
- Languages at home
- 18% English-only · Spanish 74% Other Indo-European 2% Arabic 1%
Political lean MEDSL · Hudson
- 2024 margin
- Strong D (+28.1) · D 62.6% · R 34.6% · Other 2.8%
- 2008→2024 swing
- -18.7pp toward R · 2008: 46.7pp · 2024: 28.1pp
- All cycles
- 2024: D+28.1 2020: D+46.2 2016: D+51.8 2012: D+55.7 2008: D+46.7
Not yet ingested
- Civics
- —
Market trends
- HPI YoY
- ▲ 52.10%
- Current HPI
- 597.8126
- Rent YoY
- ▲ 0.89%
- Metro
- New York-Newark-Jersey City, NY-NJ-PA
- State GDP YoY
- ▲ 2.05%
- F500 in state
- 34
Industry mix (Fortune 500 HQ in NJ)
| Industry | F500 HQs | Revenue |
|---|---|---|
| Consumer Goods | 3 | $31B |
|
||
| Pharmaceuticals | 2 | $153B |
|
||
| Technology | 2 | $21B |
|
||
| Insurance | 2 | $20B |
|
||
| Healthcare | 2 | $19B |
|
||
| Financial Services | 1 | $70B |
|
||
Price history
+0.0% since first listed7 events — show timeline
- 2026-03-11 Pending — HCMLS
- 2026-02-25 Contingent — NJMLS
- 2026-02-25 Relisted — NJMLS
- 2026-02-17 Pending — GSMLS
- 2025-12-15 Listed $899,000 NJMLS
- 2025-12-15 Listed $899,000 GSMLS
- 2025-12-14 Listed $899,000 HCMLS
Cash-flow waterfall
monthlySold comps — $/sqft
last 12 mo · ≤1 miLoading sold comps…