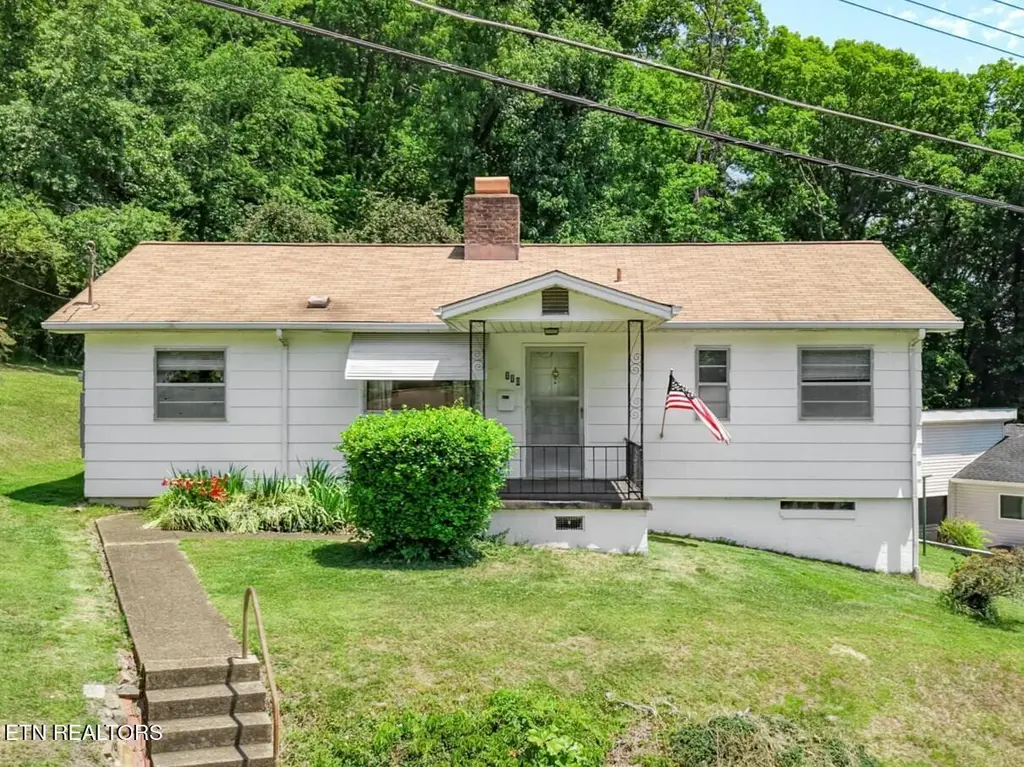
110 Disston Rd · Oak Ridge, TN
Flood risk 1/10 · Minimal
- FEMA flood zone
- X (unshaded)
- Chance of flooding over 30 yrs
- 0.0%
- Est. flood insurance / yr
- $507 – $1,088
Fire risk 2/10 · Minimal
- Est. fire insurance / yr
- $949 – $1,763
Heat risk 5/10 · Moderate
- Hot days now (above 103°F)
- 7 days/yr
- Hot days in 30 yrs
- 18 days/yr
Wind risk 2/10 · Minimal
- Chance of severe wind over 30 yrs
- 2.0%
Air-quality risk 3/10 · Minor
- Unhealthy air days now
- 3 days/yr
- Unhealthy air days in 30 yrs
- 4 days/yr
Risk factors via First Street. Map © Google.
Why this score? — see what drove the C grade
The composite is a weighted blend of 9 inputs, each scored 0–100. Each bar is that input's sub-score; the figure is the points it added to the 100-point composite (weight × sub-score).
- Cash flow +20.8/30.0
- ARV discount +15.0/15.0
- DSCR +6.6/10.0
- 1% rule +4.4/10.0
- Livability +3.9/5.0
- Rent growth +3.3/5.0
- Schools +3.1/10.0
- Condition / age +2.5/5.0
- Appreciation +0.0/10.0
$179,900
🖨 Deal sheet 📄 Offer letter ✓ Due diligence
Listing remarks
Steeped in history, this charming ranch style home with just over a 1,000 sq ft sits nestled on a large park like yard. With two bedrooms and one bath, this ''A-Extended style home'' is one of the original homes constructed in 1943 for The Secret City Project. It features a covered carport and a crawl space for extra storage. This home greets you with a covered front porch, and it has been owned by the same family since its construction. The interior features a large eat in kitchen with the original custom Scheirich Company wooden cabinets and a large living/dining room area. Includes hardwood floors! Relax on the covered back porch while watching songbirds and the deer. The yard backs up
Key facts
- Covered front porch
- Large eat in kitchen
- Crawl space
Tags
Property features AI
Exterior
- Parking: Detached carport; On-street parking; 1 carport space
- Utilities: Public sewer
- Home design: Detached property; 1,008 building area (per tax records)
- Construction: Cement siding; Block and frame construction
- Exterior features: Rolling slope lot; Country setting with wooded views
Interior
- Kitchen: Microwave; Refrigerator
- Flooring: Carpet; Hardwood; Vinyl
- Bathrooms: 1 full bathroom
- Heating & cooling: Baseboard heating; Electric heating; Other heating; Window air conditioning units
- Interior features: 5 total rooms; Wood-burning fireplace
- Laundry & utility: Washer; Dryer
Neighborhood map
What this means for you Summary
Snapshot
- This is a 2-bed/1.0-bath single-family listed at $180k.
Deal economics
- At list price, monthly cash flow is $246 ($3k/yr) — positive.
- The deal already cash-flows at list — no discount required.
- To meet the 1% rule (rent ≥ 1% of price), the offer needs to be $168k (6.5% below list).
- Recommended offer: $168k (6.5% below list) — sets the bar for 1% rule.
- Cap rate 7.9% vs local median 3.4% in Oak Ridge — top-decile yield for the area; either an underpriced asset or a hidden risk that comps aren't pricing in. Stress-test before assuming the spread holds.
Location & tenants
- Location reads 78/100 on livability (#4 in TN, #2,605 nationally) — a middle-class / working-renter tenant base. Strengths: amenities A+, cost of living A+, housing A+; Watch: commute F.
- Oak Ridge (suburban): math 34% / reading 37% proficiency, ranked #23 of 139 in TN (top 16%) — families likely to look elsewhere, expect single-tenant / working-renter base with shorter leases.
- Zoned schools: Glenwood Elementary (math 67% / reading 52%, grade B-, #60 of 952 statewide, top 7%, 367 students, 0% FRL); Jefferson Middle School (math 32% / reading 33%, grade F, #81 of 333 statewide, top 26%, 721 students, 0% FRL); Oak Ridge High School (math 10% / reading 53%, grade F, #69 of 332 statewide, top 21%, 1,587 students, 0% FRL) — zoned schools average 0% FRL vs 40% district-wide (40 pts lower); this property's tenant base skews higher-income than the district average.
- Market conditions: Rents rising (+3.1%/yr); 189 active listings in the ZIP; 7 comparable units currently listed for rent nearby; rentals leasing fast (median 3d on market — plan ~1-2 weeks tenant-placement turnaround); 400 units permitted in Anderson County in 2024 (91 in 5+ unit buildings).
Forward outlook
- Local home prices are declining (-3.0%/yr); year-one equity from $1k of loan paydown is wiped out by about $5k of value loss. Plan a longer hold.
Negotiation context
- Only 2 days on market — expect competitive offers; lowballing is unlikely to land.
Risks & watch-outs
- Watch-outs: built in 1943 — expect roof / HVAC / electrical / plumbing capex.
- Climate carrying-cost: extreme-heat days projected 7→18/yr by 2055 (HVAC capex compounding) — expect insurance premiums to compound above CPI over the hold.
Questions for the listing agent
- Built in 1943 — when were the roof, HVAC, electrical panel, plumbing, and water heater last replaced?
- Is there a deadline driving the sale (1031 exchange, divorce, estate, relocation)? That informs how much negotiation room exists.
- What's the average days-on-market for RENTAL listings here right now (not sales)? A rising rental-DOM trend means longer vacancies and softer asking-rent achievability than the comps imply.
- What's the recent tenant-quality profile in this submarket — average credit score on applications, eviction rate, late-payment / NSF rate, and stable-employment percentage? A property-management company in the area should have these aggregated.
- How much new for-sale + rental construction is in the pipeline within 1–3 miles? Heavy new supply typically softens prices + rents 12–24 months out; constrained supply supports both.
Investment metrics
- 1% rule
- 0.94% ✗
- Cap rate
- 7.93%
- Cash-on-cash
- 5.86%
- DSCR
- 1.26
- GRM
- 8.9
CMA / ARV
- ARV (on-the-fly)
- $238,896
- Comps found
- 12
Show comp detail 12 sales within ~0.75 mi
| Address | Dist | Beds/Ba | Sqft | Sold | Price | $/sf | Match |
|---|---|---|---|---|---|---|---|
| 106 Dewey Rd | 0.16mi | 2/1.0 | 960 (-5%) | 1mo | $286,000 | $298 | 84 |
| 103 Cahill Ln | 0.16mi | 3/1.0 (+1) | 944 (-6%) | 1mo | $245,000 | $260 | 76 |
| 135 W Arrowwood Rd | 0.31mi | 3/1.0 (+1) | 1,048 (+4%) | 9mo | $250,000 | $239 | 66 |
| 119 W Arrowwood Rd | 0.37mi | 3/1.0 (+1) | 1,056 (+5%) | 8mo | $260,000 | $246 | 63 |
| 119 Aspen Ln | 0.39mi | 3/1.0 (+1) | 1,056 (+5%) | 7mo | $190,000 | $180 | 63 |
| 114 Aspen Ln | 0.39mi | 3/1.0 (+1) | 1,056 (+5%) | 8mo | $240,000 | $227 | 62 |
| 117 California Ave | 0.18mi | 3/1.0 (+1) | 1,125 (+12%) | 8mo | $210,000 | $187 | 60 |
| 112 Andover Cir | 0.65mi | 3/1.0 (+1) | 1,056 (+5%) | 1mo | $242,000 | $229 | 56 |
| 121 Amherst Ln | 0.69mi | 3/1.0 (+1) | 1,056 (+5%) | 3mo | $285,000 | $270 | 52 |
| 516 Delaware Ave | 0.46mi | 2/1.0 | 1,144 (+14%) | 6mo | $259,500 | $227 | 51 |
| 126 Atlanta | 0.66mi | 3/1.0 (+1) | 1,056 (+5%) | 8mo | $249,900 | $237 | 50 |
| 101 Olmstead Ln | 0.52mi | 2/1.0 | 1,152 (+14%) | 10mo | $265,000 | $230 | 43 |
Match score weights: distance 35% · size 25% · config 20% · recency 20%. Top-matched comps best support the ARV.
Projected returns pro-forma
-3.0% appreciation · 3.11% rent growth · sell at horizon
- IRR
- -7.2%
- Equity multiple
- 0.73×
- Total profit
- $-13,383
- Equity at exit
- $26,824
- IRR
- 2.5%
- Equity multiple
- 1.18×
- Total profit
- $8,976
- Equity at exit
- $15,554
Cash invested: $50,372 (down + closing). Projections, not guarantees.
Landlord ↔ Tenant lean methodology
- Overall (STATE)
- 87 Strongly Landlord-Friendly
- State Tennessee
- 87 Strongly Landlord-Friendly · R+13
- County
- — inherits STATE
- City
- — inherits STATE
ZIP-level market 37830
- Home prices YoY
- -33.2%
- Rents YoY
- 3.1%
- Active inventory
- 189
- Price-to-rent
- 8.9×
Monthly cashflow live
- Estimated rent
- $1,683 high interval (Pro) →
- Mortgage (P&I)
- −$943
- Tax from tax record
- −$65 /mo · $784/yr
- Insurance
- −$75
- HOA
- −$0
- Vacancy / Maint / Mgmt
- −$353
- Net cashflow
- $246
Break-even live
UW: 25.0% down · 7.5% · 30yr · 1.5% tax · 5.0% vac · 8.0% maint · 8.0% mgmt
Financing live
Cash to close
- Down payment
- $44,975
- Closing costs
- $5,397
- Reserves months
- —
- Total cash needed
- —
Loan-product check · same deal, 3 products live
Conventional
25% down · 7.5% · 30yr
- Down + closing
- —
- Monthly P&I
- —
- Monthly cashflow
- —
- DSCR
- —
- Eligible?
- —
Personal DTI + credit; lowest rate.
DSCR
20% down · 8.5% · 30yr
- Down + closing
- —
- Monthly P&I
- —
- Monthly cashflow
- —
- DSCR
- —
- Eligible?
- —
No personal income docs; deal must DSCR.
Hard money
10% down · 12.0% · 12mo
- Down + closing
- —
- Monthly P&I
- —
- Monthly cashflow
- —
- DSCR
- —
- Eligible?
- —
Short-term bridge; refi at stabilization.
Rent comps 7 comps
| Address | Beds | Baths | Sqft | Rent | $/sqft | DOM | Units | Dist |
|---|---|---|---|---|---|---|---|---|
| 126 Arkansas Ave Oak Ridge, TN | 3.0 | 1.0 | 1056 | $1,600 | $1.52 | 19d | 1 | 0.56mi |
| 113 Arcadia Ln Unit B Oak Ridge, TN | 2.0 | 1.5 | 905 | $1,500 | $1.66 | 3d | 1 | 0.85mi |
| 116 Arcadia Ln Unit A Oak Ridge, TN | 2.0 | 1.5 | 1164 | $1,795 | $1.54 | 3d | 1 | 0.89mi |
| 110 Emerson Cir Oak Ridge, TN | 3.0 | 2.5 | 1450 | $1,995 | $1.38 | 3d | 1 | 0.94mi |
| 100 E Tennessee Ave Unit 101 Oak Ridge, TN | 2.0 | 1.0 | 889 | $1,575 | $1.77 | 3d | 1 | 0.99mi |
| 82 E Tennessee Ave Oak Ridge, TN | 2.0 | 1.0 | 710 | $1,475 | $2.08 | 3d | 5 | 1.06mi |
| 101 E Magnolia Ln Oak Ridge, TN | 3.0 | 1.0 | 1395 | $2,000 | $1.43 | 23d | 1 | 1.43mi |
Listing history 1 events
-
2026-05-26$179,900 Active
ⓘ Source: listings_history table (triggers on properties + properties_extension) + one-shot
backfill from property_details.listing_events for pre-trigger history.
Tax reassessment forecast TN · Resets to sale price
- Current annual tax
- $784 · $65/mo
- Projected year-2 tax
- $1,277 · $106/mo
- Expected delta
- +$493/yr (+$41/mo · 62.9%)
ⓘ Screening estimate from a state-policy table — verify with the county assessor before closing.
Climate risk First Street
- Flood 1/10 Low FEMA zone X (unshaded) · 0% chance over 30 yrs
- Wildfire 2/10 Low
- Heat 5/10 Major 7 d/yr ≥103°F today · 18 d/yr by 30 yrs out
- Wind 2/10 Low 2% chance of damaging wind over 30 yrs
- Air quality 3/10 Moderate 3 unhealthy d/yr today · 4 by 30 yrs out
Nearby sold comps map
Loading sold comps map…
Walkable amenities ~0.75 mi
Loading nearby amenities…
Taxation est. · year 1
- Rental income
- $20,195
- − Mortgage interest
- −$10,077
- − Property taxes
- −$784
- − Insurance
- −$900
- − Repairs & maintenance
- −$1,616
- − Management
- −$1,616
- − Depreciation
- −$5,233
- Taxable loss
- −$30
- Est. tax savings @ 24.0%
- +$7
- After-tax cash flow
- $2,957/yr
For passive investors: Depreciation is non-cash, so a rental often shows a tax loss while cash-flowing — sheltering income. Rental losses are passive: they offset passive income freely, and up to $25,000/yr can offset ordinary (W-2) income if you actively participate and your MAGI is under $100k (phasing out to $0 by $150k); unused losses carry forward. On sale, claimed depreciation is recaptured at up to 25%, and gains may owe capital-gains tax (a 1031 exchange can defer both). Figures are a year-1 estimate at your 24.0% rate — not tax advice; consult a CPA.
Schools (NCES district)
- District
- Oak Ridge
- NCES district ID
- 4703240
- Math proficiency
- 34% ▼ -3.00%
- Reading proficiency
- 37% ▼ -4.00%
- Median HH income
- $49,949
- Composite
- 30.75/100
- National rank
- #6159
- State rank
- #23 of 139 in TN
Livability — Oak Ridge
- Score
- 78/100
- State rank
- #4
- US rank
- #2605
Category grades
Schools grade is shown separately in the Schools card above.
Census & demographics
- Census place
- Oak Ridge, TN
- County
- Anderson County · 33,038 people
- City population
- 33,038
- Metro
- Knoxville, TN
- Population (ZIP)
- 33,038
- Household income
- $72,269
- Rent vs Own
- Severe rent burden
- 914.0
Population outlook (Anderson County) Hauer SSP2
- Today (2025)
- 76,963 people
- By 2030
- 77,226 · +0.3%
- By 2040
- 76,905 · -0.1%
- By 2050
- 75,405 · -2.0%
- By 2075
- 70,858 · -7.9%
- By 2100
- 60,585 · -21.3%
Race, ethnicity, and origin ACS 2023
- Neighborhood character
- Predominantly White (80%)
- Race & ethnicity
- White 80% Two or more races 7% Hispanic / Latino 6% Black 6% Asian 3%
- Hispanic origin (detail)
- Mexican 4%
- Common ancestry
- Serbian 3% Slovak 3% Italian 3%
- Foreign-born
- 6% · Canada, China, South Korea
- Languages at home
- 91% English-only · Spanish 5% Chinese 1% German/W. Germanic 1%
Political lean MEDSL · Anderson
- 2024 margin
- Solid R (+35.7) · D 31.5% · R 67.3% · Other 1.2%
- 2008→2024 swing
- -9.5pp toward R · 2008: -26.2pp · 2024: -35.7pp
- All cycles
- 2024: R+35.7 2020: R+32.2 2016: R+34.3 2012: R+29.8 2008: R+26.2
Not yet ingested
- Civics
- —
Market trends
- HPI YoY
- ▼ -160.89%
- Current HPI
- 323.0396
- Rent YoY
- ▲ 3.11%
- Metro
- Knoxville, TN
- State GDP YoY
- ▲ 2.78%
- F500 in state
- 22
Industry mix (Fortune 500 HQ in TN)
| Industry | F500 HQs | Revenue |
|---|---|---|
| Healthcare | 3 | $91B |
|
||
| Retail | 3 | $72B |
|
||
| Transportation / Logistics | 1 | $88B |
|
||
| Paper / Packaging | 1 | $19B |
|
||
| Insurance | 1 | $13B |
|
||
| Energy | 1 | $12B |
|
||
Price history
1 event — show timeline
- 2026-05-26 Listed $179,900 Knoxville MLS
Property tax history
-0.9%/yrLatest (2025): $784 · +45.7% YoY. Source: county tax records.
Cash-flow waterfall
monthlySold comps — $/sqft
last 12 mo · ≤1 miLoading sold comps…