 Duplex
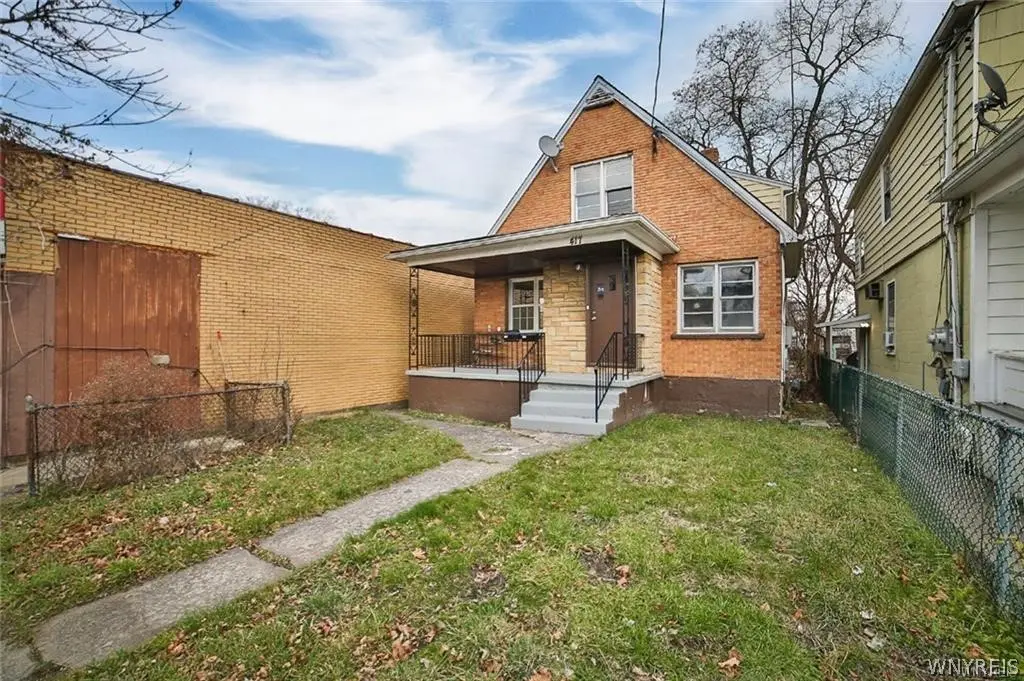
417 24th St · Niagara Falls, NY
Flood risk 1/10 · Minimal
- FEMA flood zone
- X (unshaded)
- Chance of flooding over 30 yrs
- 0.0%
- Est. flood insurance / yr
- $473 – $860
Fire risk 1/10 · Minimal
- Est. fire insurance / yr
- $691 – $1,283
Heat risk 2/10 · Minimal
- Hot days now (above 94°F)
- 7 days/yr
- Hot days in 30 yrs
- 15 days/yr
Wind risk 1/10 · Minimal
- Chance of severe wind over 30 yrs
- —
Air-quality risk 3/10 · Minor
- Unhealthy air days now
- 2 days/yr
- Unhealthy air days in 30 yrs
- 3 days/yr
Risk factors via First Street. Map © Google.
Why this score? — see what drove the C+ grade
The composite is a weighted blend of 9 inputs, each scored 0–100. Each bar is that input's sub-score; the figure is the points it added to the 100-point composite (weight × sub-score).
- Cash flow +30.0/30.0
- 1% rule +10.0/10.0
- DSCR +10.0/10.0
- Livability +3.0/5.0
- Rent growth +2.5/5.0
- Schools +2.5/10.0
- Condition / age +2.5/5.0
- Appreciation +2.3/10.0
- ARV discount +0.0/15.0
$119,999
🖨 Deal sheet 📄 Offer letter ✓ Due diligence
Multi-family units
County records classify this as Multi-Family (2-4 Unit). Listing-text estimate: 2 units. confirmed
Listing remarks
Welcome to this charming all-brick duplex, a fantastic opportunity for savvy investors seeking a lucrative rental property or first-time homebuyers looking for a cozy and affordable abode. Recently updated and meticulously maintained, this duplex offers comfortable living spaces and promising rental income potential. Nestled in a quiet and desirable neighborhood, this property boasts curb appeal with its classic all-brick exterior and well-manicured lawn. Each unit features its own private entrance, ensuring privacy and convenience for occupants. Step inside to discover newly updated interiors showcasing modern finishes and ample natural light. The spacious living areas provide plenty of ro
Key facts
- Well manicured lawn
- All brick duplex
- Updated interiors
Tags
Property features AI
Finance
- Other: Two-unit building with separate gas and electric meters (2 each)
- Financial info: Owner pays water; water included in rent; Operating expenses include water/sewer
Exterior
- Parking: No driveway; Off-site parking
- Utilities: Public water connected; Sewer connected
- Home design: Single-story building; Resale property
- Construction: Aluminum siding
- Exterior features: Near public transit; Rectangular residential lot; City street frontage
Interior
- Flooring: Hardwood; Varies
- Bathrooms: 2 full bathrooms
- Heating & cooling: Gas forced-air heating
- Interior features: Hardwood and varied flooring; Full basement
- Laundry & utility: Gas water heater
Neighborhood map
What this means for you Summary
Snapshot
- This is a 2 × 2-bed/1.0-bath units multifamily listed at $120k.
Deal economics
- At list price, monthly cash flow is $893 ($11k/yr) — positive. Per door: $446/mo.
- The deal already cash-flows at list — no discount required.
- Meets the 1% rule at list price ($2k rent vs $120k).
- Recommended offer: $118k (1.5% below list) — sets the bar for market timing.
- Cap rate 15.2% vs local median 7.7% in Niagara Falls — top-decile yield for the area; either an underpriced asset or a hidden risk that comps aren't pricing in. Stress-test before assuming the spread holds.
Location & tenants
- Location reads 60/100 on livability (#956 in NY) — a middle-class / working-renter tenant base. Strengths: cost of living A+, housing A+; Watch: schools F, crime F, amenities F.
- Niagara Falls City School District (urban): math 26% / reading 34% proficiency, ranked #578 of 590 in NY (top 98%) — families likely to look elsewhere, expect single-tenant / working-renter base with shorter leases; 66% free/reduced lunch — lower-income household profile, screen leases tightly.
- Market conditions: 74 active listings in the ZIP; 10 comparable units currently listed for rent nearby; rentals lingering (median 44d on market — plan ~5-8 weeks vacancy on turnover, expect pricing pressure); 50% of comp listings sitting > 30 days — soft ceiling on asking rent; 167 units permitted in Niagara County in 2024 (0 in 5+ unit buildings).
- At $2,444/mo this rent would consume 64% of the median local household income ($46k/yr) (locally 230% of renters already pay >50% of income on rent) — very limited rent-growth headroom before tenants either downsize or default.
Forward outlook
- Local home prices are declining (-3.0%/yr); year-one equity from $829 of loan paydown is wiped out by about $4k of value loss. Plan a longer hold.
- Niagara County population projected at -19% by 2050 — secular population decline; favor cash flow + early exit over multi-decade hold.
- At projected returns (-3.0% appreciation + 3.0% rent growth), your $34k cash investment doubles in ~4 years — after that, you're playing with house money.
Negotiation context
- It's been on market 29 days — a 2% lower offer ($118k) is reasonable based on typical stale-listing flexibility.
- 9 sale attempts since 8y ago with the ask held roughly flat each time — persistent listings suggest the price (not the market) is what's stuck; bring a comps-based counter.
- Current owner paid $53k; list at $120k implies a 126% gain — meaningful room to come down on a strong offer.
Risks & watch-outs
- Watch-outs: property tax is 3.6% of price; built in 1958 — expect roof / HVAC / electrical / plumbing capex.
Questions for the listing agent
- Can we see the unit-by-unit rent roll, current vacancy, and any below-market leases? What's the average tenancy length?
- What capital expenditures (roof, boiler, parking lot, exteriors) have been made in the last 5 years, and what's planned in the next 2?
- Built in 1958 — when were the roof, HVAC, electrical panel, plumbing, and water heater last replaced?
- Property tax is high relative to price — has the assessment been appealed recently, and will the sale trigger a re-assessment?
- Is there a deadline driving the sale (1031 exchange, divorce, estate, relocation)? That informs how much negotiation room exists.
- Schools are F-rated, which usually means shorter tenancies and higher turnover. Who's the typical renter profile here, and what's been the actual vacancy rate?
- Crime grade is F in this area — have there been break-ins, vandalism, or insurance claims at this property in the last 3 years? What carrier currently insures it and at what premium?
- What's the average days-on-market for RENTAL listings here right now (not sales)? A rising rental-DOM trend means longer vacancies and softer asking-rent achievability than the comps imply.
- What's the recent tenant-quality profile in this submarket — average credit score on applications, eviction rate, late-payment / NSF rate, and stable-employment percentage? A property-management company in the area should have these aggregated.
- How much new apartment / multifamily construction is in the pipeline within 1–3 miles? Heavy new supply (>2% of stock underway) typically softens rents 12–24 months out; light construction supports rent growth.
Investment metrics
- 1% rule
- 2.04% ✓
- Cap rate
- 15.22%
- Cash-on-cash
- 31.88%
- DSCR
- 2.42
- GRM
- 4.1
CMA / ARV
- ARV (on-the-fly)
- $98,560
- Comps found
- 12
Show comp detail 12 sales within ~0.75 mi
| Address | Dist | Beds/Ba | Sqft | Sold | Price | $/sf | Match |
|---|---|---|---|---|---|---|---|
| 614 20th St | 0.42mi | 4/2.0 (+1) | 1,570 (+2%) | 1mo | $100,000 | $64 | 71 |
| 443 21st St | 0.20mi | 3/2.0 | 1,428 (-7%) | 10mo | $65,000 | $46 | 70 |
| 555 25th St | 0.29mi | 4/2.0 (+1) | 1,619 (+5%) | 7mo | $128,000 | $79 | 67 |
| 2738 Welch Ave | 0.30mi | 3/2.0 | 1,621 (+5%) | 14mo | $141,110 | $87 | 66 |
| 420 18th St | 0.38mi | 4/2.5 (+1) | 1,632 (+6%) | 3mo | $115,000 | $70 | 63 |
| 1926 Welch Ave | 0.27mi | 3/2.0 | 1,690 (+10%) | 13mo | $65,000 | $38 | 61 |
| 2771 Livingston Ave | 0.33mi | 4/2.0 (+1) | 1,408 (-9%) | 7mo | $88,000 | $63 | 60 |
| 2421 Welch Ave | 0.11mi | 4/2.0 (+1) | 1,760 (+14%) | 11mo | $170,000 | $97 | 57 |
| 746 17th St | 0.68mi | 4/2.0 (+1) | 1,475 (-4%) | 1mo | $72,000 | $49 | 56 |
| 447 25th St | 0.10mi | 4/2.0 (+1) | 1,728 (+12%) | 19mo | $95,000 | $55 | 54 |
| 2405 Independence Ave | 0.54mi | 4/2.0 (+1) | 1,524 (-1%) | 18mo | $127,000 | $83 | 53 |
| 445 18th St | 0.36mi | 4/2.0 (+1) | 1,320 (-14%) | 15mo | $55,000 | $42 | 42 |
Match score weights: distance 35% · size 25% · config 20% · recency 20%. Top-matched comps best support the ARV.
Projected returns pro-forma
-3.0% appreciation · 3.0% rent growth · sell at horizon
- IRR
- 26.9%
- Equity multiple
- 2.12×
- Total profit
- $37,578
- Equity at exit
- $17,892
- IRR
- 34.5%
- Equity multiple
- 4.17×
- Total profit
- $106,606
- Equity at exit
- $10,375
Cash invested: $33,600 (down + closing). Projections, not guarantees.
Landlord ↔ Tenant lean methodology
- Overall (STATE)
- 15 Strongly Tenant-Friendly
- State New York
- 15 Strongly Tenant-Friendly · D+10
- County
- — inherits STATE
- City
- — inherits STATE
ZIP-level market 14303
- Home prices YoY
- -1.7%
- Active inventory
- 74
- Price-to-rent
- 8.2×
Monthly cashflow live
- Estimated rent
- $2,444 high interval (Pro) →
- Mortgage (P&I)
- −$629
- Tax from tax record
- −$359 /mo · $4,305/yr
- Insurance
- −$50
- HOA
- −$0
- Vacancy / Maint / Mgmt
- −$513
- Net cashflow
- $893
Break-even live
2-unit breakdown (identical units grouped — click to expand)
| Units | Beds | Baths | Est. rent |
|---|---|---|---|
| 2× units | 2 | 1 | $2,444 |
| #1 | 2 | 1 | $1,222 |
| #2 | 2 | 1 | $1,222 |
| Total (2 units) | $2,444 | ||
UW: 25.0% down · 7.5% · 30yr · 1.5% tax · 5.0% vac · 8.0% maint · 8.0% mgmt
Financing live
Cash to close
- Down payment
- $30,000
- Closing costs
- $3,600
- Reserves months
- —
- Total cash needed
- —
Loan-product check · same deal, 3 products live
Conventional
25% down · 7.5% · 30yr
- Down + closing
- —
- Monthly P&I
- —
- Monthly cashflow
- —
- DSCR
- —
- Eligible?
- —
Personal DTI + credit; lowest rate.
DSCR
20% down · 8.5% · 30yr
- Down + closing
- —
- Monthly P&I
- —
- Monthly cashflow
- —
- DSCR
- —
- Eligible?
- —
No personal income docs; deal must DSCR.
Hard money
10% down · 12.0% · 12mo
- Down + closing
- —
- Monthly P&I
- —
- Monthly cashflow
- —
- DSCR
- —
- Eligible?
- —
Short-term bridge; refi at stabilization.
Rent comps 10 comps
| Address | Beds | Baths | Sqft | Rent | $/sqft | DOM | Units | Dist |
|---|---|---|---|---|---|---|---|---|
| 420 25th St Niagara Falls, NY | 3.0 | 1.0 | 1101 | $1,500 | $1.36 | 43d | 1 | 0.06mi |
| 2420 Mackenna Ave Unit 1 Niagara Falls, NY | 4.0 | 1.0 | 1300 | $1,390 | $1.07 | 1d | 1 | 0.26mi |
| 1780 Falls St Niagara Falls, NY | 2.0 | 1.0 | 1100 | $1,200 | $1.09 | 43d | 1 | 0.34mi |
| 1427 Fort Ave Unit 2 Niagara Falls, NY | 3.0 | 1.0 | 1058 | $950 | $0.90 | 43d | 1 | 0.54mi |
| 2020 Forest Ave Niagara Falls, NY | 4.0 | 2.0 | 1600 | $1,500 | $0.94 | 16d | 1 | 0.66mi |
| 1001 17th St Niagara Falls, NY | 3.0 | 1.0 | 1152 | $1,800 | $1.56 | 23d | 1 | 0.77mi |
| 784 15th St Niagara Falls, NY | 3.0 | 1.5 | 1380 | $1,350 | $0.98 | 3d | 1 | 0.83mi |
| 1808 Whitney Ave Unit 3 Niagara Falls, NY | 2.0 | 1.0 | 1200 | $900 | $0.75 | 43d | 1 | 0.88mi |
| 724 Augustus Pl Niagara Falls, NY | 4.0 | 1.0 | 1200 | $1,500 | $1.25 | 43d | 1 | 1.09mi |
| 642 Ashland Ave Niagara Falls, NY | 3.0 | 1.0 | 1238 | $1,100 | $0.89 | 3d | 1 | 1.41mi |
Listing history 36 events
-
2026-06-18days on market $119,999 Active 29 DOM
-
2026-06-17days on market $119,999 Active 28 DOM
-
2026-06-16days on market $119,999 Active 27 DOM
-
2026-06-15days on market $119,999 Active 26 DOM
-
2026-06-13days on market $119,999 Active 24 DOM
-
2026-06-13days on market $119,999 Active 23 DOM
-
2026-06-10days on market $119,999 Active 21 DOM
-
2026-06-09days on market $119,999 Active 20 DOM
-
2026-06-08days on market $119,999 Active 19 DOM
-
2026-06-07days on market $119,999 Active 18 DOM
-
2026-06-03days on market $119,999 Active 14 DOM
-
2026-06-02days on market $119,999 Active 13 DOM
-
2026-06-01days on market $119,999 Active 12 DOM
-
2026-05-31days on market $119,999 Active 11 DOM
-
2026-05-20$119,999 Active
-
2025-11-29status Active
-
2025-09-11historical
-
2025-06-17status Pending
-
2025-06-03status Active
-
2025-06-02status Pending
-
2025-05-21$99,000 Active
-
2024-05-14status Pending
-
2024-05-14historical
-
2024-03-18$99,900 Active
-
2022-10-06historical
-
2022-09-12status Active
-
2022-09-08price $74,000
-
2022-09-08historical
-
2022-08-30$40,000 Active
-
2022-08-18historical
-
2022-08-02$40,000 Active
-
2018-12-31soldstatus $53,000
-
2018-03-22soldstatus $13,755 Closed Sale or Rented
-
2018-03-19soldstatus $14,000
-
2018-01-30status Pending Sale
-
2018-01-17$9,900 Active
ⓘ Source: listings_history table (triggers on properties + properties_extension) + one-shot
backfill from property_details.listing_events for pre-trigger history.
Tax reassessment forecast NY · Partial reset (capped growth)
- Current annual tax
- $4,305 · $359/mo
- Projected year-2 tax
- $4,305 · $359/mo
- Expected delta
- $0/yr ($0/mo · 0.0%)
ⓘ Screening estimate from a state-policy table — verify with the county assessor before closing.
Climate risk First Street
- Flood 1/10 Low FEMA zone X (unshaded) · 0% chance over 30 yrs
- Wildfire 1/10 Low
- Heat 2/10 Low 7 d/yr ≥94°F today · 15 d/yr by 30 yrs out
- Wind 1/10 Low
- Air quality 3/10 Moderate 2 unhealthy d/yr today · 3 by 30 yrs out
Nearby sold comps map
Loading sold comps map…
Walkable amenities ~0.75 mi
Loading nearby amenities…
Taxation est. · year 1
- Rental income
- $29,328
- − Mortgage interest
- −$6,722
- − Property taxes
- −$4,305
- − Insurance
- −$600
- − Repairs & maintenance
- −$2,346
- − Management
- −$2,346
- − Depreciation
- −$3,491
- Taxable income
- $9,518
- Est. tax owed @ 24.0%
- −$2,284
- After-tax cash flow
- $8,428/yr
For passive investors: Depreciation is non-cash, so a rental often shows a tax loss while cash-flowing — sheltering income. Rental losses are passive: they offset passive income freely, and up to $25,000/yr can offset ordinary (W-2) income if you actively participate and your MAGI is under $100k (phasing out to $0 by $150k); unused losses carry forward. On sale, claimed depreciation is recaptured at up to 25%, and gains may owe capital-gains tax (a 1031 exchange can defer both). Figures are a year-1 estimate at your 24.0% rate — not tax advice; consult a CPA.
Schools (NCES district)
- District
- Niagara Falls City School District
- NCES district ID
- 3620820
- Math proficiency
- 26% ▼ -10.00%
- Reading proficiency
- 34% ▲ 3.00%
- Median HH income
- $32,488
- Composite
- 24.5/100
- National rank
- #7655
- State rank
- #578 of 590 in NY
Livability — Niagara Falls
- Score
- 60/100
- State rank
- #956
- US rank
- #18749
Category grades
Schools grade is shown separately in the Schools card above.
Census & demographics
- Census place
- Niagara Falls, NY
- County
- Niagara County · 157,377 people
- City population
- 62,983
- Metro
- Buffalo-Cheektowaga, NY
- Population (ZIP)
- 6,156
- Household income
- $45,646
- Rent vs Own
- Severe rent burden
- 230.0
Population outlook (Niagara County) Hauer SSP2
- Today (2025)
- 204,149 people
- By 2030
- 197,900 · -3.1%
- By 2040
- 182,239 · -10.7%
- By 2050
- 165,198 · -19.1%
- By 2075
- 129,416 · -36.6%
- By 2100
- 96,222 · -52.9%
Race, ethnicity, and origin ACS 2023
- Neighborhood character
- Diverse neighborhood (Simpson 0.68)
- Race & ethnicity
- White 53% Two or more races 18% Hispanic / Latino 15% Black 12% Asian 4% Native American 1%
- Hispanic origin (detail)
- Mexican 6% Puerto Rican 6%
- Common ancestry
- Romanian 12% Lithuanian 2% Iranian 1%
- Foreign-born
- 3%
- Languages at home
- 93% English-only · Other Indo-European 3% Spanish 3% Russian/Polish/Slavic 1%
Political lean MEDSL · Niagara
- 2024 margin
- R (+14.9) · D 42.5% · R 57.5%
- 2008→2024 swing
- -15.9pp toward R · 2008: 1.0pp · 2024: -14.9pp
- All cycles
- 2024: R+14.9 2020: R+9.7 2016: R+19.0 2012: D+0.6 2008: D+1.0
Not yet ingested
- Civics
- —
Market trends
- HPI YoY
- ▼ -5.37%
- Current HPI
- 311.8094
- Rent YoY
- —
- Metro
- Buffalo-Cheektowaga, NY
- State GDP YoY
- ▲ 2.60%
- F500 in state
- 92
Industry mix (Fortune 500 HQ in NY)
| Industry | F500 HQs | Revenue |
|---|---|---|
| Financial Services | 10 | $950B |
|
||
| Consumer Goods | 9 | $162B |
|
||
| Insurance | 4 | $225B |
|
||
| Telecommunications | 2 | $144B |
|
||
| Pharmaceuticals | 2 | $112B |
|
||
| Media / Entertainment | 2 | $69B |
|
||
Price history
+1112.1% since first listed22 events — show timeline
- 2026-05-20 Listed $119,999 WNYREIS
- 2025-11-29 Relisted — WNYREIS
- 2025-09-11 Listing Removed — WNYREIS
- 2025-06-17 Pending — WNYREIS
- 2025-06-03 Relisted — WNYREIS
- 2025-06-02 Pending — WNYREIS
- 2025-05-21 Listed $99,000 WNYREIS
- 2024-05-14 Pending — WNYREIS
- 2024-05-14 Listing Removed — WNYREIS
- 2024-03-18 Listed $99,900 WNYREIS
- 2022-10-06 Listing Removed — WNYREIS
- 2022-09-12 Relisted — WNYREIS
- 2022-09-08 Listing Removed — WNYREIS
- 2022-09-08 Price Changed $74,000 WNYREIS
- 2022-08-30 Listed $40,000 WNYREIS
- 2022-08-18 Listing Removed — WNYREIS
- 2022-08-02 Listed $40,000 WNYREIS
- 2018-12-31 Sold (Public Records) $53,000 Public Records
- 2018-03-22 Sold (MLS) $13,755 WNYREIS
- 2018-03-19 Sold (Public Records) $14,000 Public Records
- 2018-01-30 Pending — WNYREIS
- 2018-01-17 Listed $9,900 WNYREIS
Property tax history
+15.3%/yrLatest (2025): $4,305 · +152.7% YoY. Source: county tax records.
Cash-flow waterfall
monthlySold comps — $/sqft
last 12 mo · ≤1 miLoading sold comps…