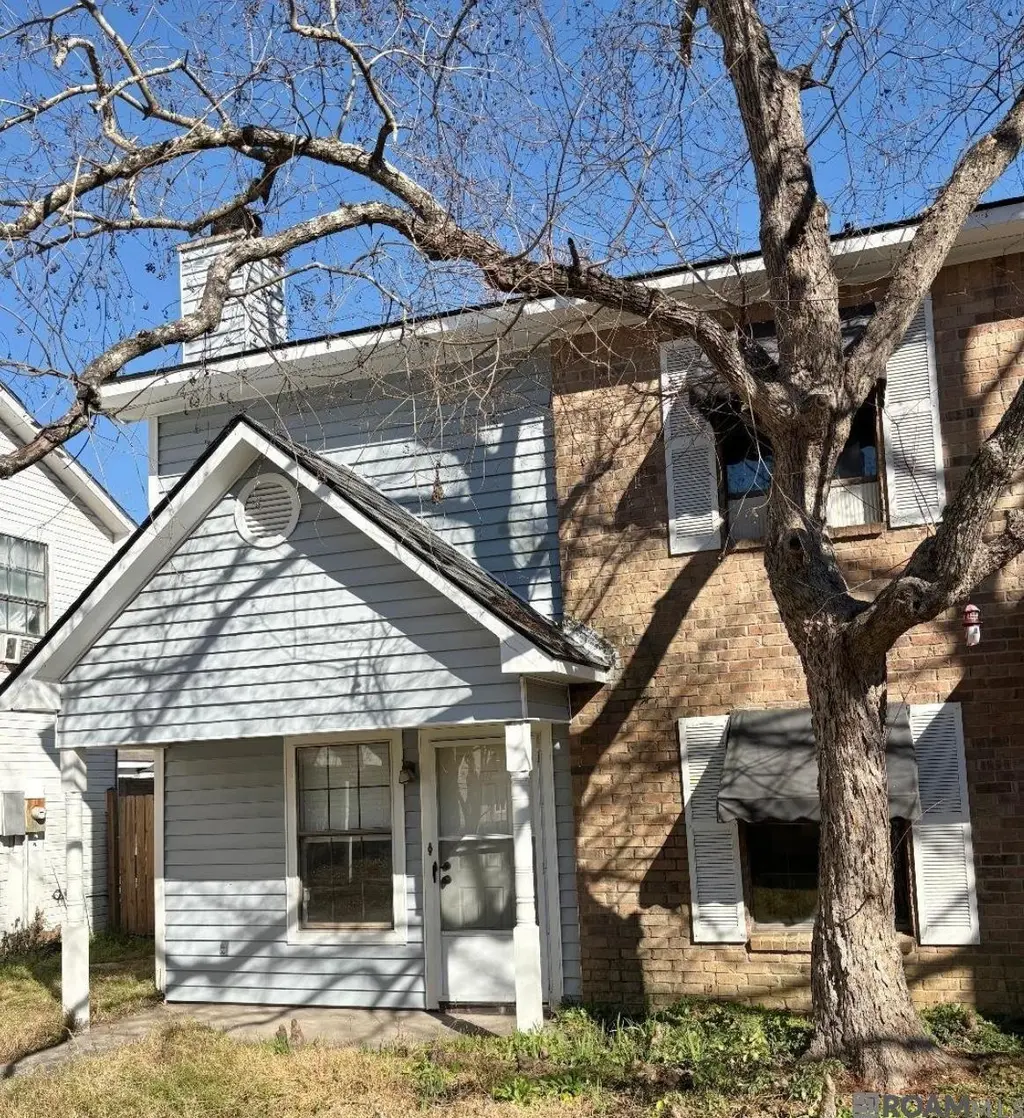
5212 Carnifix Ct · Shenandoah, LA
Flood risk 1/10 · Minimal
- FEMA flood zone
- X
- Chance of flooding over 30 yrs
- 0.0%
- Est. flood insurance / yr
- $507 – $1,088
Fire risk 1/10 · Minimal
- Est. fire insurance / yr
- $1,269 – $2,357
Heat risk 8/10 · Major
- Hot days now (above 108°F)
- 7 days/yr
- Hot days in 30 yrs
- 22 days/yr
Wind risk 9/10 · Severe
- Chance of severe wind over 30 yrs
- 99.0%
Air-quality risk 3/10 · Minor
- Unhealthy air days now
- 2 days/yr
- Unhealthy air days in 30 yrs
- 3 days/yr
Risk factors via First Street. Map © Google.
Why this score? — see what drove the C+ grade
The composite is a weighted blend of 9 inputs, each scored 0–100. Each bar is that input's sub-score; the figure is the points it added to the 100-point composite (weight × sub-score).
- Cash flow +22.3/30.0
- ARV discount +15.0/15.0
- DSCR +7.2/10.0
- 1% rule +5.3/10.0
- Livability +3.8/5.0
- Rent growth +3.0/5.0
- Condition / age +2.5/5.0
- Schools +2.4/10.0
- Appreciation +0.0/10.0
$165,000
🖨 Deal sheet (PDF) 📄 Offer letter ✓ Due diligence
Listing remarks MLS
Walking distance to Waffle House, Movie Theatre, Albertsons, Georges Restaurant, McDonalds. Perfect location near many stores.
Key facts
- 3,092 sq ft lot
- Garage
- Built 1984
Tags
Property features AI
Exterior
- Parking: Driveway; Garage with automatic door opener
- Utilities: Public water; Public sewer; Cable available
- Home design: Detached single-family residence; Updated/remodeled condition; 2 stories
- Construction: Vinyl siding; Shingle/composition roof; Slab foundation; Built as residential single-family
- Exterior features: Located on a cul-de-sac; Level topography; Sidewalks (community)
Interior
- Kitchen: Range; Oven; Electric cooktop; Dishwasher; Disposal
- Flooring: Laminate
- Bathrooms: 2 full bathrooms
- Heating & cooling: Central heating; Central air conditioning; Ceiling fans; Attic fan
- Interior features: Fireplace (1); Balcony
- Laundry & utility: Washer hookup
Neighborhood map
What this means for you Summary
Snapshot
- This is a 3-bed/2.0-bath single-family listed at $165k.
Deal economics
- At list price, monthly cash flow is $273 ($3k/yr) — positive.
- The deal already cash-flows at list — no discount required.
- Meets the 1% rule at list price ($2k rent vs $165k).
- Recommended offer: $160k (3.0% below list) — sets the bar for market timing.
- Cap rate 8.3% vs local median 3.9% in Shenandoah — top-decile yield for the area; either an underpriced asset or a hidden risk that comps aren't pricing in. Stress-test before assuming the spread holds.
Location & tenants
- Location reads 76/100 on livability (#16 in LA, #3,778 nationally) — a middle-class / working-renter tenant base. Strengths: employment A+, housing A+, health & safety A; Watch: amenities F, commute F.
- East Baton Rouge Parish (urban): math 22% / reading 34% proficiency, ranked #47 of 98 in LA (top 48%) — low school quality limits family demand, transient renter base, plan for 1-2y turnover; 77% free/reduced lunch — lower-income household profile, screen leases tightly.
- Zoned schools: Shenandoah Elementary School (math 52% / reading 55%, grade C, #100 of 646 statewide, top 16%, 703 students, 58% FRL); Woodlawn Middle School (math 20% / reading 39%, grade F, #116 of 218 statewide, top 53%, 887 students, 69% FRL); Woodlawn High School (math 25% / reading 30%, grade F, #133 of 265 statewide, top 51%, 1,527 students, 62% FRL).
- Market conditions: Rents rising (+2.0%/yr); 361 active listings in the ZIP; 27 comparable units currently listed for rent nearby; rentals at typical pace (median 25d on market — plan ~3-4 weeks tenant-placement turnaround); 41% of comp listings sitting > 30 days — soft ceiling on asking rent; solid renter incomes; 2,252 units permitted in East Baton Rouge Parish in 2024 (440 in 5+ unit buildings).
Forward outlook
- Local home prices are declining (-3.0%/yr); year-one equity from $1k of loan paydown is wiped out by about $5k of value loss. Plan a longer hold.
- East Baton Rouge County population projected at +4% by 2050 — modest demand growth; plan on rents tracking national, not racing it.
Negotiation context
- It's been on market 35 days — a 3% lower offer ($160k) is reasonable based on typical stale-listing flexibility.
- 4 sale attempts since 25y ago; this cycle's ask has dropped $10k (6%) from the opening price — seller is motivated, your offer sets the floor, not the list.
Risks & watch-outs
- Climate carrying-cost: severe wind risk, 99% chance of damaging wind over 30y; extreme-heat days projected 7→22/yr by 2055 (HVAC capex compounding) — expect insurance premiums to compound above CPI over the hold.
Questions for the listing agent
- It's been on market 35 days. Have you received any prior offers? Is the seller open to a 3% concession, seller financing, or rate buy-down credit?
- Is there a deadline driving the sale (1031 exchange, divorce, estate, relocation)? That informs how much negotiation room exists.
- What's the average days-on-market for RENTAL listings here right now (not sales)? A rising rental-DOM trend means longer vacancies and softer asking-rent achievability than the comps imply.
- What's the recent tenant-quality profile in this submarket — average credit score on applications, eviction rate, late-payment / NSF rate, and stable-employment percentage? A property-management company in the area should have these aggregated.
- How much new for-sale + rental construction is in the pipeline within 1–3 miles? Heavy new supply typically softens prices + rents 12–24 months out; constrained supply supports both.
Investment metrics
- 1% rule
- 1.03% ✓
- Cap rate
- 8.28%
- Cash-on-cash
- 7.08%
- DSCR
- 1.32
- GRM
- 8.1
CMA / ARV
- ARV (on-the-fly)
- $223,200
- Comps found
- 12
Show comp detail 12 sales within ~0.75 mi
| Address | Dist | Beds/Ba | Sqft | Sold | Price | $/sf | Match |
|---|---|---|---|---|---|---|---|
| 5212 Carnifix Ct | 0.00mi | 3/2.0 | 1,440 (0%) | 1mo | $165,000 | $115 | 99 |
| 5101 Paducah Ct | 0.07mi | 3/2.0 | 1,320 (-8%) | 4mo | $199,500 | $151 | 79 |
| 15725 Springwood Ave | 0.38mi | 3/2.0 | 1,411 (-2%) | 4mo | $219,000 | $155 | 76 |
| 5111 Paducah Ct | 0.06mi | 3/2.0 | 1,263 (-12%) | 5mo | $199,500 | $158 | 73 |
| 15588 Springwood Ave | 0.45mi | 3/2.0 | 1,490 (+4%) | 4mo | $195,000 | $131 | 70 |
| 15521 Summerwood Ave | 0.48mi | 2/2.0 (-1) | 1,410 (-2%) | 4mo | $225,000 | $160 | 66 |
| 15463 Springwood Ave | 0.53mi | 2/2.0 (-1) | 1,382 (-4%) | 4mo | $159,000 | $115 | 60 |
| 15465 Summerwood Ave | 0.50mi | 2/2.0 (-1) | 1,510 (+5%) | 4mo | $169,900 | $113 | 60 |
| 15443 Springwood Ave | 0.54mi | 3/2.0 | 1,348 (-6%) | 8mo | $219,000 | $162 | 57 |
| 15512 Summerwood Ave | 0.47mi | 2/2.0 (-1) | 1,354 (-6%) | 10mo | $189,000 | $140 | 55 |
| 3988 Meadow Ridge Dr | 0.46mi | 3/2.0 | 1,642 (+14%) | 2mo | $295,000 | $180 | 54 |
| 3978 Meadow Ridge Dr | 0.47mi | 3/2.0 | 1,615 (+12%) | 8mo | $279,900 | $173 | 51 |
Match score weights: distance 35% · size 25% · config 20% · recency 20%. Top-matched comps best support the ARV.
Projected returns pro-forma
-3.0% appreciation · 2.05% rent growth · sell at horizon
- IRR
- -6.5%
- Equity multiple
- 0.76×
- Total profit
- $-11,004
- Equity at exit
- $24,602
- IRR
- 2.0%
- Equity multiple
- 1.13×
- Total profit
- $6,219
- Equity at exit
- $14,266
Cash invested: $46,200 (down + closing). Projections, not guarantees.
Landlord ↔ Tenant lean methodology
- Overall (STATE)
- 90 Strongly Landlord-Friendly
- State Louisiana
- 90 Strongly Landlord-Friendly · R+12
- County
- — inherits STATE
- City
- — inherits STATE
ZIP-level market 70817
- Rents YoY
- 2.0%
- Active inventory
- 361
- Price-to-rent
- 8.1×
Monthly cashflow live
- Estimated rent
- $1,702 high interval (Pro) →
- Mortgage (P&I)
- −$865
- Tax from tax record
- −$138 /mo · $1,658/yr
- Insurance
- −$69
- HOA
- −$0
- Vacancy / Maint / Mgmt
- −$357
- Net cashflow
- $273
Break-even live
Sensitivity live
| Price | -10% $366 | -5% $319 | +0% $273 | +5% $226 | +10% $179 |
|---|---|---|---|---|---|
| Rent | -10% $138 | -5% $205 | +0% $273 | +5% $340 | +10% $407 |
| Rate | -1.0pp $356 | -0.5pp $315 | base $273 | +0.5pp $230 | +1.0pp $186 |
UW: 25.0% down · 7.5% · 30yr · 1.5% tax · 5.0% vac · 8.0% maint · 8.0% mgmt
Financing live
Cash to close
- Down payment
- $41,250
- Closing costs
- $4,950
- Reserves months
- —
- Total cash needed
- —
Loan-product check · same deal, 3 products live
Conventional
25% down · 7.5% · 30yr
- Down + closing
- —
- Monthly P&I
- —
- Monthly cashflow
- —
- DSCR
- —
- Eligible?
- —
Personal DTI + credit; lowest rate.
DSCR
20% down · 8.5% · 30yr
- Down + closing
- —
- Monthly P&I
- —
- Monthly cashflow
- —
- DSCR
- —
- Eligible?
- —
No personal income docs; deal must DSCR.
Hard money
10% down · 12.0% · 12mo
- Down + closing
- —
- Monthly P&I
- —
- Monthly cashflow
- —
- DSCR
- —
- Eligible?
- —
Short-term bridge; refi at stabilization.
Rent comps 27 comps
| Address | Beds | Baths | Sqft | Rent | $/sqft | DOM | Units | Dist |
|---|---|---|---|---|---|---|---|---|
| 5213 Berryville Ct Baton Rouge, LA | 3.0 | 2.0 | 1237 | $1,750 | $1.41 | 16d | 1 | 0.08mi |
| 4810 Kennesaw Dr Unit 4810-C Baton Rouge, LA | 3.0 | 2.0 | 1275 | $1,100 | $0.86 | 45d | 1 | 0.17mi |
| 16534 George Oneal Rd Apt C Baton Rouge, LA | 2.0 | 1.5 | 900 | $950 | $1.06 | 25d | 1 | 0.24mi |
| 5157 Cumberland Cove Dr Baton Rouge, LA | 3.0 | 2.0 | 1159 | $1,650 | $1.42 | 16d | 1 | 0.27mi |
| 4844 Mokki Ln Baton Rouge, LA | 3.0 | 2.0 | 1440 | $1,690 | $1.17 | 45d | 1 | 0.37mi |
| 4804 Mokki Ln Baton Rouge, LA | 3.0 | 2.0 | 1440 | $1,875 | $1.30 | 22d | 1 | 0.38mi |
| 15580 George Oneal Rd Baton Rouge, LA | 1.0–3.0 | 1.0–2.0 | 1063 | $1,510 | $1.42 | 16d | 8 | 0.40mi |
| 15444 Summerwood Ave Baton Rouge, LA | 2.0 | 2.0 | 1323 | $1,650 | $1.25 | 25d | 1 | 0.51mi |
| 5714 Ardmore Dr Baton Rouge, LA | 3.0 | 2.0 | 1700 | $1,700 | $1.00 | 16d | 1 | 0.59mi |
| 6410 Roux Dr Baton Rouge, LA | 3.0 | 2.5 | 1827 | $2,125 | $1.16 | 45d | 1 | 0.89mi |
| 15513 Fields Creek Ave Baton Rouge, LA | 3.0 | 2.0 | 1595 | $2,295 | $1.44 | 25d | 1 | 0.98mi |
| 4719 Mendocino Way Baton Rouge, LA | 4.0 | 2.0 | 1704 | $2,200 | $1.29 | 16d | 1 | 0.99mi |
| 3482 King Bradford Dr Baton Rouge, LA | 2.0 | 2.0 | 980 | $1,100 | $1.12 | 25d | 1 | 1.01mi |
| 15959 Tiger Bend Rd Baton Rouge, LA | 1.0–2.0 | 1.0–1.5 | 934 | $1,265 | $1.35 | 16d | 3 | 1.04mi |
| 17235 Terrance Ave Baton Rouge, LA | 3.0 | 2.0 | 1256 | $1,590 | $1.27 | 16d | 1 | 1.06mi |
| 14142 Watercrest Ln Baton Rouge, LA | 3.0 | 3.0 | 1875 | $2,300 | $1.23 | 16d | 1 | 1.09mi |
| 3412 Yorkfield Dr Baton Rouge, LA | 2.0 | 1.5 | 1128 | $950 | $0.84 | 45d | 1 | 1.13mi |
| 3412 Yorkfield Dr Unit D Baton Rouge, LA | 2.0 | 1.5 | 1010 | $900 | $0.89 | 25d | 1 | 1.13mi |
| 3412 Yorkfield Dr Unit D Baton Rouge, LA | 2.0 | 1.5 | 1010 | $1,000 | $0.99 | 45d | 1 | 1.13mi |
| 13675 Coursey Blvd Baton Rouge, LA | 1.0–3.0 | 1.0–2.0 | 951 | $1,300 | $1.37 | 45d | 23 | 1.27mi |
| 16625 Poe Ave Baton Rouge, LA | 3.0–5.0 | 2.0–3.0 | 1763 | $1,995 | $1.13 | 16d | 6 | 1.30mi |
| 16625 Poe Ave Baton Rouge, LA | 3.0–5.0 | 2.0–3.0 | 1698 | $1,895 | $1.12 | 46d | 1 | 1.30mi |
| 5113 Sandy Ridge Dr Baton Rouge, LA | 3.0 | 2.0 | 1812 | $1,695 | $0.94 | 22d | 1 | 1.32mi |
| 2931 Niccoline Way Baton Rouge, LA | 3.0 | 2.0 | 1436 | $2,000 | $1.39 | 45d | 1 | 1.34mi |
| 16218 Thorncrown Ln Baton Rouge, LA | 2.0 | 2.0 | 1383 | $1,800 | $1.30 | 46d | 1 | 1.36mi |
| 2989 O'Neal Ln Unit 2989 Baton Rouge, LA | 2.0 | 1.5 | 1073 | $900 | $0.84 | 45d | 1 | 1.36mi |
| 7004 Spring Gardens Dr Baton Rouge, LA | 3.0 | 2.0 | 1630 | $2,000 | $1.23 | 45d | 1 | 1.40mi |
Listing history 8 events
-
2026-04-21status Pending 126-char remark
Show marketing remark (126 chars)
Walking distance to Waffle House, Movie Theatre, Albertsons, Georges Restaurant, McDonalds. Perfect location near many stores.
-
2026-04-21status Pending
Show marketing remark (126 chars)
Walking distance to Waffle House, Movie Theatre, Albertsons, Georges Restaurant, McDonalds. Perfect location near many stores.
-
2026-04-01price $165,000 126-char remark
Show marketing remark (126 chars)
Walking distance to Waffle House, Movie Theatre, Albertsons, Georges Restaurant, McDonalds. Perfect location near many stores.
-
2026-04-01price $165,000
Show marketing remark (126 chars)
Walking distance to Waffle House, Movie Theatre, Albertsons, Georges Restaurant, McDonalds. Perfect location near many stores.
-
2026-03-11$175,000 Active 126-char remark
Show marketing remark (126 chars)
Walking distance to Waffle House, Movie Theatre, Albertsons, Georges Restaurant, McDonalds. Perfect location near many stores.
-
2026-03-11$175,000 Active
Show marketing remark (126 chars)
Walking distance to Waffle House, Movie Theatre, Albertsons, Georges Restaurant, McDonalds. Perfect location near many stores.
-
2002-03-28$91,500
-
2001-08-31$91,900
ⓘ Source: listings_history table (triggers on properties + properties_extension) + one-shot
backfill from property_details.listing_events for pre-trigger history.
Tax reassessment forecast LA · Resets to sale price
- Current annual tax
- $1,658 · $138/mo
- Projected year-2 tax
- $1,658 · $138/mo
- Expected delta
- $0/yr ($0/mo · 0.0%)
ⓘ Screening estimate from a state-policy table — verify with the county assessor before closing.
Climate risk First Street
- Flood 1/10 Low FEMA zone X · 0% chance over 30 yrs
- Wildfire 1/10 Low
- Heat 8/10 Severe 7 d/yr ≥108°F today · 22 d/yr by 30 yrs out
- Wind 9/10 Extreme 99% chance of damaging wind over 30 yrs
- Air quality 3/10 Moderate 2 unhealthy d/yr today · 3 by 30 yrs out
Nearby sold comps map
Loading sold comps map…
Walkable amenities ~0.75 mi
Loading nearby amenities…
Taxation est. · year 1
- Rental income
- $20,428
- − Mortgage interest
- −$9,243
- − Property taxes
- −$1,658
- − Insurance
- −$825
- − Repairs & maintenance
- −$1,634
- − Management
- −$1,634
- − Depreciation
- −$4,800
- Taxable income
- $633
- Est. tax owed @ 24.0%
- −$152
- After-tax cash flow
- $3,119/yr
For passive investors: Depreciation is non-cash, so a rental often shows a tax loss while cash-flowing — sheltering income. Rental losses are passive: they offset passive income freely, and up to $25,000/yr can offset ordinary (W-2) income if you actively participate and your MAGI is under $100k (phasing out to $0 by $150k); unused losses carry forward. On sale, claimed depreciation is recaptured at up to 25%, and gains may owe capital-gains tax (a 1031 exchange can defer both). Figures are a year-1 estimate at your 24.0% rate — not tax advice; consult a CPA.
Schools (NCES district)
- District
- East Baton Rouge Parish
- NCES district ID
- 2200540
- Math proficiency
- 22% ▼ -36.00%
- Reading proficiency
- 34% ▼ -31.00%
- Median HH income
- $46,263
- Composite
- 24.14/100
- National rank
- #7745
- State rank
- #47 of 98 in LA
Livability — Shenandoah
- Score
- 76/100
- State rank
- #16
- US rank
- #3778
Category grades
Schools grade is shown separately in the Schools card above.
Census & demographics
- Census place
- Shenandoah, LA
- County
- East Baton Rouge Parish · 399,686 people
- Metro
- Baton Rouge, LA
- Population (ZIP)
- 33,482
- Household income
- $102,639
- Rent vs Own
- Severe rent burden
- 755.0
Population outlook (East Baton Rouge County) Hauer SSP2
- Today (2025)
- 464,810 people
- By 2030
- 472,137 · +1.6%
- By 2040
- 480,243 · +3.3%
- By 2050
- 484,422 · +4.2%
- By 2075
- 492,069 · +5.9%
- By 2100
- 476,347 · +2.5%
Race, ethnicity, and origin ACS 2023
- Neighborhood character
- Majority White (64%)
- Race & ethnicity
- White 64% Black 21% Two or more races 9% Hispanic / Latino 5% Asian 3%
- Common ancestry
- Lithuanian 13% Italian 2% Serbian 2%
- Foreign-born
- 6% · Canada, Vietnam, China
- Languages at home
- 91% English-only · Spanish 3% Arabic 1% Vietnamese 1%
Political lean MEDSL · East Baton Rouge
- 2024 margin
- D (+11.1) · D 54.5% · R 43.4% · Other 2.1%
- 2008→2024 swing
- +8.9pp toward D · 2008: 2.2pp · 2024: 11.1pp
- All cycles
- 2024: D+11.1 2020: D+13.1 2016: D+9.2 2012: D+5.2 2008: D+2.2
Not yet ingested
- Civics
- —
Market trends
- HPI YoY
- ▼ -149.27%
- Current HPI
- 170.6826
- Rent YoY
- ▲ 2.05%
- Metro
- Baton Rouge, LA
- State GDP YoY
- ▲ 3.29%
- F500 in state
- 10
Industry mix (Fortune 500 HQ in LA)
| Industry | F500 HQs | Revenue |
|---|---|---|
| Telecommunications | 2 | $23B |
|
||
| Utilities | 1 | $12B |
|
||
| Wholesale / Distribution | 1 | $5B |
|
||
| Advertising | 1 | $2B |
|
||
Price history
+79.5% since first listed8 events — show timeline
- 2026-04-21 Pending — AcadianaMLS
- 2026-04-21 Pending — GBRMLS
- 2026-04-01 Price Changed $165,000 AcadianaMLS
- 2026-04-01 Price Changed $165,000 GBRMLS
- 2026-03-11 Listed $175,000 GBRMLS
- 2026-03-11 Listed $175,000 AcadianaMLS
- 2002-03-28 Listed $91,500 AcadianaMLS
- 2001-08-31 Listed $91,900 AcadianaMLS
Property tax history
+2.2%/yrLatest (2025): $1,658 · -0.5% YoY. Source: county tax records.
Cash-flow waterfall
monthlySold comps — $/sqft
last 12 mo · ≤1 miLoading sold comps…