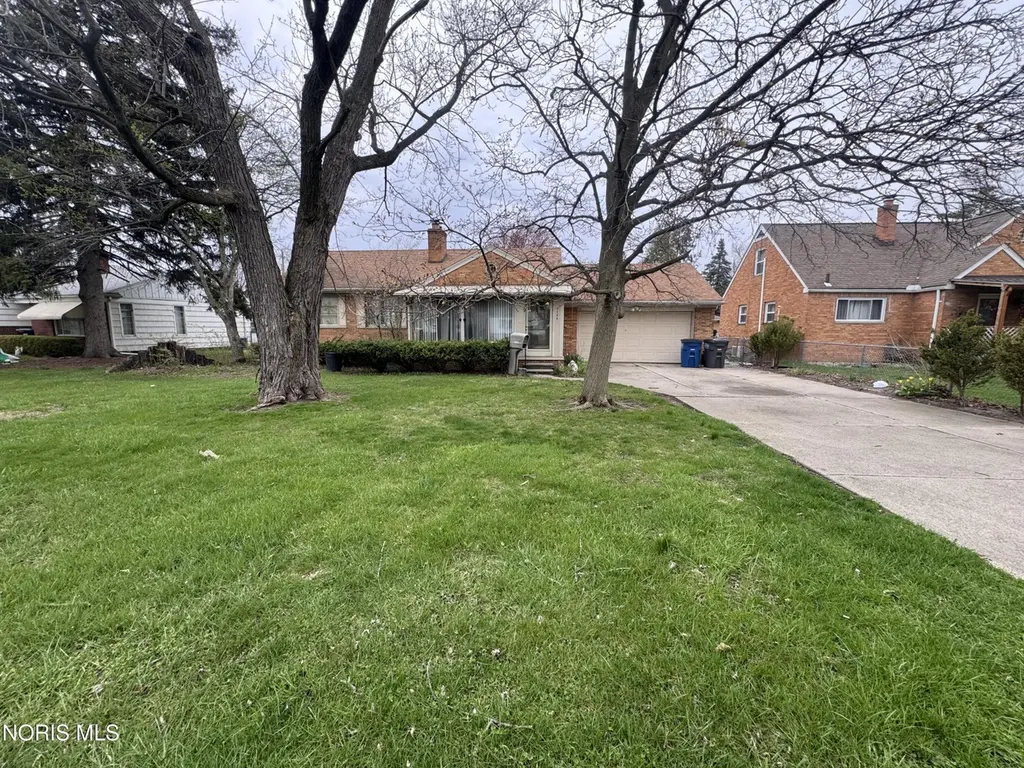
3260 Glencairn Ave · Toledo, OH
Flood risk 1/10 · Minimal
- FEMA flood zone
- X (unshaded)
- Chance of flooding over 30 yrs
- 0.0%
- Est. flood insurance / yr
- $473 – $860
Fire risk 1/10 · Minimal
- Est. fire insurance / yr
- $713 – $1,323
Heat risk 3/10 · Minor
- Hot days now (above 100°F)
- 7 days/yr
- Hot days in 30 yrs
- 16 days/yr
Wind risk 2/10 · Minimal
- Chance of severe wind over 30 yrs
- —
Air-quality risk 2/10 · Minimal
- Unhealthy air days now
- 1 days/yr
- Unhealthy air days in 30 yrs
- 2 days/yr
Risk factors via First Street. Map © Google.
Why this score? — see what drove the B- grade
The composite is a weighted blend of 9 inputs, each scored 0–100. Each bar is that input's sub-score; the figure is the points it added to the 100-point composite (weight × sub-score).
- Cash flow +27.3/30.0
- DSCR +9.5/10.0
- 1% rule +8.8/10.0
- ARV discount +7.5/15.0
- Rent growth +4.5/5.0
- Livability +3.3/5.0
- Condition / age +2.5/5.0
- Schools +1.6/10.0
- Appreciation +0.0/10.0
$79,000
🖨 Deal sheet (PDF) 📄 Offer letter ✓ Due diligence
Listing remarks MLS
Charming 3-bedroom brick ranch located in a highly desirable neighborhood and top-rated school district! This home offers a great opportunity for homeowners or investors alike, with a functional layout and solid construction. Conveniently situated near parks, schools, and a variety of restaurants, making everyday living easy and enjoyable. This property will be sold at a Minimum Bid Auction of just $79,000 on Monday, May 18th at 4 PM. Preview and registration will begin at 3 PM. Interior photos coming soon—don't miss your chance to bid on this fantastic opportunity!
Key facts
- 9,300 sq ft lot
- 2 garage spots
- Built 1955
Neighborhood map
What this means for you Summary
Snapshot
- This is a 2-bed/1.0-bath single-family listed at $79k.
Deal economics
- At list price, monthly cash flow is $230 ($3k/yr) — positive.
- The deal already cash-flows at list — no discount required.
- Meets the 1% rule at list price ($1k rent vs $79k).
- Recommended offer: $77k (3.0% below list) — sets the bar for market timing.
- Cap rate 9.8% vs local median 7.7% in Toledo — meaningfully above typical; check what's discounted (condition, days-on-market, listing class) to confirm the premium yield is real.
Location & tenants
- Location reads 66/100 on livability (#645 in OH) — a middle-class / working-renter tenant base. Strengths: cost of living A+, housing A+, health & safety A+; Watch: amenities C-, crime F, commute F.
- Toledo City (urban): math 15% / reading 24% proficiency, ranked #634 of 656 in OH (top 97%) — low school quality limits family demand, transient renter base, plan for 1-2y turnover; 72% free/reduced lunch — lower-income household profile, screen leases tightly.
- Zoned schools: Grove Patterson Academy Elementary School (math 47% / reading 66%, grade C+, #761 of 1,584 statewide, top 48%, 403 students, 38% FRL); Bowsher High School (math 23% / reading 45%, grade F, #596 of 781 statewide, top 76%, 1,240 students, 49% FRL) — zoned schools average 44% FRL vs 72% district-wide (28 pts lower); this property's tenant base skews higher-income than the district average.
- Zoned-school proficiency averages 45% at this address vs 20% district-wide (+26 pts) — the actual schools serving this property are materially stronger than the Toledo City average implies; a family-tenant draw the district grade alone would hide.
- Market conditions: Rents rising fast (+8.0%/yr); 70 active listings in the ZIP; 21 comparable units currently listed for rent nearby; rentals at typical pace (median 25d on market — plan ~3-4 weeks tenant-placement turnaround); 415 units permitted in Lucas County in 2024 (122 in 5+ unit buildings).
Forward outlook
- Local home prices are declining (-3.0%/yr); year-one equity from $546 of loan paydown is wiped out by about $2k of value loss. Plan a longer hold.
- Lucas County population projected at -16% by 2050 — secular population decline; favor cash flow + early exit over multi-decade hold.
- At projected returns (-3.0% appreciation + 8.0% rent growth), your $22k cash investment doubles in ~7 years — after that, you're playing with house money.
Negotiation context
- It's been on market 41 days — a 3% lower offer ($77k) is reasonable based on typical stale-listing flexibility.
- 4 sale attempts since 19y ago with the ask held roughly flat each time — persistent listings suggest the price (not the market) is what's stuck; bring a comps-based counter.
Risks & watch-outs
- Watch-outs: property tax is 2.8% of price; built in 1955 — expect roof / HVAC / electrical / plumbing capex.
Questions for the listing agent
- It's been on market 41 days. Have you received any prior offers? Is the seller open to a 3% concession, seller financing, or rate buy-down credit?
- Built in 1955 — when were the roof, HVAC, electrical panel, plumbing, and water heater last replaced?
- Property tax is high relative to price — has the assessment been appealed recently, and will the sale trigger a re-assessment?
- Is there a deadline driving the sale (1031 exchange, divorce, estate, relocation)? That informs how much negotiation room exists.
- Schools are D-rated, which usually means shorter tenancies and higher turnover. Who's the typical renter profile here, and what's been the actual vacancy rate?
- Crime grade is F in this area — have there been break-ins, vandalism, or insurance claims at this property in the last 3 years? What carrier currently insures it and at what premium?
- What's the average days-on-market for RENTAL listings here right now (not sales)? A rising rental-DOM trend means longer vacancies and softer asking-rent achievability than the comps imply.
- What's the recent tenant-quality profile in this submarket — average credit score on applications, eviction rate, late-payment / NSF rate, and stable-employment percentage? A property-management company in the area should have these aggregated.
- How much new for-sale + rental construction is in the pipeline within 1–3 miles? Heavy new supply typically softens prices + rents 12–24 months out; constrained supply supports both.
Investment metrics
- 1% rule
- 1.38% ✓
- Cap rate
- 9.78%
- Cash-on-cash
- 12.45%
- DSCR
- 1.55
- GRM
- 6.1
CMA / ARV
- ARV (median comp)
- $177,283
- List price
- $79,000
- Delta
- -55.44%
- Verdict
- UNDERPRICED
- Comps
- 20 within 1.0 mi
Show comp detail 12 sales within ~0.75 mi
| Address | Dist | Beds/Ba | Sqft | Sold | Price | $/sf | Match |
|---|---|---|---|---|---|---|---|
| 3013 Glencairn Ave | 0.36mi | 3/1.0 (+1) | 1,080 (+1%) | 4mo | $180,000 | $167 | 74 |
| 3133 Strathmoor Ave | 0.19mi | 3/1.0 (+1) | 1,158 (+8%) | 1mo | $186,000 | $161 | 72 |
| 3121 Daleford Dr | 0.53mi | 3/1.5 (+1) | 1,076 (+0%) | 2mo | $153,500 | $143 | 66 |
| 1829 Meadowlark Ave | 0.57mi | 3/1.5 (+1) | 1,058 (-1%) | 1mo | $175,900 | $166 | 63 |
| 1926 Meadowlark Ave | 0.51mi | 3/2.0 (+1) | 1,091 (+2%) | 2mo | $234,900 | $215 | 63 |
| 3018 Cragmoor Ave | 0.47mi | 2/1.0 | 1,163 (+9%) | 2mo | $145,000 | $125 | 62 |
| 3037 Maeterlinck Ave | 0.28mi | 3/2.0 (+1) | 1,170 (+9%) | 1mo | $164,900 | $141 | 62 |
| 1814 Meadowlark Ave | 0.56mi | 2/1.0 | 1,009 (-6%) | 3mo | $155,000 | $154 | 62 |
| 1621 Colleen Ct | 0.52mi | 3/1.5 (+1) | 1,008 (-6%) | 1mo | $188,000 | $187 | 58 |
| 1896 Wilshire Ave | 0.28mi | 3/2.0 (+1) | 1,207 (+13%) | 4mo | $146,500 | $121 | 54 |
| 3905 Chipplegate Rd | 0.56mi | 3/1.0 (+1) | 1,180 (+10%) | 4mo | $164,900 | $140 | 49 |
| 2944 Daleford Dr | 0.61mi | 3/1.5 (+1) | 1,204 (+12%) | 3mo | $232,500 | $193 | 41 |
Match score weights: distance 35% · size 25% · config 20% · recency 20%. Top-matched comps best support the ARV.
Projected returns pro-forma
-3.0% appreciation · 8.0% rent growth · sell at horizon
- IRR
- 8.3%
- Equity multiple
- 1.35×
- Total profit
- $7,637
- Equity at exit
- $11,779
- IRR
- 21.8%
- Equity multiple
- 3.35×
- Total profit
- $51,922
- Equity at exit
- $6,830
Cash invested: $22,120 (down + closing). Projections, not guarantees.
Landlord ↔ Tenant lean methodology
- Overall (STATE)
- 73 Landlord-Friendly
- State Ohio
- 73 Landlord-Friendly · R+6
- County
- — inherits STATE
- City
- — inherits STATE
ZIP-level market 43614
- Home prices YoY
- -22.4%
- Rents YoY
- 8.0%
- Active inventory
- 70
- Price-to-rent
- 6.1×
Monthly cashflow live
- Estimated rent
- $1,088 high interval (Pro) →
- Mortgage (P&I)
- −$414
- Tax from tax record
- −$183 /mo · $2,193/yr
- Insurance
- −$33
- HOA
- −$0
- Vacancy / Maint / Mgmt
- −$228
- Net cashflow
- $230
Break-even live
Sensitivity live
| Price | -10% $274 | -5% $252 | +0% $230 | +5% $207 | +10% $185 |
|---|---|---|---|---|---|
| Rent | -10% $144 | -5% $187 | +0% $230 | +5% $273 | +10% $316 |
| Rate | -1.0pp $269 | -0.5pp $250 | base $230 | +0.5pp $209 | +1.0pp $188 |
UW: 25.0% down · 7.5% · 30yr · 1.5% tax · 5.0% vac · 8.0% maint · 8.0% mgmt
Financing live
Cash to close
- Down payment
- $19,750
- Closing costs
- $2,370
- Reserves months
- —
- Total cash needed
- —
Loan-product check · same deal, 3 products live
Conventional
25% down · 7.5% · 30yr
- Down + closing
- —
- Monthly P&I
- —
- Monthly cashflow
- —
- DSCR
- —
- Eligible?
- —
Personal DTI + credit; lowest rate.
DSCR
20% down · 8.5% · 30yr
- Down + closing
- —
- Monthly P&I
- —
- Monthly cashflow
- —
- DSCR
- —
- Eligible?
- —
No personal income docs; deal must DSCR.
Hard money
10% down · 12.0% · 12mo
- Down + closing
- —
- Monthly P&I
- —
- Monthly cashflow
- —
- DSCR
- —
- Eligible?
- —
Short-term bridge; refi at stabilization.
Rent comps 21 comps
| Address | Beds | Baths | Sqft | Rent | $/sqft | DOM | Units | Dist |
|---|---|---|---|---|---|---|---|---|
| 3165 Glanzman Rd Toledo, OH | 1.0–2.0 | 1.0 | 658 | $799 | $1.21 | 45d | 1 | 0.18mi |
| 3042 Cragmoor Ave Toledo, OH | 3.0 | 1.0 | 1250 | $1,800 | $1.44 | 45d | 1 | 0.41mi |
| 3025 S Byrne Rd Unit 1 Toledo, OH | 3.0 | 1.0 | 1064 | $1,095 | $1.03 | 22d | 1 | 0.70mi |
| 1223 Oak Hill Ct Toledo, OH | 1.0–2.0 | 1.0 | 800 | $989 | $1.24 | 15d | 1 | 0.78mi |
| 1255 S Byrne Rd Toledo, OH | 1.0–3.0 | 1.0–2.0 | 1080 | $1,264 | $1.17 | 15d | 1 | 1.03mi |
| 3313 Arlington Ave Toledo, OH | 1.0–2.0 | 1.0 | 778 | $900 | $1.16 | 15d | 8 | 1.05mi |
| 3348 Arlington Ave Apt 10 Toledo, OH | 2.0 | 1.0 | 900 | $795 | $0.88 | 45d | 1 | 1.11mi |
| 3320 Arlington Ave Apt 2 Toledo, OH | 2.0 | 1.0 | 850 | $795 | $0.94 | 25d | 1 | 1.13mi |
| 3310 Arlington Ave Unit 8 Toledo, OH | 2.0 | 1.0 | 850 | $850 | $1.00 | 15d | 1 | 1.14mi |
| 3310 Arlington Ave Unit 4 Toledo, OH | 2.0 | 1.0 | 850 | $795 | $0.94 | 45d | 1 | 1.14mi |
| 1510 Watova Rd Toledo, OH | 3.0 | 1.0 | 1197 | $1,495 | $1.25 | 22d | 1 | 1.23mi |
| 2222 Sherwood Ave Toledo, OH | 2.0 | 1.0 | 800 | $850 | $1.06 | 45d | 1 | 1.26mi |
| 2647 Eastgate Rd Toledo, OH | 1.0–2.0 | 1.0 | 722 | $1,209 | $1.67 | 25d | 1 | 1.27mi |
| 1027 Valley Side Dr Maumee, OH | 2.0 | 1.5 | 1260 | $1,495 | $1.19 | 25d | 1 | 1.29mi |
| 1408 Brookview Dr Toledo, OH | 1.0–2.0 | 1.0 | 592 | $850 | $1.43 | 15d | 12 | 1.32mi |
| 1010 Valley Side Dr Unit 1010 Maumee, OH | 2.0 | 1.5 | 1260 | $1,395 | $1.11 | 15d | 1 | 1.32mi |
| 1330 Brookview Dr Toledo, OH | 2.0 | 1.0 | 800 | $850 | $1.06 | 45d | 1 | 1.36mi |
| 1302 Brookview Dr Toledo, OH | 1.0–2.0 | 1.0 | 710 | $959 | $1.35 | 45d | 1 | 1.38mi |
| 916 S Byrne Rd Toledo, OH | 2.0 | 1.0 | 900 | $899 | $1.00 | 22d | 1 | 1.39mi |
| 3406 Gibraltar Heights Dr Toledo, OH | 2.0 | 1.0–2.0 | 678 | $919 | $1.35 | 15d | 14 | 1.40mi |
| 3349 Airport Hwy Toledo, OH | 1.0–2.0 | 1.0 | 791 | $885 | $1.12 | 45d | 1 | 1.46mi |
Listing history 7 events
-
2026-04-08$79,000 Active 578-char remark
Show marketing remark (578 chars)
Charming 3-bedroom brick ranch located in a highly desirable neighborhood and top-rated school district! This home offers a great opportunity for homeowners or investors alike, with a functional layout and solid construction. Conveniently situated near parks, schools, and a variety of restaurants, making everyday living easy and enjoyable. This property will be sold at a Minimum Bid Auction of just $79,000 on Monday, May 18th at 4 PM. Preview and registration will begin at 3 PM. Interior photos coming soon—don't miss your chance to bid on this fantastic opportunity!
-
2009-01-29historical
-
2008-10-06$109,900
-
2008-07-17historical
-
2007-11-03$135,000
-
2007-09-13historical
-
2007-03-13$149,900
ⓘ Source: listings_history table (triggers on properties + properties_extension) + one-shot
backfill from property_details.listing_events for pre-trigger history.
Tax reassessment forecast OH · Partial reset (capped growth)
- Current annual tax
- $2,193 · $183/mo
- Projected year-2 tax
- $2,193 · $183/mo
- Expected delta
- $0/yr ($0/mo · 0.0%)
ⓘ Screening estimate from a state-policy table — verify with the county assessor before closing.
Climate risk First Street
- Flood 1/10 Low FEMA zone X (unshaded) · 0% chance over 30 yrs
- Wildfire 1/10 Low
- Heat 3/10 Moderate 7 d/yr ≥100°F today · 16 d/yr by 30 yrs out
- Wind 2/10 Low
- Air quality 2/10 Low 1 unhealthy d/yr today · 2 by 30 yrs out
Nearby sold comps map
Loading sold comps map…
Walkable amenities ~0.75 mi
Loading nearby amenities…
Taxation est. · year 1
- Rental income
- $13,056
- − Mortgage interest
- −$4,425
- − Property taxes
- −$2,193
- − Insurance
- −$395
- − Repairs & maintenance
- −$1,044
- − Management
- −$1,044
- − Depreciation
- −$2,298
- Taxable income
- $1,656
- Est. tax owed @ 24.0%
- −$397
- After-tax cash flow
- $2,357/yr
For passive investors: Depreciation is non-cash, so a rental often shows a tax loss while cash-flowing — sheltering income. Rental losses are passive: they offset passive income freely, and up to $25,000/yr can offset ordinary (W-2) income if you actively participate and your MAGI is under $100k (phasing out to $0 by $150k); unused losses carry forward. On sale, claimed depreciation is recaptured at up to 25%, and gains may owe capital-gains tax (a 1031 exchange can defer both). Figures are a year-1 estimate at your 24.0% rate — not tax advice; consult a CPA.
Schools (NCES district)
- District
- Toledo City
- NCES district ID
- 3904490
- Math proficiency
- 15% ▼ -16.00%
- Reading proficiency
- 24% ▼ -13.00%
- Median HH income
- $32,137
- Composite
- 15.76/100
- National rank
- #9276
- State rank
- #634 of 656 in OH
Livability — Toledo
- Score
- 66/100
- State rank
- #645
- US rank
- #11442
Category grades
Schools grade is shown separately in the Schools card above.
Census & demographics
- Census place
- Toledo, OH
- County
- Lucas County · 380,724 people
- City population
- 280,811
- Metro
- Toledo, OH
- Population (ZIP)
- 29,075
- Household income
- $58,961
- Rent vs Own
- Severe rent burden
- 1407.0
Population outlook (Lucas County) Hauer SSP2
- Today (2025)
- 420,751 people
- By 2030
- 410,187 · -2.5%
- By 2040
- 384,019 · -8.7%
- By 2050
- 355,125 · -15.6%
- By 2075
- 291,683 · -30.7%
- By 2100
- 233,670 · -44.5%
Race, ethnicity, and origin ACS 2023
- Neighborhood character
- Predominantly White (67%)
- Race & ethnicity
- White 67% Black 21% Hispanic / Latino 7% Two or more races 4% Asian 2%
- Hispanic origin (detail)
- Mexican 6% Puerto Rican 1%
- Common ancestry
- Romanian 8% Italian 5% Lithuanian 3%
- Foreign-born
- 3% · Canada
- Languages at home
- 96% English-only · Other Indo-European 1% Spanish 1%
Political lean MEDSL · Lucas
- 2024 margin
- D (+12.6) · D 55.8% · R 43.2%
- 2008→2024 swing
- -18.9pp toward R · 2008: 31.4pp · 2024: 12.6pp
- All cycles
- 2024: D+12.6 2020: D+16.8 2016: D+17.4 2012: D+30.4 2008: D+31.4
Not yet ingested
- Civics
- —
Market trends
- HPI YoY
- ▼ -61.96%
- Current HPI
- 214.7031
- Rent YoY
- ▲ 8.03%
- Metro
- Toledo, OH
- State GDP YoY
- ▲ 1.98%
- F500 in state
- 48
Industry mix (Fortune 500 HQ in OH)
| Industry | F500 HQs | Revenue |
|---|---|---|
| Insurance | 3 | $145B |
|
||
| Industrial Machinery | 3 | $49B |
|
||
| Financial Services | 3 | $24B |
|
||
| Consumer Goods | 2 | $93B |
|
||
| Aerospace / Defense | 2 | $47B |
|
||
| Utilities | 2 | $33B |
|
||
Price history
-47.3% since first listed7 events — show timeline
- 2026-04-08 Listed $79,000 NORIS
- 2009-01-29 Listing Removed — NORIS
- 2008-10-06 Listed $109,900 NORIS
- 2008-07-17 Listing Removed — NORIS
- 2007-11-03 Listed $135,000 NORIS
- 2007-09-13 Listing Removed — NORIS
- 2007-03-13 Listed $149,900 NORIS
Property tax history
+2.9%/yrLatest (2025): $2,193 · -1.6% YoY. Source: county tax records.
Cash-flow waterfall
monthlySold comps — $/sqft
last 12 mo · ≤1 miLoading sold comps…