345 Joel Blvd #110 · Lehigh Acres, FL
Flood risk 1/10 · Minimal
- FEMA flood zone
- X (unshaded)
- Chance of flooding over 30 yrs
- 0.0%
- Est. flood insurance / yr
- $507 – $1,088
Fire risk 1/10 · Minimal
- Est. fire insurance / yr
- $947 – $1,759
Heat risk 10/10 · Severe
- Hot days now (above 108°F)
- 7 days/yr
- Hot days in 30 yrs
- 28 days/yr
Wind risk 10/10 · Severe
- Chance of severe wind over 30 yrs
- 99.0%
Air-quality risk 2/10 · Minimal
- Unhealthy air days now
- 1 days/yr
- Unhealthy air days in 30 yrs
- 2 days/yr
Risk factors via First Street. Map © Google.
Why this score? — see what drove the C grade
The composite is a weighted blend of 9 inputs, each scored 0–100. Each bar is that input's sub-score; the figure is the points it added to the 100-point composite (weight × sub-score).
- Cash flow +22.0/30.0
- 1% rule +10.0/10.0
- ARV discount +7.5/15.0
- DSCR +7.0/10.0
- Schools +4.1/10.0
- Livability +3.0/5.0
- Condition / age +2.5/5.0
- Rent growth +2.3/5.0
- Appreciation +0.0/10.0
$85,000
🖨 Deal sheet (PDF) 📄 Offer letter ✓ Due diligence
Listing remarks
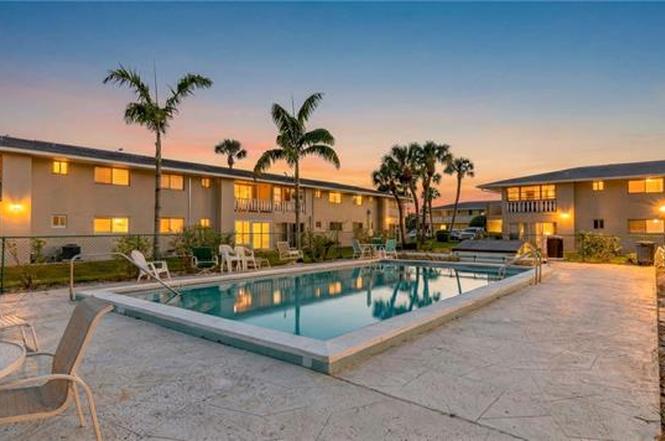
Welcome to 345 Joel Blvd #110 — the hidden gem you’ve been waiting for. This 2-bedroom, 2-bath garden condo in the Fairways I delivers the perfect blend of privacy, value, and views, all wrapped into one unbeatable winter retreat. As a corner unit, this home is filled with natural light and offers peaceful golf course views that instantly set the tone for relaxed Florida living. Whether you’re sipping coffee in the morning or unwinding after a day on the greens, the scenery never gets old. What truly sets this condo apart? It’s one of the most affordable seasonal getaways you’ll find, paired with some of the lowest HOA fees in the area—a rare combination
Key facts
- Low hoa fees
- Flood zone x
- Corner unit
Tags
Property features AI
Finance
- Other: One unit per floor; 1 floor in building; 130 units in complex; 8 units in building; Subdivision number 25, unit/lot 110
- Financial info: Information not provided
- HOA & community: Mandatory HOA; Monthly HOA fee of $302; Annual recurring HOA fees total $3,624; One-time fees $100; HOA maintains cable, laundry facilities, recreation facilities, repairs, and security; Community amenities include BBQ/picnic area, common laundry, and community pool; Professional management
Exterior
- Parking: Information not provided
- Security: Security maintenance included in HOA
- Utilities: Central water; Central sewer; Cable available; Electric service for HVAC (central electric)
- Home design: Residential low-rise (1-3 stories); Corner garden apartment; Rear exposure facing northwest; Non-gated community (Fairways Condo)
- Construction: Concrete block construction; Stucco exterior finish; Shingle roof; Built in 1970; Single-hung windows; Deeded property restrictions
- Exterior features: Courtyard; Patio; Golf course view
Interior
- Kitchen: Cooktop (electric); Dishwasher; Garbage disposal; Microwave; Refrigerator/freezer; Self-cleaning oven; Pantry; Eat-in kitchen
- Bedrooms: 2 bedrooms; Master bedroom on ground level; Split bedroom floor plan
- Flooring: Tile
- Bathrooms: 2 full bathrooms; Master bath with shower only
- Heating & cooling: Central electric heat; Central electric cooling
- Interior features: Cable prewire; High-speed internet available; Smoke detectors; Pantry; Eat-in kitchen; Florida room; Furnished
- Laundry & utility: Common laundry (HOA provided)
Neighborhood map
What this means for you Summary
Snapshot
- This is a 2-bed/2.0-bath condo listed at $85k.
Deal economics
- At list price, monthly cash flow is $136 ($2k/yr) — positive.
- The deal already cash-flows at list — no discount required.
- Meets the 1% rule at list price ($1k rent vs $85k).
- Recommended offer: $75k (12.0% below list) — sets the bar for market timing.
- Cap rate 8.2% vs local median 4.7% in Lehigh Acres — top-decile yield for the area; either an underpriced asset or a hidden risk that comps aren't pricing in. Stress-test before assuming the spread holds.
Location & tenants
- Location reads 59/100 on livability (#826 in FL) — a working-class tenant base; expect higher turnover. Strengths: cost of living A+, housing A+; Watch: crime C-, employment D+, amenities F.
- Lee (suburban): math 47% / reading 50% proficiency, ranked #42 of 73 in FL (top 58%) — families likely to look elsewhere, expect single-tenant / working-renter base with shorter leases.
- Zoned schools: Veterans Park Academy For The Arts (math 41% / reading 45%, grade F, #1,366 of 2,144 statewide, top 64%, 2,133 students, 36% FRL); Oak Hammock Middle School (math 43% / reading 41%, grade D-, #340 of 571 statewide, top 61%, 1,563 students, 56% FRL); Lehigh Senior High School (math 23% / reading 45%, grade F, #394 of 667 statewide, top 60%, 2,476 students, 57% FRL).
- Market conditions: Rents soft (-0.8%/yr); 644 active listings in the ZIP; 9 comparable units currently listed for rent nearby; rentals at typical pace (median 25d on market — plan ~3-4 weeks tenant-placement turnaround); 15,411 units permitted in Lee County in 2024 (4,686 in 5+ unit buildings).
- This rent runs 31% of the median local income ($51k/yr) — at the standard rent-burdened threshold; future hikes will face affordability resistance.
Forward outlook
- Local home prices are declining (-3.0%/yr); year-one equity from $588 of loan paydown is wiped out by about $3k of value loss. Plan a longer hold.
- Lee County population projected at +44% by 2050 — long-run rental-demand tailwind backs the buy-and-hold thesis.
Negotiation context
- It's been on market 180 days — a 12% lower offer ($75k) is reasonable based on typical stale-listing flexibility.
- Current owner paid $59k; 44% above their basis — modest negotiation headroom, anchor on the comps not their cost.
Risks & watch-outs
- Watch-outs: HOA is 23% of rent.
- Climate carrying-cost: severe wind risk, 99% chance of damaging wind over 30y; extreme-heat days projected 7→28/yr by 2055 (HVAC capex compounding) — expect insurance premiums to compound above CPI over the hold.
Questions for the listing agent
- It's been on market 180 days. Have you received any prior offers? Is the seller open to a 12% concession, seller financing, or rate buy-down credit?
- Built in 1970 — when were the roof, HVAC, electrical panel, plumbing, and water heater last replaced?
- What does the HOA fee cover, when was the last increase, and are there any pending special assessments or reserve-fund shortfalls?
- Any open or pending special assessments — roof, HVAC, plumbing, elevator, façade? What's the per-unit balance and payoff schedule, and is the seller paying it off at close or rolling it to the buyer?
- Why hasn't it sold? Are there any deal-killer items the seller is aware of (foundation, flood, title, zoning, code violations)?
- Is there a deadline driving the sale (1031 exchange, divorce, estate, relocation)? That informs how much negotiation room exists.
- Schools are D-rated, which usually means shorter tenancies and higher turnover. Who's the typical renter profile here, and what's been the actual vacancy rate?
- What's the average days-on-market for RENTAL listings here right now (not sales)? A rising rental-DOM trend means longer vacancies and softer asking-rent achievability than the comps imply.
- What's the recent tenant-quality profile in this submarket — average credit score on applications, eviction rate, late-payment / NSF rate, and stable-employment percentage? A property-management company in the area should have these aggregated.
- How much new apartment / multifamily construction is in the pipeline within 1–3 miles? Heavy new supply (>2% of stock underway) typically softens rents 12–24 months out; light construction supports rent growth.
Investment metrics
- 1% rule
- 1.55% ✓
- Cap rate
- 8.21%
- Cash-on-cash
- 6.84%
- DSCR
- 1.30
- GRM
- 5.4
CMA / ARV
No comps found within radius.
Projected returns pro-forma
-3.0% appreciation · 0.0% rent growth · sell at horizon
- IRR
- -10.6%
- Equity multiple
- 0.63×
- Total profit
- $-8,782
- Equity at exit
- $12,674
- IRR
- -8.9%
- Equity multiple
- 0.56×
- Total profit
- $-10,588
- Equity at exit
- $7,349
Cash invested: $23,800 (down + closing). Projections, not guarantees.
Landlord ↔ Tenant lean methodology
- Overall (STATE)
- 87 Strongly Landlord-Friendly
- State Florida
- 87 Strongly Landlord-Friendly · R+3
- County
- — inherits STATE
- City
- — inherits STATE
ZIP-level market 33936
- Home prices YoY
- -19.9%
- Rents YoY
- -0.8%
- Active inventory
- 644
- Price-to-rent
- 5.4×
Monthly cashflow live
- Estimated rent
- $1,320 high interval (Pro) →
- Mortgage (P&I)
- −$446
- Tax from tax record
- −$124 /mo · $1,486/yr
- Insurance
- −$35
- HOA
- −$302
- Vacancy / Maint / Mgmt
- −$277
- Net cashflow
- $136
Break-even live
Sensitivity live
| Price | -10% $184 | -5% $160 | +0% $136 | +5% $112 | +10% $88 |
|---|---|---|---|---|---|
| Rent | -10% $31 | -5% $84 | +0% $136 | +5% $188 | +10% $240 |
| Rate | -1.0pp $179 | -0.5pp $157 | base $136 | +0.5pp $114 | +1.0pp $91 |
UW: 25.0% down · 7.5% · 30yr · 1.5% tax · 5.0% vac · 8.0% maint · 8.0% mgmt
Financing live
Cash to close
- Down payment
- $21,250
- Closing costs
- $2,550
- Reserves months
- —
- Total cash needed
- —
Loan-product check · same deal, 3 products live
Conventional
25% down · 7.5% · 30yr
- Down + closing
- —
- Monthly P&I
- —
- Monthly cashflow
- —
- DSCR
- —
- Eligible?
- —
Personal DTI + credit; lowest rate.
DSCR
20% down · 8.5% · 30yr
- Down + closing
- —
- Monthly P&I
- —
- Monthly cashflow
- —
- DSCR
- —
- Eligible?
- —
No personal income docs; deal must DSCR.
Hard money
10% down · 12.0% · 12mo
- Down + closing
- —
- Monthly P&I
- —
- Monthly cashflow
- —
- DSCR
- —
- Eligible?
- —
Short-term bridge; refi at stabilization.
Rent comps 9 comps
| Address | Beds | Baths | Sqft | Rent | $/sqft | DOM | Units | Dist |
|---|---|---|---|---|---|---|---|---|
| 343 Joel Blvd #111 Lehigh Acres, FL | 2.0 | 2.0 | 921 | $900 | $0.98 | 25d | 1 | 0.04mi |
| 333 Joel Blvd Lehigh Acres, FL | 2.0 | 1.0–2.0 | 877 | $1,048 | $1.19 | 17d | 2 | 0.13mi |
| 2201 E 5th St #23 Lehigh Acres, FL | 2.0 | 2.0 | 1011 | $1,300 | $1.29 | 5d | 1 | 0.23mi |
| 321 Dania St Lehigh Acres, FL | 2.0 | 2.0 | 915 | $1,800 | $1.97 | 25d | 1 | 0.36mi |
| 2213 Gardenia Way Lehigh Acres, FL | 2.0 | 1.5 | 900 | $1,740 | $1.93 | 25d | 1 | 0.38mi |
| 198 Joel Blvd #6 Lehigh Acres, FL | 2.0 | 2.0 | 1036 | $1,200 | $1.16 | 4d | 1 | 0.67mi |
| 347 Richland Rd Lehigh Acres, FL | 2.0 | 2.0 | 1040 | $1,150 | $1.11 | 25d | 1 | 0.96mi |
| 732 Joel Blvd Lehigh Acres, FL | 2.0 | 2.0 | 788 | $1,200 | $1.52 | 25d | 1 | 1.02mi |
| 738 Joel Blvd Lehigh Acres, FL | 2.0 | 2.0 | 968 | $1,050 | $1.08 | 25d | 1 | 1.02mi |
HOA detail condo
- Monthly dues
- $302 · $3,624/yr
- Assessments
- None detected in remarks — confirm with the listing agent.
Listing history 17 events
-
2026-06-22pricedays on market $85,000 Active 180 DOM
-
2026-06-17days on market $95,000 Active 176 DOM
-
2026-06-16days on market $95,000 Active 175 DOM
-
2026-06-15days on market $95,000 Active 174 DOM
-
2026-06-13days on market $95,000 Active 172 DOM
-
2026-06-10days on market $95,000 Active 169 DOM
-
2026-06-09days on market $95,000 Active 168 DOM
-
2026-06-07days on market $95,000 Active 166 DOM
-
2026-06-02days on market $95,000 Active 161 DOM
-
2026-06-01days on market $95,000 Active 160 DOM
-
2026-06-01days on market $95,000 Active 159 DOM
-
2026-04-15price $95,000
-
2026-02-05price $110,000
-
2025-12-23$122,000 Active
-
2019-12-23soldstatus $59,000
-
1995-10-19soldstatus $39,500
-
1995-06-26soldstatus $24,000
ⓘ Source: listings_history table (triggers on properties + properties_extension) + one-shot
backfill from property_details.listing_events for pre-trigger history.
Tax reassessment forecast FL · Resets to sale price
- Current annual tax
- $1,486 · $124/mo
- Projected year-2 tax
- $1,486 · $124/mo
- Expected delta
- $0/yr ($0/mo · 0.0%)
ⓘ Screening estimate from a state-policy table — verify with the county assessor before closing.
Climate risk First Street
- Flood 1/10 Low FEMA zone X (unshaded) · 0% chance over 30 yrs
- Wildfire 1/10 Low
- Heat 10/10 Extreme 7 d/yr ≥108°F today · 28 d/yr by 30 yrs out
- Wind 10/10 Extreme 99% chance of damaging wind over 30 yrs
- Air quality 2/10 Low 1 unhealthy d/yr today · 2 by 30 yrs out
Nearby sold comps map
Loading sold comps map…
Walkable amenities ~0.75 mi
Loading nearby amenities…
Taxation est. · year 1
- Rental income
- $15,839
- − Mortgage interest
- −$4,761
- − Property taxes
- −$1,486
- − Insurance
- −$425
- − Repairs & maintenance
- −$1,267
- − Management
- −$1,267
- − HOA
- −$3,624
- − Depreciation
- −$2,473
- Taxable income
- $535
- Est. tax owed @ 24.0%
- −$128
- After-tax cash flow
- $1,500/yr
For passive investors: Depreciation is non-cash, so a rental often shows a tax loss while cash-flowing — sheltering income. Rental losses are passive: they offset passive income freely, and up to $25,000/yr can offset ordinary (W-2) income if you actively participate and your MAGI is under $100k (phasing out to $0 by $150k); unused losses carry forward. On sale, claimed depreciation is recaptured at up to 25%, and gains may owe capital-gains tax (a 1031 exchange can defer both). Figures are a year-1 estimate at your 24.0% rate — not tax advice; consult a CPA.
Schools (NCES district)
- District
- Lee
- NCES district ID
- 1201080
- Math proficiency
- 47% ▼ -11.00%
- Reading proficiency
- 50% ▼ -4.00%
- Median HH income
- $49,518
- Composite
- 41.49/100
- National rank
- #3458
- State rank
- #42 of 73 in FL
Livability — Lehigh Acres
- Score
- 59/100
- State rank
- #826
- US rank
- #20055
Category grades
Schools grade is shown separately in the Schools card above.
Census & demographics
- Census place
- Lehigh Acres, FL
- County
- Lee County · 788,662 people
- City population
- 130,638
- Metro
- Cape Coral-Fort Myers, FL
- Population (ZIP)
- 27,967
- Household income
- $51,417
- Rent vs Own
- Severe rent burden
- 1027.0
Population outlook (Lee County) Hauer SSP2
- Today (2025)
- 871,946 people
- By 2030
- 955,468 · +9.6%
- By 2040
- 1,113,587 · +27.7%
- By 2050
- 1,256,891 · +44.1%
- By 2075
- 1,560,270 · +78.9%
- By 2100
- 1,726,848 · +98.0%
Race, ethnicity, and origin ACS 2023
- Neighborhood character
- Diverse neighborhood (Simpson 0.63)
- Race & ethnicity
- Hispanic / Latino 44% White 41% Two or more races 21% Black 9% Asian 1%
- Hispanic origin (detail)
- Mexican 7% Puerto Rican 9% Cuban 18% Dominican 2%
- Common ancestry
- Hispanic 3% Romanian 2% Lithuanian 1%
- Foreign-born
- 28% · Canada, Jamaica
- Languages at home
- 59% English-only · Spanish 36% French/Haitian/Cajun 3% Tagalog/Filipino 1%
Political lean MEDSL · Lee
- 2024 margin
- Strong R (+28.4) · D 35.5% · R 63.9%
- 2008→2024 swing
- -18.0pp toward R · 2008: -10.4pp · 2024: -28.4pp
- All cycles
- 2024: R+28.4 2020: R+19.2 2016: R+20.4 2012: R+16.6 2008: R+10.4
Not yet ingested
- Civics
- —
Market trends
- HPI YoY
- ▼ -86.78%
- Current HPI
- 348.8631
- Rent YoY
- ▼ -0.77%
- Metro
- Cape Coral-Fort Myers, FL
- State GDP YoY
- ▲ 3.28%
- F500 in state
- 36
Industry mix (Fortune 500 HQ in FL)
| Industry | F500 HQs | Revenue |
|---|---|---|
| Industrial Technology | 2 | $29B |
|
||
| Insurance | 2 | $17B |
|
||
| Retail | 1 | $60B |
|
||
| Technology Distribution | 1 | $58B |
|
||
| Homebuilding | 1 | $35B |
|
||
| Technology Manufacturing | 1 | $35B |
|
||
Price history
+295.8% since first listed6 events — show timeline
- 2026-04-15 Price Changed $95,000 NAPLESMLS
- 2026-02-05 Price Changed $110,000 NAPLESMLS
- 2025-12-23 Listed $122,000 NAPLESMLS
- 2019-12-23 Sold (Public Records) $59,000 Public Records
- 1995-10-19 Sold (Public Records) $39,500 Public Records
- 1995-06-26 Sold (Public Records) $24,000 Public Records
Property tax history
+11.2%/yrLatest (2025): $1,486 · +10.8% YoY. Source: county tax records.
Cash-flow waterfall
monthlySold comps — $/sqft
last 12 mo · ≤1 miLoading sold comps…