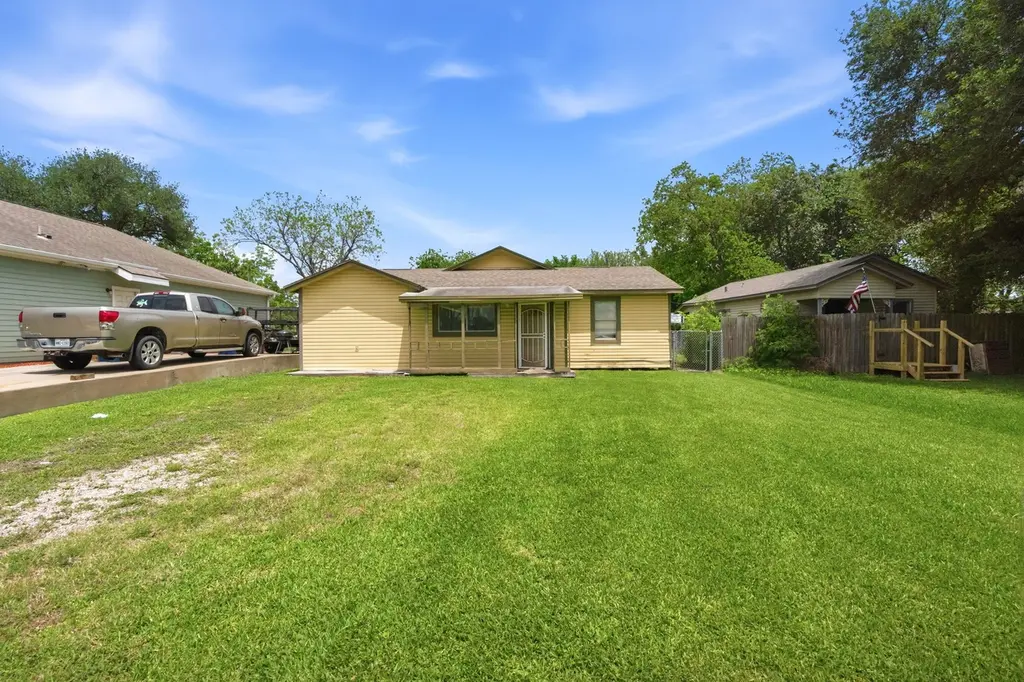
2326 12th Ave N · Texas City, TX
Flood risk 8/10 · Major
- FEMA flood zone
- X
- Chance of flooding over 30 yrs
- 0.6%
- Est. flood insurance / yr
- $507 – $1,088
Fire risk 1/10 · Minimal
- Est. fire insurance / yr
- $1,222 – $2,270
Heat risk 10/10 · Severe
- Hot days now (above 108°F)
- 7 days/yr
- Hot days in 30 yrs
- 27 days/yr
Wind risk 9/10 · Severe
- Chance of severe wind over 30 yrs
- 99.0%
Air-quality risk 2/10 · Minimal
- Unhealthy air days now
- 2 days/yr
- Unhealthy air days in 30 yrs
- 2 days/yr
Risk factors via First Street. Map © Google.
Why this score? — see what drove the B- grade
The composite is a weighted blend of 9 inputs, each scored 0–100. Each bar is that input's sub-score; the figure is the points it added to the 100-point composite (weight × sub-score).
- Cash flow +30.0/30.0
- 1% rule +10.0/10.0
- DSCR +10.0/10.0
- ARV discount +7.5/15.0
- Rent growth +3.7/5.0
- Livability +3.1/5.0
- Condition / age +2.5/5.0
- Schools +2.4/10.0
- Appreciation +0.0/10.0
$109,900
🖨 Deal sheet 📄 Offer letter ✓ Due diligence
Listing remarks
Investor special in the heart of Texas City! This as-is property at 2326 12th Ave N offers incredible potential for investors, flippers, or buyers looking to add their personal touch. Situated on a spacious lot, this home features a functional layout with plenty of opportunity to renovate and increase value. Conveniently located near schools, shopping, dining, and major highways, this property is ideal for a rental portfolio or starter renovation project. With strong upside potential and room to customize, this is a great opportunity to bring your vision to life.
Key facts
- Room to customize
- Spacious lot
- Functional layout
Tags
Property features AI
Finance
- Other: Building area approximately 1,764
- Financial info: Lease not considered
- HOA & community: Not specified
Exterior
- Parking: Not specified
- Security: Not specified
- Utilities: Public water; Public sewer
- Home design: Residential property; Built in 1950; Single-story (stories not explicitly specified); Pier/pillar/post foundation
- Construction: Vinyl siding and wood siding; Composition roof
- Exterior features: Located in a subdivision
Interior
- Kitchen: Not specified
- Bedrooms: Not specified
- Flooring: Not specified
- Bathrooms: 2 full bathrooms
- Heating & cooling: Not specified
- Interior features: 5 total rooms
- Laundry & utility: Not specified
Neighborhood map
What this means for you Summary
Snapshot
- This is a 5-bed/2.0-bath single-family listed at $110k.
Deal economics
- At list price, monthly cash flow is $2k ($22k/yr) — positive.
- The deal already cash-flows at list — no discount required.
- Meets the 1% rule at list price ($3k rent vs $110k).
- Cap rate 27.4% vs local median 4.3% in Texas City — top-decile yield for the area; either an underpriced asset or a hidden risk that comps aren't pricing in. Stress-test before assuming the spread holds.
Location & tenants
- Location reads 62/100 on livability (#907 in TX) — a middle-class / working-renter tenant base. Strengths: cost of living A+, housing A+; Watch: crime D+, amenities F, commute F.
- Texas City ISD (suburban): math 28% / reading 29% proficiency, ranked #655 of 826 in TX (top 79%) — low school quality limits family demand, transient renter base, plan for 1-2y turnover; 66% free/reduced lunch — lower-income household profile, screen leases tightly.
- Zoned schools: Blocker Middle (math 33% / reading 36%, grade F, #858 of 1,662 statewide, top 54%, 865 students, 80% FRL); Texas City H S (math 32% / reading 36%, grade F, #1,002 of 1,632 statewide, top 62%, 1,718 students, 72% FRL).
- Market conditions: Rents rising fast (+4.9%/yr); 292 active listings in the ZIP; 2 comparable units currently listed for rent nearby; 3,258 units permitted in Galveston County in 2024 (0 in 5+ unit buildings).
- At $3,456/mo this rent would consume 63% of the median local household income ($66k/yr) (locally 1821% of renters already pay >50% of income on rent) — very limited rent-growth headroom before tenants either downsize or default.
Forward outlook
- Local home prices are declining (-3.0%/yr); year-one equity from $760 of loan paydown is wiped out by about $3k of value loss. Plan a longer hold.
- Galveston County population projected at +43% by 2050 — long-run rental-demand tailwind backs the buy-and-hold thesis.
- At projected returns (-3.0% appreciation + 4.9% rent growth), your $31k cash investment doubles in ~2 years — after that, you're playing with house money.
Negotiation context
- Only 8 days on market — expect competitive offers; lowballing is unlikely to land.
Risks & watch-outs
- Watch-outs: flood insurance adds $66/mo; built in 1950 — expect roof / HVAC / electrical / plumbing capex.
- Climate carrying-cost: severe flood risk; severe wind risk, 99% chance of damaging wind over 30y; extreme-heat days projected 7→27/yr by 2055 (HVAC capex compounding) — expect insurance premiums to compound above CPI over the hold.
Questions for the listing agent
- Built in 1950 — when were the roof, HVAC, electrical panel, plumbing, and water heater last replaced?
- What's the actual annual flood-insurance premium (NFIP or private), and is the property in a SFHA with mandatory coverage?
- Is there a deadline driving the sale (1031 exchange, divorce, estate, relocation)? That informs how much negotiation room exists.
- Schools are F-rated, which usually means shorter tenancies and higher turnover. Who's the typical renter profile here, and what's been the actual vacancy rate?
- Crime grade is D in this area — have there been break-ins, vandalism, or insurance claims at this property in the last 3 years? What carrier currently insures it and at what premium?
- What's the average days-on-market for RENTAL listings here right now (not sales)? A rising rental-DOM trend means longer vacancies and softer asking-rent achievability than the comps imply.
- What's the recent tenant-quality profile in this submarket — average credit score on applications, eviction rate, late-payment / NSF rate, and stable-employment percentage? A property-management company in the area should have these aggregated.
- How much new for-sale + rental construction is in the pipeline within 1–3 miles? Heavy new supply typically softens prices + rents 12–24 months out; constrained supply supports both.
Investment metrics
- 1% rule
- 3.15% ✓
- Cap rate
- 27.37%
- Cash-on-cash
- 75.29%
- DSCR
- 4.35
- GRM
- 2.6
CMA / ARV
- ARV (on-the-fly)
- $232,848
- Comps found
- 12
Show comp detail 12 sales within ~0.75 mi
| Address | Dist | Beds/Ba | Sqft | Sold | Price | $/sf | Match |
|---|---|---|---|---|---|---|---|
| 2013 15th Ave N | 0.32mi | 4/1.5 (-1) | 1,733 (-2%) | 10mo | $209,999 | $121 | 67 |
| 2709 8th Ave N | 0.44mi | 4/2.0 (-1) | 1,768 (+0%) | 10mo | $226,000 | $128 | 65 |
| 2010 15th Ave N | 0.35mi | 4/2.0 (-1) | 1,899 (+8%) | 4mo | $249,950 | $132 | 63 |
| 1909 16th Ave N | 0.43mi | 4/2.0 (-1) | 1,905 (+8%) | 3mo | $227,900 | $120 | 59 |
| 2429 16th Ave N | 0.25mi | 4/2.0 (-1) | 1,517 (-14%) | 2mo | $215,000 | $142 | 58 |
| 2205 21st Ave N | 0.55mi | 4/2.0 (-1) | 1,696 (-4%) | 10mo | $230,000 | $136 | 55 |
| 2913 18th Ave N | 0.65mi | 4/1.5 (-1) | 1,839 (+4%) | 2mo | $184,500 | $100 | 53 |
| 3014 14th Ave N | 0.66mi | 4/1.5 (-1) | 1,612 (-9%) | 1mo | $110,000 | $68 | 47 |
| 1617 14th Ave N | 0.53mi | 4/2.0 (-1) | 1,542 (-13%) | 6mo | $249,000 | $161 | 45 |
| 2705 6th Ave N | 0.55mi | 4/2.0 (-1) | 1,516 (-14%) | 4mo | $265,000 | $175 | 43 |
| 1518 14th Ave N | 0.72mi | 4/1.0 (-1) | 1,931 (+10%) | 9mo | $200,000 | $104 | 34 |
| 221 22nd St N | 0.67mi | 4/2.0 (-1) | 1,518 (-14%) | 10mo | $224,000 | $148 | 32 |
Match score weights: distance 35% · size 25% · config 20% · recency 20%. Top-matched comps best support the ARV.
Projected returns pro-forma
-3.0% appreciation · 4.91% rent growth · sell at horizon
- IRR
- 74.7%
- Equity multiple
- 4.50×
- Total profit
- $107,812
- Equity at exit
- $16,386
- IRR
- 79.0%
- Equity multiple
- 9.97×
- Total profit
- $276,129
- Equity at exit
- $9,502
Cash invested: $30,772 (down + closing). Projections, not guarantees.
Landlord ↔ Tenant lean methodology
- Overall (STATE)
- 87 Strongly Landlord-Friendly
- State Texas
- 87 Strongly Landlord-Friendly · R+5
- County
- — inherits STATE
- City
- — inherits STATE
ZIP-level market 77590
- Home prices YoY
- -19.3%
- Rents YoY
- 4.9%
- Active inventory
- 292
- Price-to-rent
- 2.6×
Monthly cashflow live
- Estimated rent
- $3,456 medium interval (Pro) →
- Mortgage (P&I)
- −$576
- Tax from tax record
- −$178 /mo · $2,133/yr
- Insurance
- −$46
- Flood insurance flood zone
- −$66 /mo · $798/yr
- HOA
- −$0
- Vacancy / Maint / Mgmt
- −$726
- Net cashflow
- $1,864
Break-even live
UW: 25.0% down · 7.5% · 30yr · 1.5% tax · 5.0% vac · 8.0% maint · 8.0% mgmt
Financing live
Cash to close
- Down payment
- $27,475
- Closing costs
- $3,297
- Reserves months
- —
- Total cash needed
- —
Loan-product check · same deal, 3 products live
Conventional
25% down · 7.5% · 30yr
- Down + closing
- —
- Monthly P&I
- —
- Monthly cashflow
- —
- DSCR
- —
- Eligible?
- —
Personal DTI + credit; lowest rate.
DSCR
20% down · 8.5% · 30yr
- Down + closing
- —
- Monthly P&I
- —
- Monthly cashflow
- —
- DSCR
- —
- Eligible?
- —
No personal income docs; deal must DSCR.
Hard money
10% down · 12.0% · 12mo
- Down + closing
- —
- Monthly P&I
- —
- Monthly cashflow
- —
- DSCR
- —
- Eligible?
- —
Short-term bridge; refi at stabilization.
Rent comps 2 comps
| Address | Beds | Baths | Sqft | Rent | $/sqft | DOM | Units | Dist |
|---|---|---|---|---|---|---|---|---|
| 2411 29th Ave N Unit 1056454P Texas City, TX | 4.0 | 2.0 | 2088 | $6,978 | $3.34 | 1d | 1 | 1.01mi |
| 1137 1st Ave N Texas City, TX | 5.0 | 2.0 | 1786 | $1,775 | $0.99 | 24d | 1 | 1.28mi |
Listing history 6 events
-
2026-06-18days on market $109,900 Active 8 DOM
-
2026-06-17days on market $109,900 Active 7 DOM
-
2026-06-16days on market $109,900 Active 6 DOM
-
2026-06-15days on market $109,900 Active 5 DOM
-
2026-06-13remarks 569-char remark
-
2026-06-13$109,900 Active 3 DOM
ⓘ Source: listings_history table (triggers on properties + properties_extension) + one-shot
backfill from property_details.listing_events for pre-trigger history.
Tax reassessment forecast TX · Resets to sale price
- Current annual tax
- $2,133 · $178/mo
- Projected year-2 tax
- $2,133 · $178/mo
- Expected delta
- $0/yr ($0/mo · 0.0%)
ⓘ Screening estimate from a state-policy table — verify with the county assessor before closing.
Climate risk First Street
- Flood 8/10 Severe FEMA zone X · 60% chance over 30 yrs
- Wildfire 1/10 Low
- Heat 10/10 Extreme 7 d/yr ≥108°F today · 27 d/yr by 30 yrs out
- Wind 9/10 Extreme 99% chance of damaging wind over 30 yrs
- Air quality 2/10 Low 2 unhealthy d/yr today · 2 by 30 yrs out
Nearby sold comps map
Loading sold comps map…
Walkable amenities ~0.75 mi
Loading nearby amenities…
Taxation est. · year 1
- Rental income
- $41,477
- − Mortgage interest
- −$6,156
- − Property taxes
- −$2,133
- − Insurance
- −$1,347
- − Repairs & maintenance
- −$3,318
- − Management
- −$3,318
- − Depreciation
- −$3,197
- Taxable income
- $22,007
- Est. tax owed @ 24.0%
- −$5,282
- After-tax cash flow
- $17,089/yr
For passive investors: Depreciation is non-cash, so a rental often shows a tax loss while cash-flowing — sheltering income. Rental losses are passive: they offset passive income freely, and up to $25,000/yr can offset ordinary (W-2) income if you actively participate and your MAGI is under $100k (phasing out to $0 by $150k); unused losses carry forward. On sale, claimed depreciation is recaptured at up to 25%, and gains may owe capital-gains tax (a 1031 exchange can defer both). Figures are a year-1 estimate at your 24.0% rate — not tax advice; consult a CPA.
Schools (NCES district)
- District
- Texas City ISD
- NCES district ID
- 4842510
- Math proficiency
- 28% ▼ -10.00%
- Reading proficiency
- 29% ▼ -4.00%
- Median HH income
- $44,875
- Composite
- 24.47/100
- National rank
- #7664
- State rank
- #655 of 826 in TX
Livability — Texas City
- Score
- 62/100
- State rank
- #907
- US rank
- #16268
Category grades
Schools grade is shown separately in the Schools card above.
Census & demographics
- Census place
- Texas City, TX
- County
- Galveston County · 357,330 people
- City population
- 49,936
- Metro
- Houston-The Woodlands-Sugar Land, TX
- Population (ZIP)
- 31,642
- Household income
- $65,801
- Rent vs Own
- Severe rent burden
- 1821.0
Population outlook (Galveston County) Hauer SSP2
- Today (2025)
- 390,640 people
- By 2030
- 425,226 · +8.9%
- By 2040
- 493,765 · +26.4%
- By 2050
- 559,698 · +43.3%
- By 2075
- 719,260 · +84.1%
- By 2100
- 819,628 · +109.8%
Race, ethnicity, and origin ACS 2023
- Neighborhood character
- Diverse neighborhood (Simpson 0.66)
- Race & ethnicity
- White 41% Hispanic / Latino 38% Two or more races 20% Black 17% Asian 2%
- Hispanic origin (detail)
- Mexican 33% Puerto Rican 1%
- Common ancestry
- Lithuanian 2% Slovak 1% Italian 1%
- Foreign-born
- 9% · Canada, Vietnam
- Languages at home
- 72% English-only · Spanish 26% Other Indo-European 1%
Political lean MEDSL · Galveston
- 2024 margin
- Strong R (+27.4) · D 35.7% · R 63.1% · Other 1.2%
- 2008→2024 swing
- -7.9pp toward R · 2008: -19.5pp · 2024: -27.4pp
- All cycles
- 2024: R+27.4 2020: R+22.6 2016: R+22.6 2012: R+26.9 2008: R+19.5
Not yet ingested
- Civics
- —
Market trends
- HPI YoY
- ▼ -58.35%
- Current HPI
- 244.5809
- Rent YoY
- ▲ 4.91%
- Metro
- Houston-The Woodlands-Sugar Land, TX
- State GDP YoY
- ▲ 3.95%
- F500 in state
- 110
Industry mix (Fortune 500 HQ in TX)
| Industry | F500 HQs | Revenue |
|---|---|---|
| Energy | 16 | $1,198B |
|
||
| Technology | 5 | $198B |
|
||
| Engineering / Construction | 4 | $72B |
|
||
| Energy Services | 3 | $60B |
|
||
| Utilities | 3 | $41B |
|
||
| Healthcare | 2 | $330B |
|
||
Price history
1 event — show timeline
- 2026-06-10 Listed $109,900 HARMLS
Property tax history
+3.1%/yrLatest (2025): $2,133 · +21.8% YoY. Source: county tax records.
Cash-flow waterfall
monthlySold comps — $/sqft
last 12 mo · ≤1 miLoading sold comps…