11656 County Road R Rd · Pioneer, OH
Flood risk 1/10 · Minimal
- FEMA flood zone
- X
- Chance of flooding over 30 yrs
- 0.0%
- Est. flood insurance / yr
- $473 – $860
Fire risk 1/10 · Minimal
- Est. fire insurance / yr
- $713 – $1,323
Heat risk 2/10 · Minimal
- Hot days now (above 99°F)
- 7 days/yr
- Hot days in 30 yrs
- 16 days/yr
Wind risk 2/10 · Minimal
- Chance of severe wind over 30 yrs
- —
Air-quality risk 2/10 · Minimal
- Unhealthy air days now
- 1 days/yr
- Unhealthy air days in 30 yrs
- 2 days/yr
Risk factors via First Street. Map © Google.
Why this score? — see what drove the D grade
The composite is a weighted blend of 9 inputs, each scored 0–100. Each bar is that input's sub-score; the figure is the points it added to the 100-point composite (weight × sub-score).
- ARV discount +15.0/15.0
- Cash flow +7.5/30.0
- Schools +4.9/10.0
- Livability +3.4/5.0
- Rent growth +2.5/5.0
- Condition / age +2.5/5.0
- 1% rule +2.1/10.0
- Appreciation +2.0/10.0
- DSCR +1.6/10.0
$169,900
🖨 Deal sheet (PDF) 📄 Offer letter ✓ Due diligence
Listing remarks
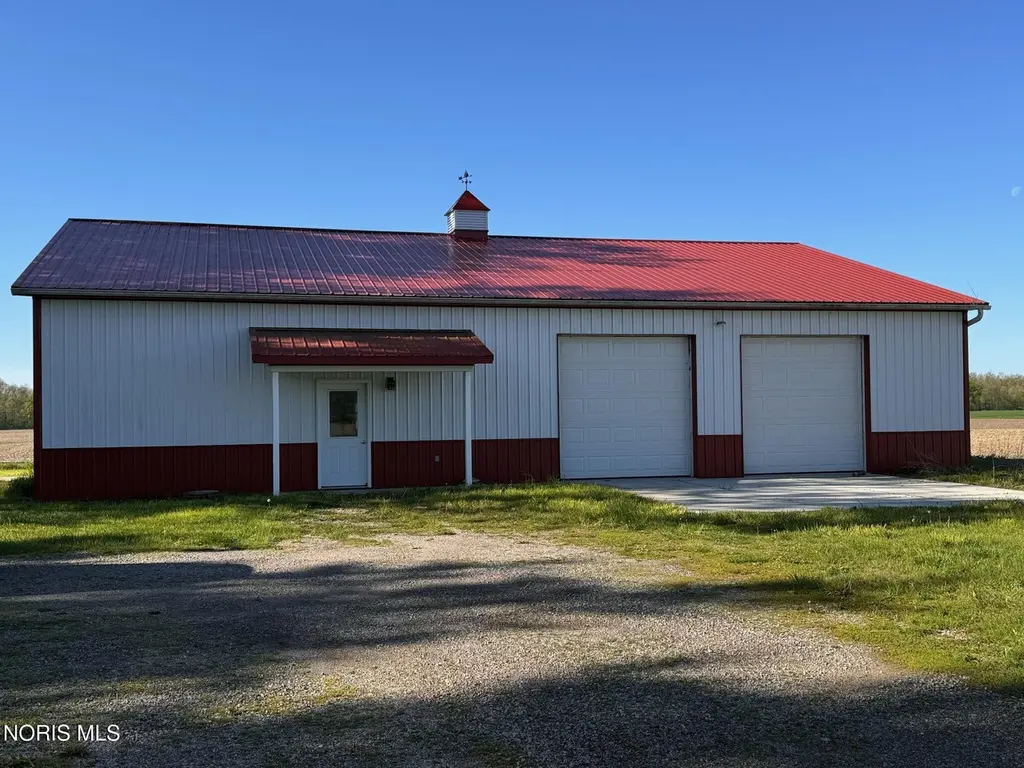
GREAT OPPORTUNITY TO PURCHASE A HOME WITH 5 ACRES AND A INCREDIBLE NEWER 50X64 POLE WITH CONCRETE FLOORS AND INSULATED. HOUSE NEEDS SOME TLC BUT COULD BE A NICE FLIP HOUSE. 5 ACRES OF LAND TO ROAM!! DON'T MISS THIS OPPORTUNITY. ESTATE SALE! CASH OFFERS ONLY!! SET YOUR APPOINTMENT UP TODAY!
Key facts
- 5 acre lot
- 2 garage spots
- Built 1870
Property features AI
Exterior
- Parking: 2-car garage; Gravel parking
- Utilities: Electricity connected; Propane; Well water; Septic tank
- Home design: Single-family house; Two levels (2 stories); Not attached to other structures; No common walls
- Construction: Brick and vinyl siding exterior; Block foundation; Block basement
- Exterior features: Shingle roof
Interior
- Kitchen: Kitchen on main level (8 x 10)
- Bedrooms: Main-level bedroom (12 x 14); Main-level bedroom (12 x 12); Upper-level bedroom (10 x 11); Upper-level bedroom (10 x 11)
- Flooring: Carpet; Vinyl
- Bathrooms: One full bathroom
- Heating & cooling: Forced air heating; Ceiling fans for cooling; Has heating and cooling
- Interior features: Eight total rooms; Basement with block foundation; Other interior features
- Laundry & utility: Main-level laundry (11 x 15)
Neighborhood map
What this means for you Summary
Snapshot
- This is a 3-bed/1.5-bath single-family listed at $170k.
Deal economics
- At list price, monthly cash flow is $-213 ($-3k/yr) — negative.
- To cash-flow at today's rent, offer at most $132k (22.2% below list).
- To meet the 1% rule (rent ≥ 1% of price), the offer needs to be $121k (28.6% below list).
- Recommended offer: $121k (28.6% below list) — sets the bar for 1% rule.
Location & tenants
- Location reads 68/100 on livability (#578 in OH) — a middle-class / working-renter tenant base. Strengths: crime A+, cost of living A+, housing A+; Watch: amenities F, commute F, employment F.
- North Central Local (rural): math 50% / reading 66% proficiency, ranked #329 of 656 in OH (top 50%) — acceptable for families but not a draw, mixed tenant base, ~2y average lease.
- Zoned schools: North Central Elementary School (math 62% / reading 72%, grade B+, #456 of 1,584 statewide, top 31%, 303 students, 0% FRL); North Central Junior/High School (math 37% / reading 57%, grade D-, #435 of 781 statewide, top 59%, 248 students, 61% FRL) — zoned schools average 30% FRL vs 57% district-wide (27 pts lower); this property's tenant base skews higher-income than the district average.
- Market conditions: 12 active listings in the ZIP; 40 units permitted in Williams County in 2024 (0 in 5+ unit buildings).
Forward outlook
- Local home prices are declining (-3.0%/yr); year-one equity from $1k of loan paydown is wiped out by about $5k of value loss. Plan a longer hold.
- Williams County population projected at -14% by 2050 — secular population decline; favor cash flow + early exit over multi-decade hold.
Negotiation context
- Only 4 days on market — expect competitive offers; lowballing is unlikely to land.
Risks & watch-outs
- Watch-outs: built in 1870 — expect roof / HVAC / electrical / plumbing capex.
Questions for the listing agent
- What do current leases actually rent for vs. the listed asking? Can we see a recent rent roll and the last 12 months of T-12 income?
- Built in 1870 — when were the roof, HVAC, electrical panel, plumbing, and water heater last replaced?
- Is there a deadline driving the sale (1031 exchange, divorce, estate, relocation)? That informs how much negotiation room exists.
- Schools are B-rated — typically a magnet for longer-tenancy family renters. What's the average tenant stay here, and is there a school-zone premium baked into asking?
- The area grade is low — what's the realistic commute time and amenity access for the typical tenant pool here? Any planned neighborhood developments (good or bad) we should know about?
- What's the average days-on-market for RENTAL listings here right now (not sales)? A rising rental-DOM trend means longer vacancies and softer asking-rent achievability than the comps imply.
- What's the recent tenant-quality profile in this submarket — average credit score on applications, eviction rate, late-payment / NSF rate, and stable-employment percentage? A property-management company in the area should have these aggregated.
- How much new for-sale + rental construction is in the pipeline within 1–3 miles? Heavy new supply typically softens prices + rents 12–24 months out; constrained supply supports both.
Investment metrics
- 1% rule
- 0.71% ✗
- Cap rate
- 4.79%
- Cash-on-cash
- -5.37%
- DSCR
- 0.76
- GRM
- 11.7
CMA / ARV
- ARV (median comp)
- $279,090
- List price
- $169,900
- Delta
- -39.12%
- Verdict
- UNDERPRICED
- Comps
- 4 within 2.0 mi
Show comp detail 1 sale within ~0.75 mi
| Address | Dist | Beds/Ba | Sqft | Sold | Price | $/sf | Match |
|---|---|---|---|---|---|---|---|
| 11656 County Road R Rd | 0.00mi | 4/1.0 (+1) | 1,923 (0%) | 1mo | $185,000 | $96 | 92 |
Match score weights: distance 35% · size 25% · config 20% · recency 20%. Top-matched comps best support the ARV.
Projected returns pro-forma
-3.0% appreciation · 3.0% rent growth · sell at horizon
- IRR
- -25.5%
- Equity multiple
- 0.14×
- Total profit
- $-41,085
- Equity at exit
- $25,333
- IRR
- -21.7%
- Equity multiple
- -0.12×
- Total profit
- $-53,183
- Equity at exit
- $14,690
Cash invested: $47,572 (down + closing). Projections, not guarantees.
Landlord ↔ Tenant lean methodology
- Overall (STATE)
- 73 Landlord-Friendly
- State Ohio
- 73 Landlord-Friendly · R+6
- County
- — inherits STATE
- City
- — inherits STATE
ZIP-level market 43554
- Home prices YoY
- -2.6%
- Active inventory
- 12
- Price-to-rent
- 11.7×
Monthly cashflow live
- Estimated rent
- $1,214 medium interval (Pro) →
- Mortgage (P&I)
- −$891
- Tax from tax record
- −$210 /mo · $2,521/yr
- Insurance
- −$71
- HOA
- −$0
- Vacancy / Maint / Mgmt
- −$255
- Net cashflow
- $-213
Break-even live
Sensitivity live
| Price | -10% $-117 | -5% $-165 | +0% $-213 | +5% $-261 | +10% $-309 |
|---|---|---|---|---|---|
| Rent | -10% $-309 | -5% $-261 | +0% $-213 | +5% $-165 | +10% $-117 |
| Rate | -1.0pp $-128 | -0.5pp $-170 | base $-213 | +0.5pp $-257 | +1.0pp $-302 |
UW: 25.0% down · 7.5% · 30yr · 1.5% tax · 5.0% vac · 8.0% maint · 8.0% mgmt
Financing live
Cash to close
- Down payment
- $42,475
- Closing costs
- $5,097
- Reserves months
- —
- Total cash needed
- —
Loan-product check · same deal, 3 products live
Conventional
25% down · 7.5% · 30yr
- Down + closing
- —
- Monthly P&I
- —
- Monthly cashflow
- —
- DSCR
- —
- Eligible?
- —
Personal DTI + credit; lowest rate.
DSCR
20% down · 8.5% · 30yr
- Down + closing
- —
- Monthly P&I
- —
- Monthly cashflow
- —
- DSCR
- —
- Eligible?
- —
No personal income docs; deal must DSCR.
Hard money
10% down · 12.0% · 12mo
- Down + closing
- —
- Monthly P&I
- —
- Monthly cashflow
- —
- DSCR
- —
- Eligible?
- —
Short-term bridge; refi at stabilization.
Listing history 2 events
-
2026-05-11status Pending 296-char remark
-
2026-05-05$169,900 Active 296-char remark
ⓘ Source: listings_history table (triggers on properties + properties_extension) + one-shot
backfill from property_details.listing_events for pre-trigger history.
Tax reassessment forecast OH · Partial reset (capped growth)
- Current annual tax
- $2,521 · $210/mo
- Projected year-2 tax
- $2,586 · $215/mo
- Expected delta
- +$65/yr (+$5/mo · 2.6%)
ⓘ Screening estimate from a state-policy table — verify with the county assessor before closing.
Climate risk First Street
- Flood 1/10 Low FEMA zone X · 0% chance over 30 yrs
- Wildfire 1/10 Low
- Heat 2/10 Low 7 d/yr ≥99°F today · 16 d/yr by 30 yrs out
- Wind 2/10 Low
- Air quality 2/10 Low 1 unhealthy d/yr today · 2 by 30 yrs out
Nearby sold comps map
Loading sold comps map…
Walkable amenities ~0.75 mi
Loading nearby amenities…
Taxation est. · year 1
- Rental income
- $14,564
- − Mortgage interest
- −$9,517
- − Property taxes
- −$2,521
- − Insurance
- −$850
- − Repairs & maintenance
- −$1,165
- − Management
- −$1,165
- − Depreciation
- −$4,943
- Taxable loss
- −$5,597
- Est. tax savings @ 24.0%
- +$1,343
- After-tax cash flow
- $-1,214/yr
For passive investors: Depreciation is non-cash, so a rental often shows a tax loss while cash-flowing — sheltering income. Rental losses are passive: they offset passive income freely, and up to $25,000/yr can offset ordinary (W-2) income if you actively participate and your MAGI is under $100k (phasing out to $0 by $150k); unused losses carry forward. On sale, claimed depreciation is recaptured at up to 25%, and gains may owe capital-gains tax (a 1031 exchange can defer both). Figures are a year-1 estimate at your 24.0% rate — not tax advice; consult a CPA.
Schools (NCES district)
- District
- North Central Local
- NCES district ID
- 3905064
- Math proficiency
- 50% ▼ -19.00%
- Reading proficiency
- 66% ▼ -3.00%
- Median HH income
- $46,628
- Composite
- 49.03/100
- National rank
- #2062
- State rank
- #329 of 656 in OH
Livability — Pioneer
- Score
- 68/100
- State rank
- #578
- US rank
- #9826
Category grades
Schools grade is shown separately in the Schools card above.
Census & demographics
- County
- Williams · 37,585 people
- Population (ZIP)
- 2,035
- Household income
- $56,708
- Rent vs Own
- Severe rent burden
- 16.9
Population outlook (Williams County) Hauer SSP2
- Today (2025)
- 36,125 people
- By 2030
- 35,264 · -2.4%
- By 2040
- 33,264 · -7.9%
- By 2050
- 31,072 · -14.0%
- By 2075
- 26,553 · -26.5%
- By 2100
- 21,318 · -41.0%
Race, ethnicity, and origin ACS 2023
- Neighborhood character
- Predominantly White (95%)
- Race & ethnicity
- White 95% Hispanic / Latino 2% Two or more races 2% Black 1%
- Common ancestry
- Slovak 5% Iranian 5% Lithuanian 4%
- Foreign-born
- 1% · China, Canada
- Languages at home
- 95% English-only · German/W. Germanic 5%
Political lean MEDSL · Williams
- 2024 margin
- Solid R (+48.2) · D 25.4% · R 73.7%
- 2008→2024 swing
- -39.0pp toward R · 2008: -9.3pp · 2024: -48.2pp
- All cycles
- 2024: R+48.2 2020: R+46.2 2016: R+43.8 2012: R+16.3 2008: R+9.3
Not yet ingested
- Civics
- —
Market trends
- HPI YoY
- ▼ -6.03%
- Current HPI
- 227.4421
- Rent YoY
- —
- Metro
- —
- State GDP YoY
- ▲ 1.98%
- F500 in state
- 48
Industry mix (Fortune 500 HQ in OH)
| Industry | F500 HQs | Revenue |
|---|---|---|
| Insurance | 3 | $145B |
|
||
| Industrial Machinery | 3 | $49B |
|
||
| Financial Services | 3 | $24B |
|
||
| Consumer Goods | 2 | $93B |
|
||
| Aerospace / Defense | 2 | $47B |
|
||
| Utilities | 2 | $33B |
|
||
Price history
+8.9% since first listed4 events — show timeline
- 2026-06-04 Sold (Public Records) $185,000 Public Records
- 2026-06-02 Sold (MLS) $185,000 NORIS
- 2026-05-11 Pending — NORIS
- 2026-05-05 Listed $169,900 NORIS
Property tax history
+13.9%/yrLatest (2025): $2,521 · +0.0% YoY. Source: county tax records.
Cash-flow waterfall
monthlySold comps — $/sqft
last 12 mo · ≤1 miLoading sold comps…