1036 Beaver Hill Dr · Crozet, VA
Flood risk 1/10 · Minimal
- FEMA flood zone
- X (unshaded)
- Chance of flooding over 30 yrs
- 0.0%
- Est. flood insurance / yr
- $473 – $860
Fire risk 5/10 · Moderate
- Est. fire insurance / yr
- $666 – $1,236
Heat risk 6/10 · Moderate
- Hot days now (above 104°F)
- 7 days/yr
- Hot days in 30 yrs
- 18 days/yr
Wind risk 2/10 · Minimal
- Chance of severe wind over 30 yrs
- 2.0%
Air-quality risk 1/10 · Minimal
- Unhealthy air days now
- 0 days/yr
- Unhealthy air days in 30 yrs
- 0 days/yr
Risk factors via First Street. Map © Google.
Why this score? — see what drove the B+ grade
The composite is a weighted blend of 9 inputs, each scored 0–100. Each bar is that input's sub-score; the figure is the points it added to the 100-point composite (weight × sub-score).
- Cash flow +30.0/30.0
- 1% rule +10.0/10.0
- DSCR +10.0/10.0
- ARV discount +7.5/15.0
- Schools +6.2/10.0
- Condition / age +4.8/5.0
- Livability +4.1/5.0
- Rent growth +3.2/5.0
- Appreciation +0.0/10.0
$110,000
🖨 Deal sheet (PDF) 📄 Offer letter ✓ Due diligence
Listing remarks
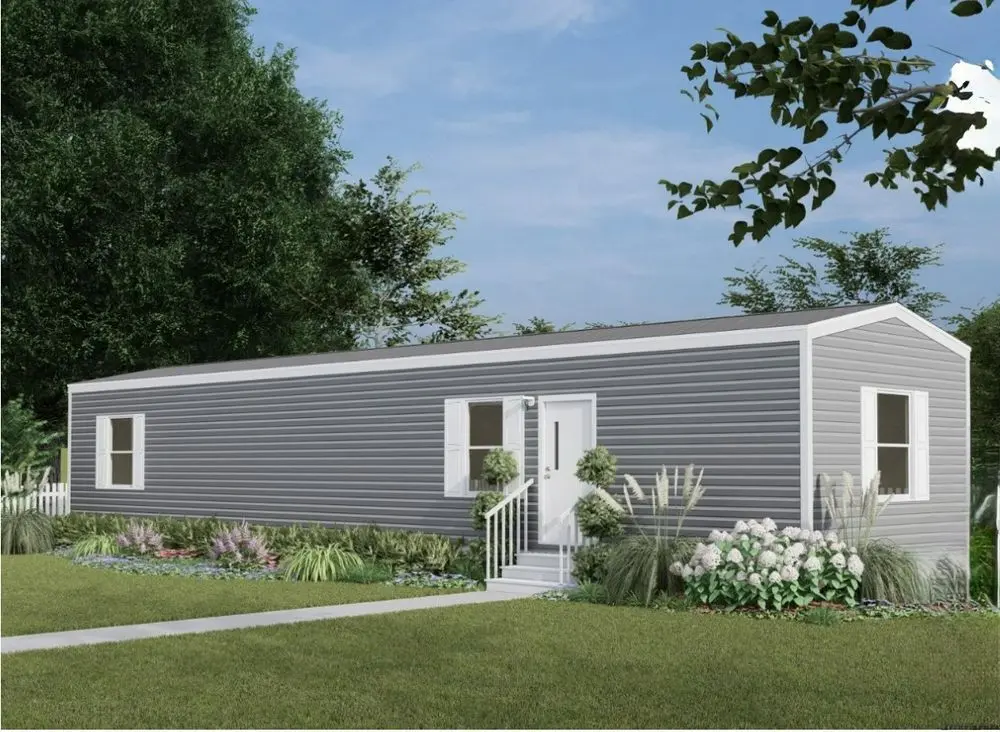
2 Bedrooms 1 bath Manufactured Home built in August 2024, setup in February 2025. All Appliances brand New Stove, Dishwasher, LG Refrigerator , LG Washer and Dryer. New Deck with Ramp it needs to be panted again because the weather messed it up , Walkway. Garden Lights, wall Cabinet in the bathroom for extra storage. Central Air & Heat on the Ecobee system. You can use the App to setup the heat or Air from anywhere. The Front Door/ Storm Door was replaced with a beautiful new door. Located in a quiet neighborhood that very well run in Crozet, VA. Beaver Hill Village has a nice pond for fishing. The neighbors are great. 29 Minutes from Charlottesville or Waynesboro. Harris Heeter, Sub
Key facts
- Brand new appliances
- Garden lights
- New deck
Tags
Neighborhood map
What this means for you Summary
Snapshot
- This is a 2-bed/1.0-bath single-family listed at $110k. Condition is rated excellent.
Deal economics
- At list price, monthly cash flow is $595 ($7k/yr) — positive.
- The deal already cash-flows at list — no discount required.
- Meets the 1% rule at list price ($2k rent vs $110k).
- Recommended offer: $108k (1.5% below list) — sets the bar for market timing.
- Cap rate 12.8% vs local median 2.8% in Crozet — top-decile yield for the area; either an underpriced asset or a hidden risk that comps aren't pricing in. Stress-test before assuming the spread holds.
Location & tenants
- Location reads 82/100 on livability (#48 in VA, #1,158 nationally) — a professional / high-income tenant draw. Strengths: crime A+, employment A+, housing A+; Watch: amenities C-, commute F, cost of living F.
- Albemarle County Public School District (rural): math 66% / reading 77% proficiency, ranked #14 of 131 in VA (top 11%) — strong family-tenant draw, lease renewals of 3-5y typical.
- Zoned schools: Crozet Elementary (math 62% / reading 62%, grade B, #480 of 1,108 statewide, top 46%, 514 students, 18% FRL); Joseph T. Henley Middle (math 82% / reading 89%, grade A+, #10 of 342 statewide, top 3%, 808 students, 13% FRL); Western Albemarle High (math 72% / reading 92%, grade A, #40 of 319 statewide, top 15%, 1,158 students, 13% FRL).
- Market conditions: Rents rising (+2.8%/yr); 387 active listings in the ZIP; solid renter incomes; 810 units permitted in Albemarle County in 2024 (188 in 5+ unit buildings).
Forward outlook
- Local home prices are declining (-3.0%/yr); year-one equity from $761 of loan paydown is wiped out by about $3k of value loss. Plan a longer hold.
- Albemarle County population projected at +24% by 2050 — long-run rental-demand tailwind backs the buy-and-hold thesis.
- At projected returns (-3.0% appreciation + 2.8% rent growth), your $31k cash investment doubles in ~6 years — after that, you're playing with house money.
Negotiation context
- It's been on market 17 days — a 2% lower offer ($108k) is reasonable based on typical stale-listing flexibility.
Risks & watch-outs
- Climate carrying-cost: moderate wildfire risk; extreme-heat days projected 7→18/yr by 2055 (HVAC capex compounding) — expect insurance premiums to compound above CPI over the hold.
Questions for the listing agent
- Is there a deadline driving the sale (1031 exchange, divorce, estate, relocation)? That informs how much negotiation room exists.
- Schools are A-rated — typically a magnet for longer-tenancy family renters. What's the average tenant stay here, and is there a school-zone premium baked into asking?
- What's the average days-on-market for RENTAL listings here right now (not sales)? A rising rental-DOM trend means longer vacancies and softer asking-rent achievability than the comps imply.
- What's the recent tenant-quality profile in this submarket — average credit score on applications, eviction rate, late-payment / NSF rate, and stable-employment percentage? A property-management company in the area should have these aggregated.
- How much new for-sale + rental construction is in the pipeline within 1–3 miles? Heavy new supply typically softens prices + rents 12–24 months out; constrained supply supports both.
Investment metrics
- 1% rule
- 1.56% ✓
- Cap rate
- 12.78%
- Cash-on-cash
- 23.17%
- DSCR
- 2.03
- GRM
- 5.3
CMA / ARV
No comps found within radius.
Projected returns pro-forma
-3.0% appreciation · 2.82% rent growth · sell at horizon
- IRR
- 16.0%
- Equity multiple
- 1.64×
- Total profit
- $19,771
- Equity at exit
- $16,401
- IRR
- 24.5%
- Equity multiple
- 3.10×
- Total profit
- $64,829
- Equity at exit
- $9,511
Cash invested: $30,800 (down + closing). Projections, not guarantees.
Landlord ↔ Tenant lean methodology
- Overall (STATE)
- 55 Moderately Landlord-Leaning
- State Virginia
- 55 Moderately Landlord-Leaning · D+2
- County
- — inherits STATE
- City
- — inherits STATE
ZIP-level market 22901
- Rents YoY
- 2.8%
- Active inventory
- 387
- Price-to-rent
- 5.3×
Monthly cashflow live
- Estimated rent
- $1,715 medium interval (Pro) →
- Mortgage (P&I)
- −$577
- Tax est. 1.5%
- −$138 /mo · $1,650/yr
- Insurance
- −$46
- HOA
- −$0
- Vacancy / Maint / Mgmt
- −$360
- Net cashflow
- $595
Break-even live
Sensitivity live
| Price | -10% $671 | -5% $633 | +0% $595 | +5% $557 | +10% $519 |
|---|---|---|---|---|---|
| Rent | -10% $459 | -5% $527 | +0% $595 | +5% $662 | +10% $730 |
| Rate | -1.0pp $650 | -0.5pp $623 | base $595 | +0.5pp $566 | +1.0pp $537 |
UW: 25.0% down · 7.5% · 30yr · 1.5% tax · 5.0% vac · 8.0% maint · 8.0% mgmt
Financing live
Cash to close
- Down payment
- $27,500
- Closing costs
- $3,300
- Reserves months
- —
- Total cash needed
- —
Loan-product check · same deal, 3 products live
Conventional
25% down · 7.5% · 30yr
- Down + closing
- —
- Monthly P&I
- —
- Monthly cashflow
- —
- DSCR
- —
- Eligible?
- —
Personal DTI + credit; lowest rate.
DSCR
20% down · 8.5% · 30yr
- Down + closing
- —
- Monthly P&I
- —
- Monthly cashflow
- —
- DSCR
- —
- Eligible?
- —
No personal income docs; deal must DSCR.
Hard money
10% down · 12.0% · 12mo
- Down + closing
- —
- Monthly P&I
- —
- Monthly cashflow
- —
- DSCR
- —
- Eligible?
- —
Short-term bridge; refi at stabilization.
Listing history 13 events
-
2026-06-21days on market $110,000 Active 17 DOM
-
2026-06-19days on market $110,000 Active 15 DOM
-
2026-06-18days on market $110,000 Active 14 DOM
-
2026-06-17days on market $110,000 Active 13 DOM
-
2026-06-16days on market $110,000 Active 12 DOM
-
2026-06-15days on market $110,000 Active 11 DOM
-
2026-06-14days on market $110,000 Active 9 DOM
-
2026-06-13days on market $110,000 Active 8 DOM
-
2026-06-10days on market $110,000 Active 6 DOM
-
2026-06-09days on market $110,000 Active 5 DOM
-
2026-06-08days on market $110,000 Active 4 DOM
-
2026-06-07remarks 695-char remark
-
2026-06-07$110,000 Active 3 DOM
ⓘ Source: listings_history table (triggers on properties + properties_extension) + one-shot
backfill from property_details.listing_events for pre-trigger history.
Climate risk First Street
- Flood 1/10 Low FEMA zone X (unshaded) · 0% chance over 30 yrs
- Wildfire 5/10 Major
- Heat 6/10 Major 7 d/yr ≥104°F today · 18 d/yr by 30 yrs out
- Wind 2/10 Low 2% chance of damaging wind over 30 yrs
- Air quality 1/10 Low 0 unhealthy d/yr today · 0 by 30 yrs out
Nearby sold comps map
Loading sold comps map…
Walkable amenities ~0.75 mi
Loading nearby amenities…
Taxation est. · year 1
- Rental income
- $20,581
- − Mortgage interest
- −$6,162
- − Property taxes
- −$1,650
- − Insurance
- −$550
- − Repairs & maintenance
- −$1,646
- − Management
- −$1,646
- − Depreciation
- −$3,200
- Taxable income
- $5,726
- Est. tax owed @ 24.0%
- −$1,374
- After-tax cash flow
- $5,763/yr
For passive investors: Depreciation is non-cash, so a rental often shows a tax loss while cash-flowing — sheltering income. Rental losses are passive: they offset passive income freely, and up to $25,000/yr can offset ordinary (W-2) income if you actively participate and your MAGI is under $100k (phasing out to $0 by $150k); unused losses carry forward. On sale, claimed depreciation is recaptured at up to 25%, and gains may owe capital-gains tax (a 1031 exchange can defer both). Figures are a year-1 estimate at your 24.0% rate — not tax advice; consult a CPA.
Condition & rehab AI · 10 photos
This manufactured home is in excellent condition with no visible signs of damage or wear. The home is move-in ready and has a clean and well-maintained interior and exterior. The home is located in a quiet neighborhood with a nice pond for fishing and great neighbors.
Value-add opportunities
- Resale Paint the exterior fencing — Painting the fencing will enhance the curb appeal and make the home look more inviting to potential buyers.
- Rental Add a small garden bed near the front door — Adding a small garden bed near the front door can enhance the curb appeal and make the home more attractive to potential renters.
Renovation cost estimate screening
Value-add ROI direction
- Resale Paint the exterior fencing — Painting the fencing will enhance the curb appeal and make the home look more inviting to potential buyers. ↑
- Rental Add a small garden bed near the front door — Adding a small garden bed near the front door can enhance the curb appeal and make the home more attractive to potential renters. ↑
ⓘ Cost ranges are severity-bucket heuristics (US national rule-of-thumb). Get contractor quotes + a written scope before underwriting a rehab budget.
Schools (NCES district)
- District
- Albemarle County Public School District
- NCES district ID
- 5100090
- Math proficiency
- 66% ▼ -16.00%
- Reading proficiency
- 77% ▼ -2.00%
- Median HH income
- $67,851
- Composite
- 62.28/100
- National rank
- #698
- State rank
- #14 of 131 in VA
Livability — Crozet
- Score
- 82/100
- State rank
- #48
- US rank
- #1158
Category grades
Schools grade is shown separately in the Schools card above.
Census & demographics
- County
- Albemarle County · 129,350 people
- City population
- 9,148
- Metro
- Charlottesville, VA
- Population (ZIP)
- 37,237
- Household income
- $92,145
- Rent vs Own
- Severe rent burden
- 2109.0
Population outlook (Albemarle County) Hauer SSP2
- Today (2025)
- 119,403 people
- By 2030
- 125,829 · +5.4%
- By 2040
- 137,705 · +15.3%
- By 2050
- 148,058 · +24.0%
- By 2075
- 172,223 · +44.2%
- By 2100
- 185,628 · +55.5%
Race, ethnicity, and origin ACS 2023
- Neighborhood character
- Predominantly White (70%)
- Race & ethnicity
- White 70% Black 12% Hispanic / Latino 9% Two or more races 6% Asian 5%
- Hispanic origin (detail)
- Mexican 1%
- Common ancestry
- Romanian 3% Slovak 3% Lithuanian 2%
- Foreign-born
- 12% · Canada, China, South Korea
- Languages at home
- 84% English-only · Spanish 8% Other Indo-European 2% Other Asian/Pacific 1%
Political lean MEDSL · Albemarle
- 2024 margin
- Solid D (+34.1) · D 66.3% · R 32.2% · Other 1.4%
- 2008→2024 swing
- +16.1pp toward D · 2008: 18.0pp · 2024: 34.1pp
- All cycles
- 2024: D+34.1 2020: D+33.5 2016: D+25.1 2012: D+12.0 2008: D+18.0
Not yet ingested
- Civics
- —
Market trends
- HPI YoY
- ▼ -341.65%
- Current HPI
- 279.3342
- Rent YoY
- ▲ 2.82%
- Metro
- Charlottesville, VA
- State GDP YoY
- ▲ 2.40%
- F500 in state
- 50
Industry mix (Fortune 500 HQ in VA)
| Industry | F500 HQs | Revenue |
|---|---|---|
| Aerospace / Defense | 4 | $236B |
|
||
| Technology / Defense | 3 | $32B |
|
||
| Financial Services | 2 | $176B |
|
||
| Utilities | 2 | $27B |
|
||
| Insurance | 2 | $25B |
|
||
| Technology | 2 | $15B |
|
||
Price history
1 event — show timeline
- 2026-06-04 Listed $110,000 ForSaleByOwner.com
Cash-flow waterfall
monthlySold comps — $/sqft
last 12 mo · ≤1 miLoading sold comps…