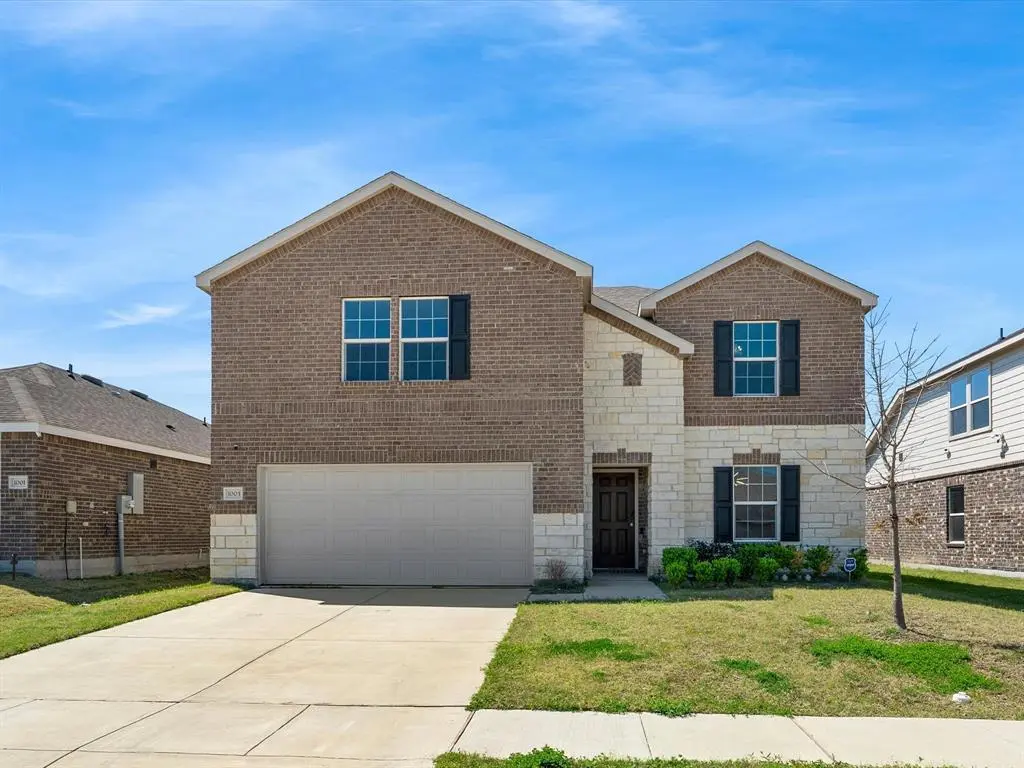
1003 Voca Dr · Travis Ranch, TX
Flood risk 1/10 · Minimal
- FEMA flood zone
- X (unshaded)
- Chance of flooding over 30 yrs
- 0.0%
- Est. flood insurance / yr
- $507 – $1,088
Fire risk 5/10 · Moderate
- Est. fire insurance / yr
- $1,222 – $2,270
Heat risk 8/10 · Major
- Hot days now (above 110°F)
- 7 days/yr
- Hot days in 30 yrs
- 25 days/yr
Wind risk 6/10 · Moderate
- Chance of severe wind over 30 yrs
- 27.0%
Air-quality risk 2/10 · Minimal
- Unhealthy air days now
- 1 days/yr
- Unhealthy air days in 30 yrs
- 1 days/yr
Risk factors via First Street. Map © Google.
Why this score? — see what drove the D grade
The composite is a weighted blend of 9 inputs, each scored 0–100. Each bar is that input's sub-score; the figure is the points it added to the 100-point composite (weight × sub-score).
- ARV discount +15.0/15.0
- Cash flow +7.2/30.0
- Condition / age +4.8/5.0
- Schools +4.0/10.0
- 1% rule +3.9/10.0
- Livability +3.1/5.0
- Rent growth +2.9/5.0
- DSCR +1.4/10.0
- Appreciation +0.0/10.0
$299,999
🖨 Deal sheet (PDF) 📄 Offer letter ✓ Due diligence
Listing remarks MLS
This well-maintained 2-story features 4 bedrooms, 2.5 bathrooms, a 2-car garage, and a host of luxurious features. Built in 2021, this modern gem comes with a limited structural warranty, ensuring peace of mind. Inside, enjoy a game room for movie nights and a flexible space ideal for an office or an extra bedroom. Unlike similar new builds in the area as it has custom light fixtures throughout the home. With an open-concept design, a spa-like primary suite, and a prime location, this home is a rare find. Spacious backyard, perfect for little ones and our furry friends. Don't miss out – schedule a tour today and experience modern living at its best!
Key facts
- Open-concept design
- Flexible space
- Spacious backyard
Tags
Neighborhood map
What this means for you Summary
Snapshot
- This is a 4-bed/2.5-bath single-family listed at $300k. Condition is rated excellent.
Deal economics
- At list price, monthly cash flow is $-415 ($-5k/yr) — negative.
- To cash-flow at today's rent, offer at most $227k (24.5% below list).
- To meet the 1% rule (rent ≥ 1% of price), the offer needs to be $266k (11.4% below list).
- Recommended offer: $227k (24.5% below list) — sets the bar for cash-flow.
Location & tenants
- Location reads 61/100 on livability (#983 in TX) — a middle-class / working-renter tenant base. Strengths: employment A+, housing A+, crime B+; Watch: amenities F, commute F, health & safety F.
- Forney ISD (rural): math 41% / reading 44% proficiency, ranked #234 of 826 in TX (top 28%) — families likely to look elsewhere, expect single-tenant / working-renter base with shorter leases.
- Zoned schools: Lewis El (math 32% / reading 32%, grade F, #2,268 of 4,322 statewide, top 55%, 763 students, 50% FRL); Brown Middle (math 29% / reading 39%, grade F, #892 of 1,662 statewide, top 55%, 673 students, 56% FRL); North Forney H S (math 32% / reading 45%, grade F, #866 of 1,632 statewide, top 54%, 2,502 students, 49% FRL) — zoned schools average 52% FRL vs 26% district-wide (25 pts higher); higher-poverty schools than district average — tighter screening recommended.
- Market conditions: Rents rising (+1.4%/yr); 2200 active listings in the ZIP; 16 comparable units currently listed for rent nearby; rentals at typical pace (median 24d on market — plan ~3-4 weeks tenant-placement turnaround); solid renter incomes; 1,747 units permitted in Kaufman County in 2024 (180 in 5+ unit buildings).
- This rent runs 31% of the median local income ($104k/yr) — at the standard rent-burdened threshold; future hikes will face affordability resistance.
Forward outlook
- Local home prices are declining (-3.0%/yr); year-one equity from $2k of loan paydown is wiped out by about $9k of value loss. Plan a longer hold.
- Kaufman County population projected at +43% by 2050 — long-run rental-demand tailwind backs the buy-and-hold thesis.
Negotiation context
- It's been on market 88 days — a 6% lower offer ($282k) is reasonable based on typical stale-listing flexibility.
- 5 sale attempts since 3y ago; this cycle's ask has dropped $40k (12%) from the opening price — seller is motivated, your offer sets the floor, not the list.
Risks & watch-outs
- Watch-outs: property tax is 3.1% of price.
- Climate carrying-cost: major wind risk, 27% chance of damaging wind over 30y; moderate wildfire risk; extreme-heat days projected 7→25/yr by 2055 (HVAC capex compounding) — expect insurance premiums to compound above CPI over the hold.
Questions for the listing agent
- What do current leases actually rent for vs. the listed asking? Can we see a recent rent roll and the last 12 months of T-12 income?
- It's been on market 88 days. Have you received any prior offers? Is the seller open to a 24% concession, seller financing, or rate buy-down credit?
- Property tax is high relative to price — has the assessment been appealed recently, and will the sale trigger a re-assessment?
- What does the HOA fee cover, when was the last increase, and are there any pending special assessments or reserve-fund shortfalls?
- Why hasn't it sold? Are there any deal-killer items the seller is aware of (foundation, flood, title, zoning, code violations)?
- Is there a deadline driving the sale (1031 exchange, divorce, estate, relocation)? That informs how much negotiation room exists.
- The area grade is low — what's the realistic commute time and amenity access for the typical tenant pool here? Any planned neighborhood developments (good or bad) we should know about?
- What's the average days-on-market for RENTAL listings here right now (not sales)? A rising rental-DOM trend means longer vacancies and softer asking-rent achievability than the comps imply.
- What's the recent tenant-quality profile in this submarket — average credit score on applications, eviction rate, late-payment / NSF rate, and stable-employment percentage? A property-management company in the area should have these aggregated.
- How much new for-sale + rental construction is in the pipeline within 1–3 miles? Heavy new supply typically softens prices + rents 12–24 months out; constrained supply supports both.
Investment metrics
- 1% rule
- 0.89% ✗
- Cap rate
- 4.63%
- Cash-on-cash
- -5.93%
- DSCR
- 0.74
- GRM
- 9.4
CMA / ARV
- ARV (median comp)
- $375,317
- List price
- $299,999
- Delta
- -20.07%
- Verdict
- UNDERPRICED
- Comps
- 20 within 1.0 mi
Show comp detail 12 sales within ~0.75 mi
| Address | Dist | Beds/Ba | Sqft | Sold | Price | $/sf | Match |
|---|---|---|---|---|---|---|---|
| 1010 Trickham Dr | 0.20mi | 4/2.5 | 3,010 (+1%) | 2mo | $319,900 | $106 | 88 |
| 1205 Templin Ave | 0.37mi | 4/3.5 | 2,964 (-1%) | 2mo | $326,900 | $110 | 76 |
| 2024 Uvalde Dr | 0.47mi | 4/2.5 | 2,949 (-1%) | 3mo | $345,000 | $117 | 73 |
| 1134 Mount Olive Ln | 0.39mi | 4/2.5 | 2,868 (-4%) | 3mo | $269,900 | $94 | 72 |
| 1113 Mount Olive Ln | 0.44mi | 3/2.5 (-1) | 2,974 (-1%) | 3mo | $309,000 | $104 | 71 |
| 2321 Mount Olive Ln | 0.31mi | 4/3.0 | 2,759 (-8%) | 1mo | $329,900 | $120 | 70 |
| 1031 Trickham Dr | 0.11mi | 4/3.0 | 2,553 (-15%) | 2mo | $329,900 | $129 | 66 |
| 1607 Silas Dr | 0.10mi | 5/3.0 (+1) | 2,559 (-14%) | 1mo | $299,700 | $117 | 64 |
| 1011 Comfort Dr | 0.63mi | 4/2.5 | 2,879 (-4%) | 3mo | $269,900 | $94 | 62 |
| 18142 Lakefront Ct | 0.62mi | 5/3.0 (+1) | 2,859 (-4%) | 2mo | $699,000 | $244 | 55 |
| 1026 Comfort Dr | 0.68mi | 5/3.5 (+1) | 2,811 (-6%) | 1mo | $300,000 | $107 | 48 |
| 5500 Connally Dr | 0.74mi | 4/3.5 | 2,706 (-10%) | 1mo | $329,900 | $122 | 44 |
Match score weights: distance 35% · size 25% · config 20% · recency 20%. Top-matched comps best support the ARV.
Projected returns pro-forma
-3.0% appreciation · 1.42% rent growth · sell at horizon
- IRR
- -28.6%
- Equity multiple
- 0.06×
- Total profit
- $-78,920
- Equity at exit
- $44,731
- IRR
- -37.4%
- Equity multiple
- -0.41×
- Total profit
- $-118,062
- Equity at exit
- $25,938
Cash invested: $84,000 (down + closing). Projections, not guarantees.
Landlord ↔ Tenant lean methodology
- Overall (STATE)
- 87 Strongly Landlord-Friendly
- State Texas
- 87 Strongly Landlord-Friendly · R+5
- County
- — inherits STATE
- City
- — inherits STATE
ZIP-level market 75126
- Rents YoY
- 1.4%
- Active inventory
- 2200
- Price-to-rent
- 9.4×
Monthly cashflow live
- Estimated rent
- $2,658 high interval (Pro) →
- Mortgage (P&I)
- −$1,573
- Tax from tax record
- −$767 /mo · $9,200/yr
- Insurance
- −$125
- HOA
- −$50
- Vacancy / Maint / Mgmt
- −$558
- Net cashflow
- $-415
Break-even live
Sensitivity live
| Price | -10% $-246 | -5% $-331 | +0% $-415 | +5% $-500 | +10% $-585 |
|---|---|---|---|---|---|
| Rent | -10% $-625 | -5% $-520 | +0% $-415 | +5% $-310 | +10% $-205 |
| Rate | -1.0pp $-264 | -0.5pp $-339 | base $-415 | +0.5pp $-493 | +1.0pp $-572 |
UW: 25.0% down · 7.5% · 30yr · 1.5% tax · 5.0% vac · 8.0% maint · 8.0% mgmt
Financing live
Cash to close
- Down payment
- $75,000
- Closing costs
- $9,000
- Reserves months
- —
- Total cash needed
- —
Loan-product check · same deal, 3 products live
Conventional
25% down · 7.5% · 30yr
- Down + closing
- —
- Monthly P&I
- —
- Monthly cashflow
- —
- DSCR
- —
- Eligible?
- —
Personal DTI + credit; lowest rate.
DSCR
20% down · 8.5% · 30yr
- Down + closing
- —
- Monthly P&I
- —
- Monthly cashflow
- —
- DSCR
- —
- Eligible?
- —
No personal income docs; deal must DSCR.
Hard money
10% down · 12.0% · 12mo
- Down + closing
- —
- Monthly P&I
- —
- Monthly cashflow
- —
- DSCR
- —
- Eligible?
- —
Short-term bridge; refi at stabilization.
Rent comps 16 comps
| Address | Beds | Baths | Sqft | Rent | $/sqft | DOM | Units | Dist |
|---|---|---|---|---|---|---|---|---|
| 1078 Norias Dr Heath, TX | 4.0 | 3.0 | 2314 | $2,500 | $1.08 | 5d | 1 | 0.24mi |
| 2907 Doggett Dr Forney, TX | 4.0 | 2.5 | 2139 | $2,950 | $1.38 | 0d | 1 | 0.37mi |
| 1329 Rosenberg Dr Forney, TX | 4.0 | 2.0 | 2000 | $2,100 | $1.05 | 45d | 1 | 0.38mi |
| 2258 Templin Ave Forney, TX | 4.0 | 2.0 | 1988 | $2,300 | $1.16 | 20d | 1 | 0.48mi |
| 2003 Diamondback Forney, TX | 4.0 | 2.5 | 2796 | $2,395 | $0.86 | 14d | 1 | 0.52mi |
| 3127 Maverick Dr Forney, TX | 4.0 | 2.0 | 2129 | $2,750 | $1.29 | 24d | 1 | 0.60mi |
| 1105 Concan Dr Forney, TX | 4.0 | 2.5 | 2859 | $2,299 | $0.80 | 45d | 1 | 0.64mi |
| 3935 Sidney Ln Forney, TX | 4.0 | 2.0 | 2003 | $2,675 | $1.34 | 45d | 1 | 0.66mi |
| 2115 Callahan Dr Forney, TX | 4.0 | 2.5 | 2700 | $2,400 | $0.89 | 45d | 1 | 0.81mi |
| 4031 Yellow Jasmine Ln Forney, TX | 4.0 | 3.0 | 2993 | $3,500 | $1.17 | 45d | 1 | 0.87mi |
| 5672 McClelland St Forney, TX | 4.0 | 2.5 | 1950 | $1,999 | $1.03 | 9d | 1 | 0.94mi |
| 5681 McClelland St Forney, TX | 4.0 | 2.5 | 1950 | $2,070 | $1.06 | 22d | 1 | 0.98mi |
| 1549 Sonnet Dr Forney, TX | 5.0 | 4.0 | 3399 | $3,900 | $1.15 | 26d | 1 | 1.35mi |
| 2130 Clarion Dr Forney, TX | 4.0 | 2.5 | 2348 | $2,550 | $1.09 | 45d | 1 | 1.45mi |
| 2130 Clarion Dr Forney, TX | 4.0 | 3.0 | 2380 | $2,480 | $1.04 | 1d | 1 | 1.45mi |
| 2130 Clarion Dr Forney, TX | 4.0 | 3.0 | 2380 | $2,725 | $1.14 | 18d | 1 | 1.45mi |
HOA detail
- Monthly dues
- $50 · $600/yr
Listing history 35 events
-
2026-06-21days on market $299,999 Active 88 DOM
-
2026-06-18days on market $299,999 Active 85 DOM
-
2026-06-17days on market $299,999 Active 84 DOM
-
2026-06-16days on market $299,999 Active 83 DOM
-
2026-06-15days on market $299,999 Active 82 DOM
-
2026-06-13days on market $299,999 Active 80 DOM
-
2026-06-13days on market $299,999 Active 79 DOM
-
2026-06-09days on market $299,999 Active 76 DOM
-
2026-06-08days on market $299,999 Active 75 DOM
-
2026-06-07days on market $299,999 Active 74 DOM
-
2026-06-04days on market $299,999 Active 71 DOM
-
2026-06-03days on market $299,999 Active 70 DOM
-
2026-06-02days on market $299,999 Active 69 DOM
-
2026-06-02remarks 693-char remark
-
2026-06-02price $299,999 Active 68 DOM
-
2026-06-01days on market $329,999 Active 68 DOM
-
2026-05-31days on market $329,999 Active 67 DOM
-
2026-04-28price $329,999 663-char remark
Show marketing remark (663 chars)
This well-maintained 2-story features 4 bedrooms, 2.5 bathrooms, a 2-car garage, and a host of luxurious features. Built in 2021, this modern gem comes with a limited structural warranty, ensuring peace of mind. Inside, enjoy a game room for movie nights and a flexible space ideal for an office or an extra bedroom. Unlike similar new builds in the area as it has custom light fixtures throughout the home. With an open-concept design, a spa-like primary suite, and a prime location, this home is a rare find. Spacious backyard, perfect for little ones and our furry friends. Don't miss out – schedule a tour today and experience modern living at its best!
-
2026-04-07price $335,000 663-char remark
Show marketing remark (663 chars)
This well-maintained 2-story features 4 bedrooms, 2.5 bathrooms, a 2-car garage, and a host of luxurious features. Built in 2021, this modern gem comes with a limited structural warranty, ensuring peace of mind. Inside, enjoy a game room for movie nights and a flexible space ideal for an office or an extra bedroom. Unlike similar new builds in the area as it has custom light fixtures throughout the home. With an open-concept design, a spa-like primary suite, and a prime location, this home is a rare find. Spacious backyard, perfect for little ones and our furry friends. Don't miss out – schedule a tour today and experience modern living at its best!
-
2026-03-23$340,000 Active 663-char remark
Show marketing remark (663 chars)
This well-maintained 2-story features 4 bedrooms, 2.5 bathrooms, a 2-car garage, and a host of luxurious features. Built in 2021, this modern gem comes with a limited structural warranty, ensuring peace of mind. Inside, enjoy a game room for movie nights and a flexible space ideal for an office or an extra bedroom. Unlike similar new builds in the area as it has custom light fixtures throughout the home. With an open-concept design, a spa-like primary suite, and a prime location, this home is a rare find. Spacious backyard, perfect for little ones and our furry friends. Don't miss out – schedule a tour today and experience modern living at its best!
-
2026-02-18historical
-
2026-01-16price $340,000
-
2025-11-05price $350,000
-
2025-10-14$360,000 Active
-
2025-09-09historical
-
2025-06-25price $360,000
-
2025-06-17price $370,000
-
2025-05-05$385,000 Active
-
2024-03-02historical $2,800
-
2023-12-28$2,800
-
2023-11-02soldstatus
-
2023-10-16soldstatus Closed
-
2023-09-17status Pending
-
2023-09-14historical Active Option Contract
-
2023-08-29$369,000 Active
ⓘ Source: listings_history table (triggers on properties + properties_extension) + one-shot
backfill from property_details.listing_events for pre-trigger history.
Tax reassessment forecast TX · Resets to sale price
- Current annual tax
- $9,200 · $767/mo
- Projected year-2 tax
- $9,200 · $767/mo
- Expected delta
- $0/yr ($0/mo · 0.0%)
ⓘ Screening estimate from a state-policy table — verify with the county assessor before closing.
Climate risk First Street
- Flood 1/10 Low FEMA zone X (unshaded) · 0% chance over 30 yrs
- Wildfire 5/10 Major
- Heat 8/10 Severe 7 d/yr ≥110°F today · 25 d/yr by 30 yrs out
- Wind 6/10 Major 27% chance of damaging wind over 30 yrs
- Air quality 2/10 Low 1 unhealthy d/yr today · 1 by 30 yrs out
Nearby sold comps map
Loading sold comps map…
Walkable amenities ~0.75 mi
Loading nearby amenities…
Taxation est. · year 1
- Rental income
- $31,890
- − Mortgage interest
- −$16,805
- − Property taxes
- −$9,200
- − Insurance
- −$1,500
- − Repairs & maintenance
- −$2,551
- − Management
- −$2,551
- − HOA
- −$600
- − Depreciation
- −$8,727
- Taxable loss
- −$10,044
- Est. tax savings @ 24.0%
- +$2,411
- After-tax cash flow
- $-2,575/yr
For passive investors: Depreciation is non-cash, so a rental often shows a tax loss while cash-flowing — sheltering income. Rental losses are passive: they offset passive income freely, and up to $25,000/yr can offset ordinary (W-2) income if you actively participate and your MAGI is under $100k (phasing out to $0 by $150k); unused losses carry forward. On sale, claimed depreciation is recaptured at up to 25%, and gains may owe capital-gains tax (a 1031 exchange can defer both). Figures are a year-1 estimate at your 24.0% rate — not tax advice; consult a CPA.
Condition & rehab AI · 12 photos
This well-maintained 2021-built home is move-in ready with modern features and a prime location. It offers excellent curb appeal and a spacious backyard, making it a rare find in the area.
Value-add opportunities
- Resale Painting the exterior — Enhances curb appeal and can add value
- Resale Landscaping the front yard — Improves curb appeal and adds value
- Both Upgrading the light fixtures — Modernizes the home and adds value
Renovation cost estimate screening
Value-add ROI direction
- Resale Painting the exterior — Enhances curb appeal and can add value ↑
- Resale Landscaping the front yard — Improves curb appeal and adds value ↑
- Both Upgrading the light fixtures — Modernizes the home and adds value ↑
ⓘ Cost ranges are severity-bucket heuristics (US national rule-of-thumb). Get contractor quotes + a written scope before underwriting a rehab budget.
Schools (NCES district)
- District
- Forney ISD
- NCES district ID
- 4819560
- Math proficiency
- 41% ▼ -20.00%
- Reading proficiency
- 44% ▼ -12.00%
- Median HH income
- $86,679
- Composite
- 40.07/100
- National rank
- #3812
- State rank
- #234 of 826 in TX
Livability — Travis Ranch
- Score
- 61/100
- State rank
- #983
- US rank
- #17440
Category grades
Schools grade is shown separately in the Schools card above.
Census & demographics
- Census place
- Travis Ranch, TX
- County
- Kaufman County · 122,338 people
- City population
- 84,799
- Metro
- Dallas-Fort Worth-Arlington, TX
- Population (ZIP)
- 84,799
- Household income
- $103,673
- Rent vs Own
- Severe rent burden
- 1306.0
Population outlook (Kaufman County) Hauer SSP2
- Today (2025)
- 138,716 people
- By 2030
- 150,815 · +8.7%
- By 2040
- 174,877 · +26.1%
- By 2050
- 198,020 · +42.8%
- By 2075
- 251,908 · +81.6%
- By 2100
- 285,325 · +105.7%
Race, ethnicity, and origin ACS 2023
- Neighborhood character
- Diverse neighborhood (Simpson 0.68)
- Race & ethnicity
- White 45% Black 25% Hispanic / Latino 23% Two or more races 14% Asian 3%
- Hispanic origin (detail)
- Mexican 18% Puerto Rican 1%
- Common ancestry
- Italian 2% Slovak 1% Portuguese 1%
- Foreign-born
- 12% · Canada, Vietnam
- Languages at home
- 79% English-only · Spanish 14% Arabic 1% Vietnamese 1%
Political lean MEDSL · Kaufman
- 2024 margin
- Strong R (+27.9) · D 35.6% · R 63.5%
- 2008→2024 swing
- +7.9pp toward D · 2008: -35.8pp · 2024: -27.9pp
- All cycles
- 2024: R+27.9 2020: R+33.9 2016: R+47.0 2012: R+44.4 2008: R+35.8
Not yet ingested
- Civics
- —
Market trends
- HPI YoY
- ▼ -102.93%
- Current HPI
- 148.5749
- Rent YoY
- ▲ 1.42%
- Metro
- Dallas-Fort Worth-Arlington, TX
- State GDP YoY
- ▲ 3.95%
- F500 in state
- 110
Industry mix (Fortune 500 HQ in TX)
| Industry | F500 HQs | Revenue |
|---|---|---|
| Energy | 16 | $1,198B |
|
||
| Technology | 5 | $198B |
|
||
| Engineering / Construction | 4 | $72B |
|
||
| Energy Services | 3 | $60B |
|
||
| Utilities | 3 | $41B |
|
||
| Healthcare | 2 | $330B |
|
||
Price history
-10.6% since first listed18 events — show timeline
- 2026-04-28 Price Changed $329,999 NTREIS
- 2026-04-07 Price Changed $335,000 NTREIS
- 2026-03-23 Listed $340,000 NTREIS
- 2026-02-18 Listing Removed — NTREIS
- 2026-01-16 Price Changed $340,000 NTREIS
- 2025-11-05 Price Changed $350,000 NTREIS
- 2025-10-14 Listed $360,000 NTREIS
- 2025-09-09 Listing Removed — NTREIS
- 2025-06-25 Price Changed $360,000 NTREIS
- 2025-06-17 Price Changed $370,000 NTREIS
- 2025-05-05 Listed $385,000 NTREIS
- 2024-03-02 Rental Removed $2,800 NTREIS
- 2023-12-28 Listed for Rent $2,800 NTREIS
- 2023-11-02 Sold (Public Records) — Public Records
- 2023-10-16 Sold (MLS) — NTREIS
- 2023-09-17 Pending — NTREIS
- 2023-09-14 Contingent — NTREIS
- 2023-08-29 Listed $369,000 NTREIS
Property tax history
+58.7%/yrLatest (2025): $9,200 · -4.9% YoY. Source: county tax records.
Cash-flow waterfall
monthlySold comps — $/sqft
last 12 mo · ≤1 miLoading sold comps…