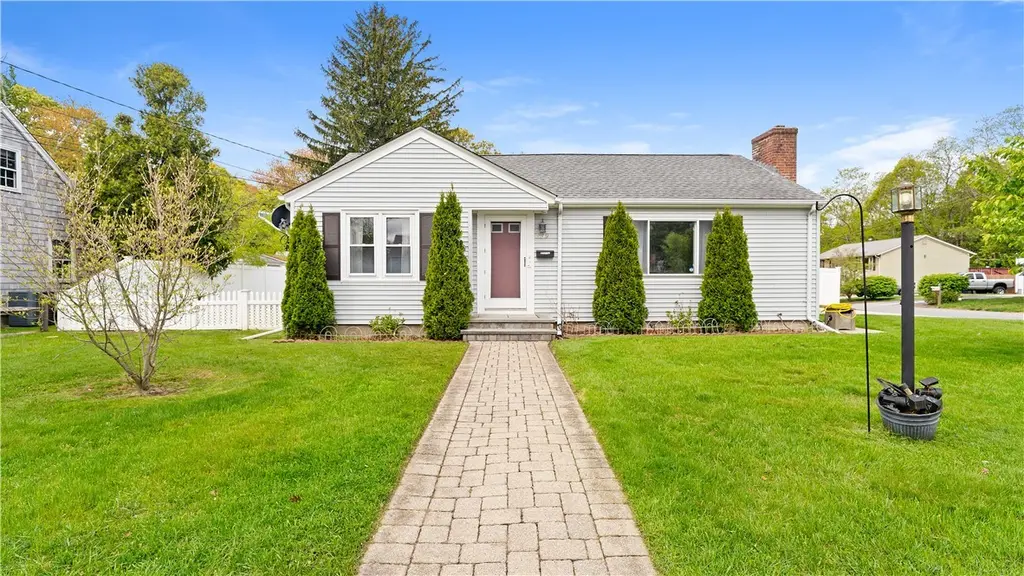
339 George Arden Ave · Warwick, RI
Flood risk 1/10 · Minimal
- FEMA flood zone
- X (unshaded)
- Chance of flooding over 30 yrs
- 0.0%
- Est. flood insurance / yr
- $473 – $860
Fire risk 1/10 · Minimal
- Est. fire insurance / yr
- $835 – $1,551
Heat risk 5/10 · Moderate
- Hot days now (above 96°F)
- 7 days/yr
- Hot days in 30 yrs
- 16 days/yr
Wind risk 6/10 · Moderate
- Chance of severe wind over 30 yrs
- 75.0%
Air-quality risk 2/10 · Minimal
- Unhealthy air days now
- 2 days/yr
- Unhealthy air days in 30 yrs
- 2 days/yr
Risk factors via First Street. Map © Google.
Why this score? — see what drove the F grade
The composite is a weighted blend of 9 inputs, each scored 0–100. Each bar is that input's sub-score; the figure is the points it added to the 100-point composite (weight × sub-score).
- Cash flow +6.8/30.0
- Livability +3.9/5.0
- Rent growth +2.5/5.0
- Condition / age +2.5/5.0
- Schools +2.2/10.0
- ARV discount +1.8/15.0
- 1% rule +1.3/10.0
- DSCR +1.0/10.0
- Appreciation +0.0/10.0
$385,000
🖨 Deal sheet 📄 Offer letter ✓ Due diligence
Listing remarks MLS
Move right in to this updated home in a great neighborhood. This home features an updated modern kitchen and appliances, fire-placed living room with electric insert , large finished basement with a full bath, a generous sized . 25 acre fenced in yard complete with stone patio and shed. Updated roof , windows, heating system and vinyl siding .
Key facts
- Fenced yard
- Updated kitchen
- Granite countertops
Tags
Property features AI
Finance
- HOA & community: Community amenities include golf, marina, pool, public transportation, tennis courts, recreation areas, shopping, restaurants, highway access and proximity to hospital and schools
Exterior
- Parking: No garage; Space for 2 vehicles
- Utilities: Electric service: 100 amps with circuit breakers; Connected water; Septic tank
- Home design: Single-story home; Concrete perimeter foundation; Drywall and vinyl siding exterior
- Construction: Drywall construction; Vinyl siding
- Exterior features: Patio; Paved driveway; Outbuilding; Fenced yard; Corner lot
Interior
- Kitchen: Oven; Range; Microwave; Refrigerator
- Bedrooms: Two first-floor bedrooms (approx. 11.6 x 11.0 and 14.6 x 11.5)
- Flooring: Hardwood; Ceramic tile
- Bathrooms: Two full bathrooms (one on the first floor, one in the lower level)
- Heating & cooling: Gas forced-air heating; Ductless cooling
- Interior features: Thermal windows; Attic; Tub with shower; Tile fireplace
- Laundry & utility: Washer; Dryer; Gas water heater
Neighborhood map
What this means for you Summary
Snapshot
- This is a 2-bed/2.0-bath single-family listed at $385k.
Deal economics
- At list price, monthly cash flow is $-602 ($-7k/yr) — negative.
- To cash-flow at today's rent, offer at most $279k (27.6% below list).
- To meet the 1% rule (rent ≥ 1% of price), the offer needs to be $244k (36.7% below list).
- Recommended offer: $244k (36.7% below list) — sets the bar for 1% rule.
Location & tenants
- Location reads 78/100 on livability (#6 in RI, #2,425 nationally) — a middle-class / working-renter tenant base. Strengths: crime A+, commute A+, housing A+; Watch: schools D+, amenities F.
- Warwick (urban): math 15% / reading 32% proficiency, ranked #25 of 39 in RI (top 64%) — low school quality limits family demand, transient renter base, plan for 1-2y turnover.
- Market conditions: 118 active listings in the ZIP; 10 comparable units currently listed for rent nearby; rentals lingering (median 44d on market — plan ~5-8 weeks vacancy on turnover, expect pricing pressure); 70% of comp listings sitting > 30 days — soft ceiling on asking rent; 471 units permitted in Kent County in 2024 (240 in 5+ unit buildings).
Forward outlook
- Local home prices are declining (-3.0%/yr); year-one equity from $3k of loan paydown is wiped out by about $12k of value loss. Plan a longer hold.
- Kent County population projected at -14% by 2050 — secular population decline; favor cash flow + early exit over multi-decade hold.
Negotiation context
- Only 6 days on market — expect competitive offers; lowballing is unlikely to land.
- 6 sale attempts since 22y ago with the ask held roughly flat each time — persistent listings suggest the price (not the market) is what's stuck; bring a comps-based counter.
Risks & watch-outs
- Watch-outs: built in 1951 — expect roof / HVAC / electrical / plumbing capex.
- Climate carrying-cost: major wind risk, 75% chance of damaging wind over 30y; extreme-heat days projected 7→16/yr by 2055 (HVAC capex compounding) — expect insurance premiums to compound above CPI over the hold.
Questions for the listing agent
- What do current leases actually rent for vs. the listed asking? Can we see a recent rent roll and the last 12 months of T-12 income?
- Built in 1951 — when were the roof, HVAC, electrical panel, plumbing, and water heater last replaced?
- Is there a deadline driving the sale (1031 exchange, divorce, estate, relocation)? That informs how much negotiation room exists.
- Schools are D-rated, which usually means shorter tenancies and higher turnover. Who's the typical renter profile here, and what's been the actual vacancy rate?
- The area grade is low — what's the realistic commute time and amenity access for the typical tenant pool here? Any planned neighborhood developments (good or bad) we should know about?
- What's the average days-on-market for RENTAL listings here right now (not sales)? A rising rental-DOM trend means longer vacancies and softer asking-rent achievability than the comps imply.
- What's the recent tenant-quality profile in this submarket — average credit score on applications, eviction rate, late-payment / NSF rate, and stable-employment percentage? A property-management company in the area should have these aggregated.
- How much new for-sale + rental construction is in the pipeline within 1–3 miles? Heavy new supply typically softens prices + rents 12–24 months out; constrained supply supports both.
Investment metrics
- 1% rule
- 0.63% ✗
- Cap rate
- 4.42%
- Cash-on-cash
- -6.70%
- DSCR
- 0.70
- GRM
- 13.2
CMA / ARV
- ARV (on-the-fly)
- $341,640
- Comps found
- 12
Show comp detail 12 sales within ~0.75 mi
| Address | Dist | Beds/Ba | Sqft | Sold | Price | $/sf | Match |
|---|---|---|---|---|---|---|---|
| 82 Valley Ave | 0.19mi | 3/1.0 (+1) | 960 (+3%) | 1mo | $350,000 | $365 | 77 |
| 45 Tourtelott Ave | 0.13mi | 2/1.0 | 1,008 (+8%) | 3mo | $370,000 | $367 | 75 |
| 3100 Post Rd | 0.31mi | 2/2.0 | 1,040 (+11%) | 13mo | $348,000 | $335 | 56 |
| 82 Myrtle Ave | 0.54mi | 2/1.0 | 972 (+4%) | 13mo | $330,000 | $340 | 54 |
| 28 Wesleyan Ave | 0.55mi | 3/1.0 (+1) | 960 (+3%) | 9mo | $401,000 | $418 | 54 |
| 37 George Arden Ave | 0.58mi | 2/1.0 | 1,008 (+8%) | 5mo | $340,000 | $337 | 52 |
| 83 Myrtle Ave | 0.55mi | 2/1.0 | 986 (+5%) | 12mo | $405,000 | $411 | 52 |
| 794 Main Ave | 0.69mi | 2/1.0 | 988 (+6%) | 8mo | $350,000 | $354 | 48 |
| 12 Barber Ave | 0.64mi | 2/1.0 | 888 (-5%) | 14mo | $335,000 | $377 | 46 |
| 37 Eldridge Ave | 0.59mi | 3/1.0 (+1) | 960 (+3%) | 16mo | $360,000 | $375 | 46 |
| 245 Morse Ave | 0.73mi | 3/1.0 (+1) | 970 (+4%) | 23mo | $300,000 | $309 | 32 |
| 146 Staples Ave | 0.73mi | 3/2.0 (+1) | 1,052 (+12%) | 15mo | $300,000 | $285 | 28 |
Match score weights: distance 35% · size 25% · config 20% · recency 20%. Top-matched comps best support the ARV.
Projected returns pro-forma
-3.0% appreciation · 3.0% rent growth · sell at horizon
- IRR
- -27.9%
- Equity multiple
- 0.07×
- Total profit
- $-100,756
- Equity at exit
- $57,405
- IRR
- -26.7%
- Equity multiple
- -0.27×
- Total profit
- $-137,271
- Equity at exit
- $33,288
Cash invested: $107,800 (down + closing). Projections, not guarantees.
Landlord ↔ Tenant lean methodology
- Overall (STATE)
- 31 Tenant-Leaning
- State Rhode Island
- 31 Tenant-Leaning · D+8
- County
- — inherits STATE
- City
- — inherits STATE
ZIP-level market 02886
- Active inventory
- 118
- Price-to-rent
- 13.2×
Monthly cashflow live
- Estimated rent
- $2,435 high interval (Pro) →
- Mortgage (P&I)
- −$2,019
- Tax from tax record
- −$346 /mo · $4,155/yr
- Insurance
- −$160
- HOA
- −$0
- Vacancy / Maint / Mgmt
- −$511
- Net cashflow
- $-602
Break-even live
UW: 25.0% down · 7.5% · 30yr · 1.5% tax · 5.0% vac · 8.0% maint · 8.0% mgmt
Financing live
Cash to close
- Down payment
- $96,250
- Closing costs
- $11,550
- Reserves months
- —
- Total cash needed
- —
Loan-product check · same deal, 3 products live
Conventional
25% down · 7.5% · 30yr
- Down + closing
- —
- Monthly P&I
- —
- Monthly cashflow
- —
- DSCR
- —
- Eligible?
- —
Personal DTI + credit; lowest rate.
DSCR
20% down · 8.5% · 30yr
- Down + closing
- —
- Monthly P&I
- —
- Monthly cashflow
- —
- DSCR
- —
- Eligible?
- —
No personal income docs; deal must DSCR.
Hard money
10% down · 12.0% · 12mo
- Down + closing
- —
- Monthly P&I
- —
- Monthly cashflow
- —
- DSCR
- —
- Eligible?
- —
Short-term bridge; refi at stabilization.
Rent comps 10 comps
| Address | Beds | Baths | Sqft | Rent | $/sqft | DOM | Units | Dist |
|---|---|---|---|---|---|---|---|---|
| 3524 W Shore Rd #505 Warwick, RI | 2.0 | 1.5 | 1100 | $2,500 | $2.27 | 44d | 1 | 0.23mi |
| 3524 W Shore Rd Warwick, RI | 1.0–2.0 | 1.0–1.5 | 910 | $2,500 | $2.75 | 44d | 2 | 0.23mi |
| 85 Pleasant St Warwick, RI | 1.0 | 1.0 | 528 | $1,300 | $2.46 | 44d | 1 | 0.48mi |
| 207 Main Ave Warwick, RI | 1.0 | 1.0 | 768 | $2,800 | $3.65 | 44d | 1 | 0.95mi |
| 168 Main Ave Warwick, RI | 2.0 | 1.0 | 800 | $2,500 | $3.12 | 17d | 1 | 0.98mi |
| 3595 Post Rd Warwick, RI | 1.0–2.0 | 1.0–2.0 | 951 | $2,750 | $2.89 | 1d | 8 | 1.08mi |
| 165 Haverhill Ave Warwick, RI | 3.0 | 1.0 | 902 | $2,700 | $2.99 | 44d | 1 | 1.15mi |
| 956 Brighton Way Warwick, RI | 2.0 | 2.0 | 1065 | $2,500 | $2.35 | 44d | 1 | 1.37mi |
| 5 Moccasin Dr Warwick, RI | 2.0 | 1.0 | 930 | $2,350 | $2.53 | 17d | 1 | 1.39mi |
| 141 Edaville Ct Warwick, RI | 2.0 | 2.0 | 1095 | $2,400 | $2.19 | 44d | 1 | 1.39mi |
Listing history 19 events
-
2026-05-19$385,000 Active
-
2023-12-04soldstatus $344,000 Closed 345-char remark
Show marketing remark (345 chars)
Move right in to this updated home in a great neighborhood. This home features an updated modern kitchen and appliances, fire-placed living room with electric insert , large finished basement with a full bath, a generous sized . 25 acre fenced in yard complete with stone patio and shed. Updated roof , windows, heating system and vinyl siding .
-
2023-11-07status Pending 345-char remark
Show marketing remark (345 chars)
Move right in to this updated home in a great neighborhood. This home features an updated modern kitchen and appliances, fire-placed living room with electric insert , large finished basement with a full bath, a generous sized . 25 acre fenced in yard complete with stone patio and shed. Updated roof , windows, heating system and vinyl siding .
-
2023-11-02$340,000 Active 345-char remark
Show marketing remark (345 chars)
Move right in to this updated home in a great neighborhood. This home features an updated modern kitchen and appliances, fire-placed living room with electric insert , large finished basement with a full bath, a generous sized . 25 acre fenced in yard complete with stone patio and shed. Updated roof , windows, heating system and vinyl siding .
-
2019-10-10soldstatus $234,900 Closed 246-char remark
Show marketing remark (246 chars)
Beautiful updated ranch. New; roof, windows, Kitchen w/ island open to fireplaced livingroom, furnace and hot water. Refinished hardwoods on first and new carpet in basement. 2 full baths. White vinyl fenced big backyard with patio area and shed.
-
2019-10-10soldstatus $234,900
Show marketing remark (246 chars)
Beautiful updated ranch. New; roof, windows, Kitchen w/ island open to fireplaced livingroom, furnace and hot water. Refinished hardwoods on first and new carpet in basement. 2 full baths. White vinyl fenced big backyard with patio area and shed.
-
2019-09-16status Pending 246-char remark
Show marketing remark (246 chars)
Beautiful updated ranch. New; roof, windows, Kitchen w/ island open to fireplaced livingroom, furnace and hot water. Refinished hardwoods on first and new carpet in basement. 2 full baths. White vinyl fenced big backyard with patio area and shed.
-
2019-07-11status Pending 246-char remark
Show marketing remark (246 chars)
Beautiful updated ranch. New; roof, windows, Kitchen w/ island open to fireplaced livingroom, furnace and hot water. Refinished hardwoods on first and new carpet in basement. 2 full baths. White vinyl fenced big backyard with patio area and shed.
-
2019-06-29$234,900 Active 246-char remark
Show marketing remark (246 chars)
Beautiful updated ranch. New; roof, windows, Kitchen w/ island open to fireplaced livingroom, furnace and hot water. Refinished hardwoods on first and new carpet in basement. 2 full baths. White vinyl fenced big backyard with patio area and shed.
-
2016-07-29soldstatus $140,100 Sold
-
2016-03-21status Pending
-
2016-03-18status Active - Back on Market
-
2016-02-05status Pending
-
2016-01-23$140,000 Active - New
-
2004-07-14soldstatus $214,000
-
2004-06-10historical
-
2004-06-05$214,900
-
2000-01-31soldstatus $95,500
-
1992-01-10soldstatus $91,000
ⓘ Source: listings_history table (triggers on properties + properties_extension) + one-shot
backfill from property_details.listing_events for pre-trigger history.
Tax reassessment forecast RI · Partial reset (capped growth)
- Current annual tax
- $4,155 · $346/mo
- Projected year-2 tax
- $5,215 · $435/mo
- Expected delta
- +$1,060/yr (+$88/mo · 25.5%)
ⓘ Screening estimate from a state-policy table — verify with the county assessor before closing.
Climate risk First Street
- Flood 1/10 Low FEMA zone X (unshaded) · 0% chance over 30 yrs
- Wildfire 1/10 Low
- Heat 5/10 Major 7 d/yr ≥96°F today · 16 d/yr by 30 yrs out
- Wind 6/10 Major 75% chance of damaging wind over 30 yrs
- Air quality 2/10 Low 2 unhealthy d/yr today · 2 by 30 yrs out
Nearby sold comps map
Loading sold comps map…
Walkable amenities ~0.75 mi
Loading nearby amenities…
Taxation est. · year 1
- Rental income
- $29,224
- − Mortgage interest
- −$21,566
- − Property taxes
- −$4,155
- − Insurance
- −$1,925
- − Repairs & maintenance
- −$2,338
- − Management
- −$2,338
- − Depreciation
- −$11,200
- Taxable loss
- −$14,297
- Est. tax savings @ 24.0%
- +$3,431
- After-tax cash flow
- $-3,789/yr
For passive investors: Depreciation is non-cash, so a rental often shows a tax loss while cash-flowing — sheltering income. Rental losses are passive: they offset passive income freely, and up to $25,000/yr can offset ordinary (W-2) income if you actively participate and your MAGI is under $100k (phasing out to $0 by $150k); unused losses carry forward. On sale, claimed depreciation is recaptured at up to 25%, and gains may owe capital-gains tax (a 1031 exchange can defer both). Figures are a year-1 estimate at your 24.0% rate — not tax advice; consult a CPA.
Schools (NCES district)
- District
- Warwick
- NCES district ID
- 4401110
- Math proficiency
- 15% ▼ -11.00%
- Reading proficiency
- 32% ▼ -7.00%
- Median HH income
- $63,420
- Composite
- 22.03/100
- National rank
- #8203
- State rank
- #25 of 39 in RI
Livability — Warwick
- Score
- 78/100
- State rank
- #6
- US rank
- #2425
Category grades
Schools grade is shown separately in the Schools card above.
Census & demographics
- Census place
- Warwick, RI
- City population
- 108,434
- Population (ZIP)
- 30,925
Population outlook (Kent County) Hauer SSP2
- Today (2025)
- 160,994 people
- By 2030
- 157,428 · -2.2%
- By 2040
- 148,389 · -7.8%
- By 2050
- 137,995 · -14.3%
- By 2075
- 118,536 · -26.4%
- By 2100
- 102,266 · -36.5%
Race, ethnicity, and origin ACS 2023
- Neighborhood character
- Predominantly White (85%)
- Race & ethnicity
- White 85% Two or more races 6% Hispanic / Latino 5% Asian 4% Black 2%
- Common ancestry
- Lithuanian 8% Russian 7% Romanian 3%
- Foreign-born
- 7% · Canada
- Languages at home
- 91% English-only · Spanish 2% Other Asian/Pacific 2% Other Indo-European 2%
Political lean MEDSL · Kent
- 2024 margin
- Toss-up / Even · D 49.9% · R 48.1% · Other 2.0%
- 2008→2024 swing
- -15.6pp toward R · 2008: 17.5pp · 2024: 1.9pp
- All cycles
- 2024: D+1.9 2020: D+7.6 2016: R+0.7 2012: D+18.4 2008: D+17.5
Not yet ingested
- Civics
- —
Market trends
- HPI YoY
- ▼ -425.54%
- Current HPI
- 350.8111
- Rent YoY
- —
- Metro
- —
- State GDP YoY
- ▲ 2.25%
- F500 in state
- 10
Industry mix (Fortune 500 HQ in RI)
| Industry | F500 HQs | Revenue |
|---|---|---|
| Healthcare | 1 | $373B |
|
||
| Food Distribution | 1 | $31B |
|
||
| Aerospace / Defense | 1 | $14B |
|
||
| Financial Services | 1 | $8B |
|
||
| Consumer Goods | 1 | $4B |
|
||
Price history
+323.1% since first listed19 events — show timeline
- 2026-05-19 Listed $385,000 RIS
- 2023-12-04 Sold (MLS) $344,000 RIS
- 2023-11-07 Pending — RIS
- 2023-11-02 Listed $340,000 RIS
- 2019-10-10 Sold (Public Records) $234,900 Public Records
- 2019-10-10 Sold (MLS) $234,900 RIS
- 2019-09-16 Pending — RIS
- 2019-07-11 Pending — RIS
- 2019-06-29 Listed $234,900 RIS
- 2016-07-29 Sold (MLS) $140,100 RIS
- 2016-03-21 Pending — RIS
- 2016-03-18 Relisted — RIS
- 2016-02-05 Pending — RIS
- 2016-01-23 Listed $140,000 RIS
- 2004-07-14 Sold (MLS) $214,000 RIS
- 2004-06-10 Listing Removed — RIS
- 2004-06-05 Listed $214,900 RIS
- 2000-01-31 Sold (Public Records) $95,500 Public Records
- 1992-01-10 Sold (Public Records) $91,000 Public Records
Property tax history
+3.0%/yrLatest (2025): $4,155 · +2.6% YoY. Source: county tax records.
Cash-flow waterfall
monthlySold comps — $/sqft
last 12 mo · ≤1 miLoading sold comps…