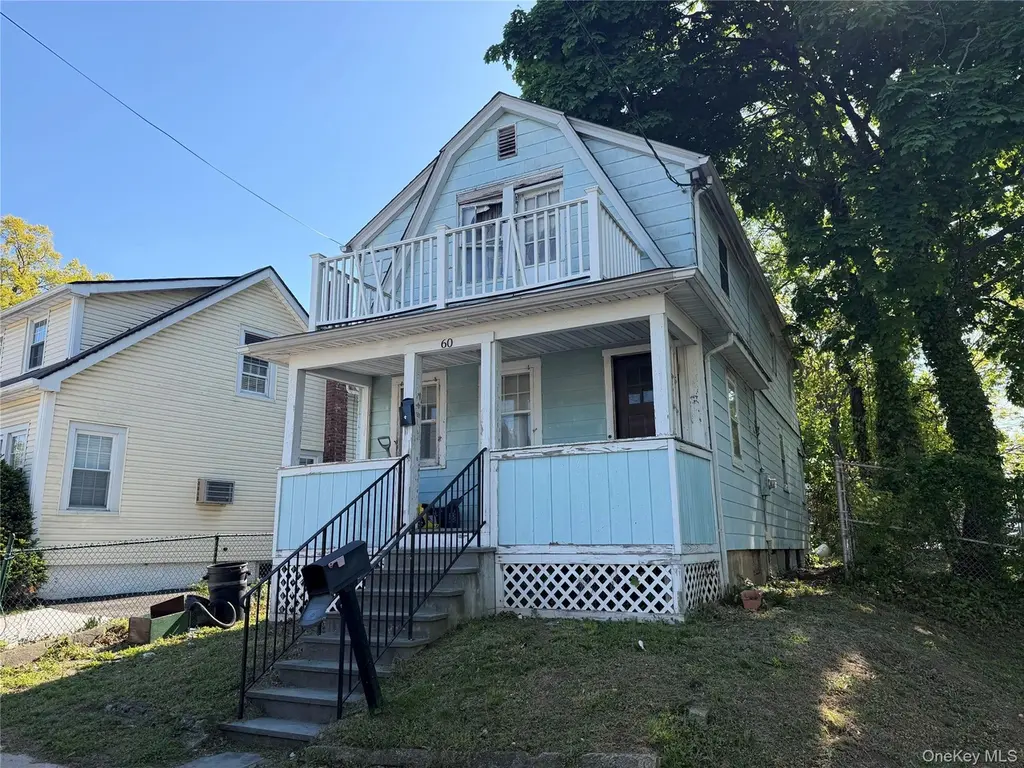
60 Acorn Ter · New Rochelle, NY
Flood risk 1/10 · Minimal
- FEMA flood zone
- X (unshaded)
- Chance of flooding over 30 yrs
- 0.0%
- Est. flood insurance / yr
- $473 – $860
Fire risk 1/10 · Minimal
- Est. fire insurance / yr
- $691 – $1,283
Heat risk 7/10 · Major
- Hot days now (above 98°F)
- 7 days/yr
- Hot days in 30 yrs
- 16 days/yr
Wind risk 6/10 · Moderate
- Chance of severe wind over 30 yrs
- 27.0%
Air-quality risk 5/10 · Moderate
- Unhealthy air days now
- 6 days/yr
- Unhealthy air days in 30 yrs
- 8 days/yr
Risk factors via First Street. Map © Google.
Why this score? — see what drove the C grade
The composite is a weighted blend of 9 inputs, each scored 0–100. Each bar is that input's sub-score; the figure is the points it added to the 100-point composite (weight × sub-score).
- Cash flow +21.2/30.0
- ARV discount +7.5/15.0
- DSCR +6.8/10.0
- Schools +5.7/10.0
- 1% rule +5.6/10.0
- Livability +3.5/5.0
- Rent growth +2.9/5.0
- Condition / age +2.5/5.0
- Appreciation +0.0/10.0
$379,000
🖨 Deal sheet 📄 Offer letter ✓ Due diligence
Listing remarks
3 bedroom, 1 bathroom single family home on a dead end street in need of complete renovation. Financing extremely difficult for this property due to condition. Taxes under $6,000 per year not including STAR Program. Home being sold "as is".
Key facts
- 2,178 sq ft lot
- Garage
- Built 1922
Property features AI
Exterior
- Parking: Detached garage; 1 garage space; No carport
- Utilities: Con-Edison electric; Public sewer; Electricity connected; Natural gas connected; Public water connected
- Home design: Single family residence
- Construction: Frame construction
- Exterior features: Frame construction; Not waterfront
Interior
- Kitchen: No appliances included
- Bathrooms: 1 full bathroom
- Heating & cooling: Oil heating; Other heating; No central cooling
- Interior features: Other interior features; Unfinished basement; Attic storage; Two levels; 6 total rooms
Neighborhood map
What this means for you Summary
Snapshot
- This is a 3-bed/2.0-bath single-family listed at $379k.
Deal economics
- At list price, monthly cash flow is $550 ($7k/yr) — positive.
- The deal already cash-flows at list — no discount required.
- Meets the 1% rule at list price ($4k rent vs $379k).
- Cap rate 8.0% vs local median 4.5% in New Rochelle — top-decile yield for the area; either an underpriced asset or a hidden risk that comps aren't pricing in. Stress-test before assuming the spread holds.
Location & tenants
- Location reads 69/100 on livability (#487 in NY) — a middle-class / working-renter tenant base. Strengths: employment A+, crime A, amenities B+; Watch: housing D+, commute F, cost of living F.
- New Rochelle City School District (suburban): math 63% / reading 66% proficiency, ranked #171 of 590 in NY (top 29%) — acceptable for families but not a draw, mixed tenant base, ~2y average lease.
- Zoned schools: Trinity Elementary School (math 40% / reading 47%, grade F, #1,350 of 2,108 statewide, top 64%, 863 students, 66% FRL); Isaac E Young Middle School (math 47% / reading 62%, grade B-, #214 of 729 statewide, top 31%, 1,138 students, 76% FRL); New Rochelle High School (math 87% / reading 72%, grade A-, #518 of 1,100 statewide, top 51%, 3,076 students, 57% FRL) — zoned schools average 67% FRL vs 41% district-wide (26 pts higher); higher-poverty schools than district average — tighter screening recommended.
- Market conditions: Rents rising (+1.4%/yr); 138 active listings in the ZIP; 38 comparable units currently listed for rent nearby; rentals leasing fast (median 8d on market — plan ~1-2 weeks tenant-placement turnaround); solid renter incomes; 954 units permitted in Westchester County in 2024 (649 in 5+ unit buildings).
- At $4,016/mo this rent would consume 56% of the median local household income ($86k/yr) (locally 2797% of renters already pay >50% of income on rent) — very limited rent-growth headroom before tenants either downsize or default.
Forward outlook
- Local home prices are declining (-3.0%/yr); year-one equity from $3k of loan paydown is wiped out by about $11k of value loss. Plan a longer hold.
- Westchester County population projected at +10% by 2050 — modest demand growth; plan on rents tracking national, not racing it.
Negotiation context
- Only 4 days on market — expect competitive offers; lowballing is unlikely to land.
Risks & watch-outs
- Watch-outs: built in 1922 — expect roof / HVAC / electrical / plumbing capex.
- Climate carrying-cost: major wind risk, 27% chance of damaging wind over 30y; extreme-heat days projected 7→16/yr by 2055 (HVAC capex compounding) — expect insurance premiums to compound above CPI over the hold.
Questions for the listing agent
- Built in 1922 — when were the roof, HVAC, electrical panel, plumbing, and water heater last replaced?
- Is there a deadline driving the sale (1031 exchange, divorce, estate, relocation)? That informs how much negotiation room exists.
- What's the average days-on-market for RENTAL listings here right now (not sales)? A rising rental-DOM trend means longer vacancies and softer asking-rent achievability than the comps imply.
- What's the recent tenant-quality profile in this submarket — average credit score on applications, eviction rate, late-payment / NSF rate, and stable-employment percentage? A property-management company in the area should have these aggregated.
- How much new for-sale + rental construction is in the pipeline within 1–3 miles? Heavy new supply typically softens prices + rents 12–24 months out; constrained supply supports both.
Investment metrics
- 1% rule
- 1.06% ✓
- Cap rate
- 8.03%
- Cash-on-cash
- 6.22%
- DSCR
- 1.28
- GRM
- 7.9
CMA / ARV
- ARV (median comp)
- $777,718
- List price
- $379,000
- Delta
- -51.27%
- Verdict
- UNDERPRICED
- Comps
- 20 within 1.0 mi
Show comp detail 12 sales within ~0.75 mi
| Address | Dist | Beds/Ba | Sqft | Sold | Price | $/sf | Match |
|---|---|---|---|---|---|---|---|
| 103 Petersville Rd | 0.18mi | 3/1.5 | 1,458 (+5%) | 0mo | $770,000 | $528 | 81 |
| 61 Monroe St | 0.24mi | 3/1.0 | 1,340 (-4%) | 12mo | $720,000 | $537 | 69 |
| 30 Lispenard Ave | 0.30mi | 3/1.0 | 1,538 (+11%) | 6mo | $725,000 | $471 | 59 |
| 71 Brookside Pl | 0.57mi | 3/1.0 | 1,449 (+4%) | 9mo | $630,000 | $435 | 55 |
| 5 Ashland St | 0.61mi | 3/2.0 | 1,500 (+8%) | 6mo | $610,000 | $407 | 53 |
| 67 Treno St | 0.57mi | 3/2.0 | 1,300 (-6%) | 13mo | $692,525 | $533 | 52 |
| 43 Pinebrook Rd | 0.70mi | 3/1.5 | 1,500 (+8%) | 7mo | $725,000 | $483 | 46 |
| 60 Hillcrest Ave | 0.71mi | 3/2.0 | 1,500 (+8%) | 10mo | $855,000 | $570 | 45 |
| 7 Edgewater Pl | 0.74mi | 3/2.5 | 1,240 (-11%) | 7mo | $805,000 | $649 | 40 |
| 7 Parkland Ave | 0.68mi | 3/2.0 | 1,588 (+14%) | 7mo | $700,000 | $441 | 39 |
| 27 Ellenton Ave | 0.61mi | 3/1.5 | 1,211 (-13%) | 14mo | $660,000 | $545 | 37 |
| 34 State St | 0.63mi | 2/2.0 (-1) | 1,200 (-14%) | 12mo | $730,000 | $608 | 33 |
Match score weights: distance 35% · size 25% · config 20% · recency 20%. Top-matched comps best support the ARV.
Projected returns pro-forma
-3.0% appreciation · 1.42% rent growth · sell at horizon
- IRR
- -8.5%
- Equity multiple
- 0.69×
- Total profit
- $-32,631
- Equity at exit
- $56,510
- IRR
- -1.2%
- Equity multiple
- 0.92×
- Total profit
- $-8,069
- Equity at exit
- $32,769
Cash invested: $106,120 (down + closing). Projections, not guarantees.
Landlord ↔ Tenant lean methodology
- Overall (STATE)
- 15 Strongly Tenant-Friendly
- State New York
- 15 Strongly Tenant-Friendly · D+10
- County
- — inherits STATE
- City
- — inherits STATE
ZIP-level market 10801
- Rents YoY
- 1.4%
- Active inventory
- 138
- Price-to-rent
- 7.9×
Monthly cashflow live
- Estimated rent
- $4,016 high interval (Pro) →
- Mortgage (P&I)
- −$1,988
- Tax from tax record
- −$478 /mo · $5,730/yr
- Insurance
- −$158
- HOA
- −$0
- Vacancy / Maint / Mgmt
- −$843
- Net cashflow
- $550
Break-even live
UW: 25.0% down · 7.5% · 30yr · 1.5% tax · 5.0% vac · 8.0% maint · 8.0% mgmt
Financing live
Cash to close
- Down payment
- $94,750
- Closing costs
- $11,370
- Reserves months
- —
- Total cash needed
- —
Loan-product check · same deal, 3 products live
Conventional
25% down · 7.5% · 30yr
- Down + closing
- —
- Monthly P&I
- —
- Monthly cashflow
- —
- DSCR
- —
- Eligible?
- —
Personal DTI + credit; lowest rate.
DSCR
20% down · 8.5% · 30yr
- Down + closing
- —
- Monthly P&I
- —
- Monthly cashflow
- —
- DSCR
- —
- Eligible?
- —
No personal income docs; deal must DSCR.
Hard money
10% down · 12.0% · 12mo
- Down + closing
- —
- Monthly P&I
- —
- Monthly cashflow
- —
- DSCR
- —
- Eligible?
- —
Short-term bridge; refi at stabilization.
Rent comps 38 comps
| Address | Beds | Baths | Sqft | Rent | $/sqft | DOM | Units | Dist |
|---|---|---|---|---|---|---|---|---|
| 48 Lincoln St New Rochelle, NY | 2.0 | 1.0 | 1273 | $3,000 | $2.36 | 19d | 1 | 0.35mi |
| 10 Commerce Dr New Rochelle, NY | 2.0 | 1.0–2.0 | 792 | $3,812 | $4.81 | 1d | 11 | 0.50mi |
| 55 Moran Pl Unit 55A New Rochelle, NY | 2.0 | 1.5 | 1200 | $3,850 | $3.21 | 44d | 1 | 0.60mi |
| 175 Huguenot St #1402 New Rochelle, NY | 2.0 | 2.5 | 1475 | $4,750 | $3.22 | 25d | 1 | 0.61mi |
| 14 Horton Ave Unit 3rd Fl New Rochelle, NY | 4.0 | 1.0 | 1300 | $3,600 | $2.77 | 44d | 1 | 0.66mi |
| 26 Coligni Ave Apt 12 New Rochelle, NY | 3.0 | 1.0 | 1100 | $3,950 | $3.59 | 44d | 1 | 0.72mi |
| 600 North Ave New Rochelle, NY | 2.0 | 1.0–2.0 | 869 | $4,350 | $5.01 | 2d | 11 | 0.72mi |
| 10 Lecount Pl New Rochelle, NY | 2.0 | 1.0–2.0 | 740 | $5,113 | $6.90 | 1d | 14 | 0.73mi |
| 25 Acacia Ter Unit 1 New Rochelle, NY | 3.0 | 2.0 | 1400 | $3,800 | $2.71 | 44d | 1 | 0.76mi |
| 1 Shearwood Pl New Rochelle, NY | 3.0 | 1.0–2.0 | 896 | $4,340 | $4.84 | 3d | 31 | 0.77mi |
| 7 Alpha Pl Unit First floor New Rochelle, NY | 3.0 | 2.0 | 1538 | $4,700 | $3.06 | 19d | 1 | 0.78mi |
| 72 Soundview St Unit 2 New Rochelle, NY | 4.0 | 2.0 | 1500 | $3,850 | $2.57 | 44d | 1 | 0.82mi |
| 12 Church St New Rochelle, NY | 2.0 | 1.0–2.0 | 770 | $4,540 | $5.90 | 3d | 50 | 0.86mi |
| 40 Memorial Hwy New Rochelle, NY | 3.0 | 1.0–2.0 | 917 | $5,225 | $5.69 | 1d | 51 | 0.86mi |
| 22 Clove Rd Unit 24C New Rochelle, NY | 3.0 | 1.0 | 1035 | $3,300 | $3.19 | 44d | 1 | 0.89mi |
| 22 Clove Rd New Rochelle, NY | 3.0 | 1.0 | 900 | $3,600 | $4.00 | 44d | 1 | 0.89mi |
| 55 Clinton Pl New Rochelle, NY | 2.0 | 1.0–2.0 | 910 | $5,214 | $5.73 | 1d | 28 | 0.91mi |
| 133 Lincoln Ave Unit 1 New Rochelle, NY | 3.0 | 1.0 | 1112 | $6,500 | $5.85 | 3d | 1 | 0.92mi |
| 139 Sickles Ave Unit 2 New Rochelle, NY | 2.0 | 1.5 | 1000 | $3,100 | $3.10 | 21d | 1 | 0.92mi |
| 50 Clinton Pl New Rochelle, NY | 2.0 | 1.0–2.0 | 844 | $7,811 | $9.25 | 1d | 31 | 0.93mi |
| 325 Huguenot St New Rochelle, NY | 1.0–2.0 | 1.0–2.0 | 989 | $4,625 | $4.68 | 5d | 8 | 0.94mi |
| 25 Leroy Pl #1 New Rochelle, NY | 2.0 | 2.5 | 1420 | $3,995 | $2.81 | 7d | 1 | 0.97mi |
| 123 Clinton Ave Unit 2 New Rochelle, NY | 4.0 | 2.0 | 1378 | $4,250 | $3.08 | 44d | 1 | 0.98mi |
| 333 Huguenot St New Rochelle, NY | 2.0 | 1.0–2.0 | 853 | $4,785 | $5.61 | 3d | 12 | 0.98mi |
| 360 Huguenot St New Rochelle, NY | 2.0 | 1.0–2.0 | 764 | $3,780 | $4.94 | 2d | 15 | 1.03mi |
| 379 Huguenot St Unit 2 New Rochelle, NY | 3.0 | 1.0 | 1150 | $3,200 | $2.78 | 25d | 1 | 1.06mi |
| 111 Centre Ave New Rochelle, NY | 1.0–2.0 | 1.0–2.0 | 787 | $3,987 | $5.07 | 1d | 17 | 1.07mi |
| 387 Huguenot St New Rochelle, NY | 2.0 | 1.0–2.0 | 753 | $3,575 | $4.75 | 5d | 6 | 1.08mi |
| 194 Webster Ave Unit 1 New Rochelle, NY | 3.0 | 1.0 | 1050 | $3,500 | $3.33 | 44d | 1 | 1.12mi |
| 25 Maple Ave New Rochelle, NY | 2.0 | 1.0–2.0 | 748 | $3,897 | $5.21 | 5d | 12 | 1.12mi |
| 52 Wendt Ave Larchmont, NY | 3.0 | 1.5 | 1656 | $8,950 | $5.40 | 1d | 1 | 1.18mi |
| 220 Pelham Rd New Rochelle, NY | 1.0–2.0 | 1.0 | 900 | $2,595 | $2.88 | 12d | 2 | 1.25mi |
| 220 Pelham Rd New Rochelle, NY | 1.0–2.0 | 1.0 | 862 | $2,595 | $3.01 | 1d | 2 | 1.25mi |
| 220 Pelham Rd Unit 5E New Rochelle, NY | 2.0 | 1.0 | 1000 | $2,595 | $2.60 | 7d | 1 | 1.25mi |
| 274 Lockwood Ave Unit First floor New Rochelle, NY | 2.0 | 1.0 | 908 | $2,700 | $2.97 | 44d | 1 | 1.25mi |
| 79 Edgewood Ave Larchmont, NY | 4.0 | 3.0 | 1786 | $7,800 | $4.37 | 1d | 1 | 1.35mi |
| 36 4th St Unit One New Rochelle, NY | 2.0 | 1.0 | 900 | $2,900 | $3.22 | 5d | 1 | 1.36mi |
| 1833 Palmer Ave Unit 3K Larchmont, NY | 2.0 | 1.0 | 875 | $2,700 | $3.09 | 44d | 1 | 1.39mi |
Listing history 1 events
-
2026-05-04$379,000 Active
ⓘ Source: listings_history table (triggers on properties + properties_extension) + one-shot
backfill from property_details.listing_events for pre-trigger history.
Tax reassessment forecast NY · Partial reset (capped growth)
- Current annual tax
- $5,730 · $478/mo
- Projected year-2 tax
- $6,068 · $506/mo
- Expected delta
- +$337/yr (+$28/mo · 5.9%)
ⓘ Screening estimate from a state-policy table — verify with the county assessor before closing.
Climate risk First Street
- Flood 1/10 Low FEMA zone X (unshaded) · 0% chance over 30 yrs
- Wildfire 1/10 Low
- Heat 7/10 Severe 7 d/yr ≥98°F today · 16 d/yr by 30 yrs out
- Wind 6/10 Major 27% chance of damaging wind over 30 yrs
- Air quality 5/10 Major 6 unhealthy d/yr today · 8 by 30 yrs out
Nearby sold comps map
Loading sold comps map…
Walkable amenities ~0.75 mi
Loading nearby amenities…
Taxation est. · year 1
- Rental income
- $48,191
- − Mortgage interest
- −$21,230
- − Property taxes
- −$5,730
- − Insurance
- −$1,895
- − Repairs & maintenance
- −$3,855
- − Management
- −$3,855
- − Depreciation
- −$11,025
- Taxable income
- $600
- Est. tax owed @ 24.0%
- −$144
- After-tax cash flow
- $6,452/yr
For passive investors: Depreciation is non-cash, so a rental often shows a tax loss while cash-flowing — sheltering income. Rental losses are passive: they offset passive income freely, and up to $25,000/yr can offset ordinary (W-2) income if you actively participate and your MAGI is under $100k (phasing out to $0 by $150k); unused losses carry forward. On sale, claimed depreciation is recaptured at up to 25%, and gains may owe capital-gains tax (a 1031 exchange can defer both). Figures are a year-1 estimate at your 24.0% rate — not tax advice; consult a CPA.
Schools (NCES district)
- District
- New Rochelle City School District
- NCES district ID
- 3620490
- Math proficiency
- 63% ▲ 3.00%
- Reading proficiency
- 66% ▲ 9.00%
- Median HH income
- $69,165
- Composite
- 56.63/100
- National rank
- #1139
- State rank
- #171 of 590 in NY
Livability — New Rochelle
- Score
- 69/100
- State rank
- #487
- US rank
- #8572
Category grades
Schools grade is shown separately in the Schools card above.
Census & demographics
- Census place
- New Rochelle, NY
- County
- Westchester County · 709,332 people
- City population
- 63,657
- Metro
- New York-Newark-Jersey City, NY-NJ-PA
- Population (ZIP)
- 42,754
- Household income
- $85,573
- Rent vs Own
- Severe rent burden
- 2797.0
Population outlook (Westchester County) Hauer SSP2
- Today (2025)
- 1,028,035 people
- By 2030
- 1,051,636 · +2.3%
- By 2040
- 1,098,520 · +6.9%
- By 2050
- 1,136,044 · +10.5%
- By 2075
- 1,196,925 · +16.4%
- By 2100
- 1,175,147 · +14.3%
Race, ethnicity, and origin ACS 2023
- Neighborhood character
- Highly diverse neighborhood (Simpson 0.72)
- Race & ethnicity
- Hispanic / Latino 36% White 30% Black 24% Two or more races 16% Asian 7%
- Hispanic origin (detail)
- Mexican 17% Puerto Rican 5% Dominican 3%
- Common ancestry
- Hispanic 3% Scotch-Irish 1% Romanian 1%
- Foreign-born
- 34% · Canada, Jamaica, China
- Languages at home
- 54% English-only · Spanish 32% Other Indo-European 5% French/Haitian/Cajun 4%
Political lean MEDSL · Westchester
- 2024 margin
- Strong D (+26.3) · D 63.1% · R 36.9%
- 2008→2024 swing
- -1.3pp toward R · 2008: 27.6pp · 2024: 26.3pp
- All cycles
- 2024: D+26.3 2020: D+36.3 2016: D+32.8 2012: D+22.2 2008: D+27.6
Not yet ingested
- Civics
- —
Market trends
- HPI YoY
- ▼ -910.37%
- Current HPI
- 270.8019
- Rent YoY
- ▲ 1.42%
- Metro
- New York-Newark-Jersey City, NY-NJ-PA
- State GDP YoY
- ▲ 2.60%
- F500 in state
- 92
Industry mix (Fortune 500 HQ in NY)
| Industry | F500 HQs | Revenue |
|---|---|---|
| Financial Services | 10 | $950B |
|
||
| Consumer Goods | 9 | $162B |
|
||
| Insurance | 4 | $225B |
|
||
| Telecommunications | 2 | $144B |
|
||
| Pharmaceuticals | 2 | $112B |
|
||
| Media / Entertainment | 2 | $69B |
|
||
Price history
2 events — show timeline
- 2026-05-26 Pending — OneKey® MLS as Distributed by MLS Grid
- 2026-05-04 Listed $379,000 OneKey® MLS as Distributed by MLS Grid
Property tax history
+2.5%/yrLatest (2025): $5,730 · -22.0% YoY. Source: county tax records.
Cash-flow waterfall
monthlySold comps — $/sqft
last 12 mo · ≤1 miLoading sold comps…