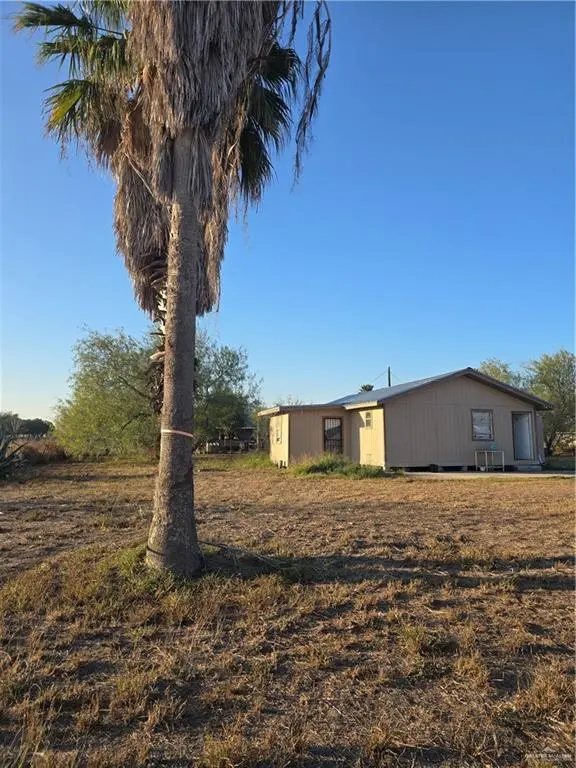
5201 Jessica Dr · Doffing, TX
Flood risk 7/10 · Major
- FEMA flood zone
- X
- Chance of flooding over 30 yrs
- 0.99%
- Est. flood insurance / yr
- $507 – $1,088
Fire risk 9/10 · Severe
- Est. fire insurance / yr
- $1,222 – $2,270
Heat risk 9/10 · Severe
- Hot days now (above 112°F)
- 7 days/yr
- Hot days in 30 yrs
- 22 days/yr
Wind risk 8/10 · Major
- Chance of severe wind over 30 yrs
- 97.0%
Air-quality risk 1/10 · Minimal
- Unhealthy air days now
- 0 days/yr
- Unhealthy air days in 30 yrs
- 0 days/yr
Risk factors via First Street. Map © Google.
Why this score? — see what drove the B grade
The composite is a weighted blend of 9 inputs, each scored 0–100. Each bar is that input's sub-score; the figure is the points it added to the 100-point composite (weight × sub-score).
- Cash flow +30.0/30.0
- ARV discount +15.0/15.0
- 1% rule +10.0/10.0
- DSCR +10.0/10.0
- Livability +2.7/5.0
- Rent growth +2.5/5.0
- Condition / age +2.5/5.0
- Schools +1.9/10.0
- Appreciation +0.0/10.0
$99,000
🖨 Deal sheet (PDF) 📄 Offer letter ✓ Due diligence
Listing remarks MLS
Fixer upper, 3 bedroom 2 bath house on 1/2 acre corner lot in Mission TX. North of 3 mile line. Great opportunity. A new roof was installed in 2024. Posible owner finance with 15% down. Call agent for more information or to schedule a visit.
Key facts
- New roof
- Corner lot
- 0.51 acre lot
Tags
Neighborhood map
What this means for you Summary
Snapshot
- This is a 2-bed/1.0-bath single-family listed at $99k.
Deal economics
- At list price, monthly cash flow is $416 ($5k/yr) — positive.
- The deal already cash-flows at list — no discount required.
- Meets the 1% rule at list price ($1k rent vs $99k).
- Recommended offer: $87k (12.0% below list) — sets the bar for market timing.
Location & tenants
- Location reads 54/100 on livability (#1,406 in TX) — a working-class tenant base; expect higher turnover. Strengths: cost of living A+, housing A; Watch: crime D+, schools F, amenities F.
- La Joya ISD (suburban): math 18% / reading 29% proficiency, ranked #759 of 826 in TX (top 92%) — low school quality limits family demand, transient renter base, plan for 1-2y turnover.
- Market conditions: 474 active listings in the ZIP; 7,378 units permitted in Hidalgo County in 2024 (641 in 5+ unit buildings).
- This rent runs 34% of the median local income ($52k/yr) — at the standard rent-burdened threshold; future hikes will face affordability resistance.
Forward outlook
- Local home prices are declining (-3.0%/yr); year-one equity from $684 of loan paydown is wiped out by about $3k of value loss. Plan a longer hold.
- Hidalgo County population projected at +28% by 2050 — long-run rental-demand tailwind backs the buy-and-hold thesis.
- At projected returns (-3.0% appreciation + 3.0% rent growth), your $28k cash investment doubles in ~7 years — after that, you're playing with house money.
Negotiation context
- It's been on market 136 days — a 12% lower offer ($87k) is reasonable based on typical stale-listing flexibility.
- 4 sale attempts since 8y ago; this cycle's ask has dropped $20k (17%) from the opening price — seller is motivated, your offer sets the floor, not the list.
Risks & watch-outs
- Watch-outs: flood insurance adds $66/mo.
- Climate carrying-cost: major flood risk; severe wind risk, 97% chance of damaging wind over 30y; severe wildfire risk; extreme-heat days projected 7→22/yr by 2055 (HVAC capex compounding) — expect insurance premiums to compound above CPI over the hold.
Questions for the listing agent
- It's been on market 136 days. Have you received any prior offers? Is the seller open to a 12% concession, seller financing, or rate buy-down credit?
- Built in 1975 — when were the roof, HVAC, electrical panel, plumbing, and water heater last replaced?
- What's the actual annual flood-insurance premium (NFIP or private), and is the property in a SFHA with mandatory coverage?
- Why hasn't it sold? Are there any deal-killer items the seller is aware of (foundation, flood, title, zoning, code violations)?
- Is there a deadline driving the sale (1031 exchange, divorce, estate, relocation)? That informs how much negotiation room exists.
- Schools are F-rated, which usually means shorter tenancies and higher turnover. Who's the typical renter profile here, and what's been the actual vacancy rate?
- Crime grade is D in this area — have there been break-ins, vandalism, or insurance claims at this property in the last 3 years? What carrier currently insures it and at what premium?
- What's the average days-on-market for RENTAL listings here right now (not sales)? A rising rental-DOM trend means longer vacancies and softer asking-rent achievability than the comps imply.
- What's the recent tenant-quality profile in this submarket — average credit score on applications, eviction rate, late-payment / NSF rate, and stable-employment percentage? A property-management company in the area should have these aggregated.
- How much new for-sale + rental construction is in the pipeline within 1–3 miles? Heavy new supply typically softens prices + rents 12–24 months out; constrained supply supports both.
Investment metrics
- 1% rule
- 1.51% ✓
- Cap rate
- 12.14%
- Cash-on-cash
- 20.90%
- DSCR
- 1.93
- GRM
- 5.5
CMA / ARV
- ARV (median comp)
- $187,317
- List price
- $99,000
- Delta
- -47.15%
- Verdict
- UNDERPRICED
- Comps
- 6 within 1.0 mi
Show comp detail 1 sale within ~0.75 mi
| Address | Dist | Beds/Ba | Sqft | Sold | Price | $/sf | Match |
|---|---|---|---|---|---|---|---|
| 5208 Sunny Cir | 0.52mi | 2/2.0 | 1,150 (-15%) | 23mo | $195,000 | $170 | 28 |
Match score weights: distance 35% · size 25% · config 20% · recency 20%. Top-matched comps best support the ARV.
Projected returns pro-forma
-3.0% appreciation · 3.0% rent growth · sell at horizon
- IRR
- 9.6%
- Equity multiple
- 1.38×
- Total profit
- $10,541
- Equity at exit
- $14,761
- IRR
- 18.8%
- Equity multiple
- 2.57×
- Total profit
- $43,613
- Equity at exit
- $8,560
Cash invested: $27,720 (down + closing). Projections, not guarantees.
Landlord ↔ Tenant lean methodology
- Overall (STATE)
- 87 Strongly Landlord-Friendly
- State Texas
- 87 Strongly Landlord-Friendly · R+5
- County
- — inherits STATE
- City
- — inherits STATE
ZIP-level market 78574
- Home prices YoY
- -16.1%
- Active inventory
- 474
- Price-to-rent
- 5.5×
Monthly cashflow live
- Estimated rent
- $1,498 medium interval (Pro) →
- Mortgage (P&I)
- −$519
- Tax from tax record
- −$140 /mo · $1,682/yr
- Insurance
- −$41
- Flood insurance flood zone
- −$66 /mo · $798/yr
- HOA
- −$0
- Vacancy / Maint / Mgmt
- −$315
- Net cashflow
- $416
Break-even live
Sensitivity live
| Price | -10% $472 | -5% $444 | +0% $416 | +5% $388 | +10% $360 |
|---|---|---|---|---|---|
| Rent | -10% $298 | -5% $357 | +0% $416 | +5% $475 | +10% $535 |
| Rate | -1.0pp $466 | -0.5pp $441 | base $416 | +0.5pp $391 | +1.0pp $364 |
UW: 25.0% down · 7.5% · 30yr · 1.5% tax · 5.0% vac · 8.0% maint · 8.0% mgmt
Financing live
Cash to close
- Down payment
- $24,750
- Closing costs
- $2,970
- Reserves months
- —
- Total cash needed
- —
Loan-product check · same deal, 3 products live
Conventional
25% down · 7.5% · 30yr
- Down + closing
- —
- Monthly P&I
- —
- Monthly cashflow
- —
- DSCR
- —
- Eligible?
- —
Personal DTI + credit; lowest rate.
DSCR
20% down · 8.5% · 30yr
- Down + closing
- —
- Monthly P&I
- —
- Monthly cashflow
- —
- DSCR
- —
- Eligible?
- —
No personal income docs; deal must DSCR.
Hard money
10% down · 12.0% · 12mo
- Down + closing
- —
- Monthly P&I
- —
- Monthly cashflow
- —
- DSCR
- —
- Eligible?
- —
Short-term bridge; refi at stabilization.
Listing history 33 events
-
2026-06-18days on market $99,000 Active 136 DOM
-
2026-06-17days on market $99,000 Active 135 DOM
-
2026-06-16days on market $99,000 Active 134 DOM
-
2026-06-15days on market $99,000 Active 133 DOM
-
2026-06-14days on market $99,000 Active 131 DOM
-
2026-06-13days on market $99,000 Active 130 DOM
-
2026-06-10days on market $99,000 Active 128 DOM
-
2026-06-09days on market $99,000 Active 127 DOM
-
2026-06-08days on market $99,000 Active 126 DOM
-
2026-06-07days on market $99,000 Active 125 DOM
-
2026-06-05days on market $99,000 Active 122 DOM
-
2026-06-03days on market $99,000 Active 121 DOM
-
2026-06-02days on market $99,000 Active 120 DOM
-
2026-06-01days on market $99,000 Active 119 DOM
-
2026-05-31days on market $99,000 Active 118 DOM
-
2026-05-31days on market $99,000 Active 117 DOM
-
2026-03-23price $1,000
-
2026-01-28$119,000 Active 242-char remark
Show marketing remark (242 chars)
Fixer upper, 3 bedroom 2 bath house on 1/2 acre corner lot in Mission TX. North of 3 mile line. Great opportunity. A new roof was installed in 2024. Posible owner finance with 15% down. Call agent for more information or to schedule a visit.
-
2026-01-21$1,100
-
2023-10-26historical $900
-
2023-10-22$900
-
2022-11-23soldstatus
-
2019-01-03price $37,000 182-char remark
Show marketing remark (182 chars)
3/2 ON A TREE FILLED 1/2 ACRE LOT IN MISSION. ALSO HAS A 1/1 RV AND COVER THAT WILL CONVEY. GREAT FOR A TREE FARM, WEEK-END GET AWAY OR JUST ENJOYING COUNTRY LIVING....BRING OFFERS.
-
2018-12-28status Pending 182-char remark
Show marketing remark (182 chars)
3/2 ON A TREE FILLED 1/2 ACRE LOT IN MISSION. ALSO HAS A 1/1 RV AND COVER THAT WILL CONVEY. GREAT FOR A TREE FARM, WEEK-END GET AWAY OR JUST ENJOYING COUNTRY LIVING....BRING OFFERS.
-
2018-12-28soldstatus Sold 182-char remark
Show marketing remark (182 chars)
3/2 ON A TREE FILLED 1/2 ACRE LOT IN MISSION. ALSO HAS A 1/1 RV AND COVER THAT WILL CONVEY. GREAT FOR A TREE FARM, WEEK-END GET AWAY OR JUST ENJOYING COUNTRY LIVING....BRING OFFERS.
-
2018-12-28soldstatus
Show marketing remark (182 chars)
3/2 ON A TREE FILLED 1/2 ACRE LOT IN MISSION. ALSO HAS A 1/1 RV AND COVER THAT WILL CONVEY. GREAT FOR A TREE FARM, WEEK-END GET AWAY OR JUST ENJOYING COUNTRY LIVING....BRING OFFERS.
-
2018-12-26price $44,900 182-char remark
Show marketing remark (182 chars)
3/2 ON A TREE FILLED 1/2 ACRE LOT IN MISSION. ALSO HAS A 1/1 RV AND COVER THAT WILL CONVEY. GREAT FOR A TREE FARM, WEEK-END GET AWAY OR JUST ENJOYING COUNTRY LIVING....BRING OFFERS.
-
2018-10-31price $44,900 182-char remark
Show marketing remark (182 chars)
3/2 ON A TREE FILLED 1/2 ACRE LOT IN MISSION. ALSO HAS A 1/1 RV AND COVER THAT WILL CONVEY. GREAT FOR A TREE FARM, WEEK-END GET AWAY OR JUST ENJOYING COUNTRY LIVING....BRING OFFERS.
-
2018-07-27$49,900 Active 182-char remark
Show marketing remark (182 chars)
3/2 ON A TREE FILLED 1/2 ACRE LOT IN MISSION. ALSO HAS A 1/1 RV AND COVER THAT WILL CONVEY. GREAT FOR A TREE FARM, WEEK-END GET AWAY OR JUST ENJOYING COUNTRY LIVING....BRING OFFERS.
-
2016-10-12price $80,000
-
2004-11-04soldstatus
-
2004-11-04soldstatus
-
1994-11-19soldstatus
ⓘ Source: listings_history table (triggers on properties + properties_extension) + one-shot
backfill from property_details.listing_events for pre-trigger history.
Tax reassessment forecast TX · Resets to sale price
- Current annual tax
- $1,682 · $140/mo
- Projected year-2 tax
- $1,812 · $151/mo
- Expected delta
- +$129/yr (+$11/mo · 7.7%)
ⓘ Screening estimate from a state-policy table — verify with the county assessor before closing.
Climate risk First Street
- Flood 7/10 Severe FEMA zone X · 99% chance over 30 yrs
- Wildfire 9/10 Extreme
- Heat 9/10 Extreme 7 d/yr ≥112°F today · 22 d/yr by 30 yrs out
- Wind 8/10 Severe 97% chance of damaging wind over 30 yrs
- Air quality 1/10 Low 0 unhealthy d/yr today · 0 by 30 yrs out
Nearby sold comps map
Loading sold comps map…
Walkable amenities ~0.75 mi
Loading nearby amenities…
Taxation est. · year 1
- Rental income
- $17,974
- − Mortgage interest
- −$5,546
- − Property taxes
- −$1,682
- − Insurance
- −$1,292
- − Repairs & maintenance
- −$1,438
- − Management
- −$1,438
- − Depreciation
- −$2,880
- Taxable income
- $3,698
- Est. tax owed @ 24.0%
- −$887
- After-tax cash flow
- $4,107/yr
For passive investors: Depreciation is non-cash, so a rental often shows a tax loss while cash-flowing — sheltering income. Rental losses are passive: they offset passive income freely, and up to $25,000/yr can offset ordinary (W-2) income if you actively participate and your MAGI is under $100k (phasing out to $0 by $150k); unused losses carry forward. On sale, claimed depreciation is recaptured at up to 25%, and gains may owe capital-gains tax (a 1031 exchange can defer both). Figures are a year-1 estimate at your 24.0% rate — not tax advice; consult a CPA.
Schools (NCES district)
- District
- La Joya ISD
- NCES district ID
- 4826130
- Math proficiency
- 18% ▼ -35.00%
- Reading proficiency
- 29% ▼ -10.00%
- Median HH income
- $27,845
- Composite
- 18.65/100
- National rank
- #8891
- State rank
- #759 of 826 in TX
Livability — Doffing
- Score
- 54/100
- State rank
- #1406
- US rank
- #24060
Category grades
Schools grade is shown separately in the Schools card above.
Census & demographics
- Census place
- Doffing, TX
- County
- Hidalgo County · 623,128 people
- Metro
- McAllen-Edinburg-Mission, TX
- Population (ZIP)
- 62,456
- Household income
- $52,393
- Rent vs Own
- Severe rent burden
- 803.0
Population outlook (Hidalgo County) Hauer SSP2
- Today (2025)
- 955,232 people
- By 2030
- 1,009,774 · +5.7%
- By 2040
- 1,120,332 · +17.3%
- By 2050
- 1,225,036 · +28.2%
- By 2075
- 1,439,189 · +50.7%
- By 2100
- 1,533,429 · +60.5%
Race, ethnicity, and origin ACS 2023
- Neighborhood character
- Predominantly Hispanic (97%)
- Race & ethnicity
- Hispanic / Latino 97% Two or more races 62% White 2%
- Hispanic origin (detail)
- Mexican 93%
- Foreign-born
- 33% · Canada
- Languages at home
- 12% English-only · Spanish 87%
Political lean MEDSL · Hidalgo
- 2024 margin
- Toss-up / Even · D 48.1% · R 51.0%
- 2008→2024 swing
- -41.6pp toward R · 2008: 38.7pp · 2024: -2.9pp
- All cycles
- 2024: R+2.9 2020: D+17.1 2016: D+40.5 2012: D+41.8 2008: D+38.7
Not yet ingested
- Civics
- —
Market trends
- HPI YoY
- ▼ -44.13%
- Current HPI
- 230.3323
- Rent YoY
- —
- Metro
- McAllen-Edinburg-Mission, TX
- State GDP YoY
- ▲ 3.95%
- F500 in state
- 110
Industry mix (Fortune 500 HQ in TX)
| Industry | F500 HQs | Revenue |
|---|---|---|
| Energy | 16 | $1,198B |
|
||
| Technology | 5 | $198B |
|
||
| Engineering / Construction | 4 | $72B |
|
||
| Energy Services | 3 | $60B |
|
||
| Utilities | 3 | $41B |
|
||
| Healthcare | 2 | $330B |
|
||
Price history
-98.8% since first listed17 events — show timeline
- 2026-03-23 Price Changed $1,000 MCALLENMLS
- 2026-01-28 Listed $119,000 MCALLENMLS
- 2026-01-21 Listed for Rent $1,100 MCALLENMLS
- 2023-10-26 Rental Removed $900 LISTANZA
- 2023-10-22 Listed for Rent $900 LISTANZA
- 2022-11-23 Sold (Public Records) — Public Records
- 2019-01-03 Price Changed $37,000 MCALLENMLS
- 2018-12-28 Pending — MCALLENMLS
- 2018-12-28 Sold (Public Records) — Public Records
- 2018-12-28 Sold (MLS) — MCALLENMLS
- 2018-12-26 Price Changed $44,900 MCALLENMLS
- 2018-10-31 Price Changed $44,900 MCALLENMLS
- 2018-07-27 Listed $49,900 MCALLENMLS
- 2016-10-12 Price Changed $80,000 MCALLENMLS
- 2004-11-04 Sold (Public Records) — Public Records
- 2004-11-04 Sold (Public Records) — Public Records
- 1994-11-19 Sold (Public Records) — Public Records
Property tax history
+7.9%/yrLatest (2025): $1,682 · -11.6% YoY. Source: county tax records.
Cash-flow waterfall
monthlySold comps — $/sqft
last 12 mo · ≤1 miLoading sold comps…