 27-Plex
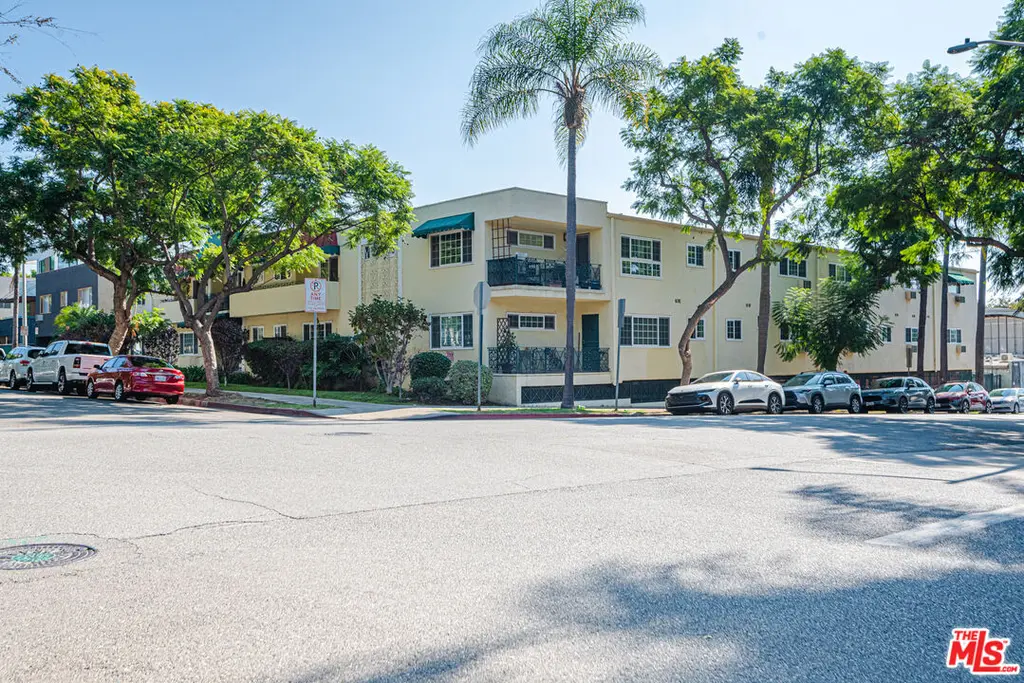
8130 Norton Ave · West Hollywood, CA
Flood risk 1/10 · Minimal
- FEMA flood zone
- X (unshaded)
- Chance of flooding over 30 yrs
- 0.0%
- Est. flood insurance / yr
- $507 – $1,088
Fire risk 1/10 · Minimal
- Est. fire insurance / yr
- $659 – $1,223
Heat risk 6/10 · Moderate
- Hot days now (above 88°F)
- 7 days/yr
- Hot days in 30 yrs
- 23 days/yr
Wind risk 1/10 · Minimal
- Chance of severe wind over 30 yrs
- —
Air-quality risk 5/10 · Moderate
- Unhealthy air days now
- 7 days/yr
- Unhealthy air days in 30 yrs
- 7 days/yr
Risk factors via First Street. Map © Google.
Why this score? — see what drove the C+ grade
The composite is a weighted blend of 9 inputs, each scored 0–100. Each bar is that input's sub-score; the figure is the points it added to the 100-point composite (weight × sub-score).
- Cash flow +26.3/30.0
- DSCR +8.9/10.0
- ARV discount +7.5/15.0
- 1% rule +5.8/10.0
- Schools +3.6/10.0
- Livability +3.5/5.0
- Condition / age +2.5/5.0
- Rent growth +2.1/5.0
- Appreciation +0.0/10.0
$9,350,000
🖨 Deal sheet 📄 Offer letter ✓ Due diligence
Multi-family units
County records classify this as Multi-Family (5+ Unit). Listing-text estimate: 27 units. confirmed
5+ unit building — per-unit beds/baths from public records are typically unavailable; the breakdown below (if shown) is an estimate from the listing text.
Listing remarks MLS
Rarely does an investment opportunity of this caliber arise in the heart of West Hollywood, one of Los Angeles' most coveted rental submarkets. This impeccably maintained 27-unit complex offers a sophisticated blend of vintage architectural charm and modern infrastructure, perfectly positioned to capture the high-income demographics of this supply-constrained neighborhood. The property boasts a highly functional and balanced unit mix - comprising (4) studios, (19) one-bedrooms, and (4) two-bedrooms - ensuring consistent cash flow through a strategic combination of steady turnover and long-term stability. Units are thoughtfully appointed with engineered wood flooring, upgraded double-pane windows, and improved sliding doors; eleven units feature private balconies, while select residences offer upgraded HVAC systems, including central air or Mitsubishi mini-splits. Perhaps the most significant competitive advantage is the expansive parking, offering 28 spaces (32 total spots), a rare luxury that far exceeds local standards and simplifies urban living for residents. On-site amenities further elevate the tenant experience, including a refreshing pool, controlled access, and owner-owned laundry facilities providing an additional revenue stream of approximately $400 per month. With primarily copper plumbing, separately metered utilities, and a reliable water heating system (including a 2017-installed 100-gallon unit), the property is engineered for low-maintenance ownership. Residents enjoy unparalleled proximity to the Sunset Strip, world-class entertainment studios, and the premier job centers of Beverly Hills and Century City, making this a true trophy asset for any discerning portfolio.
Key facts
- 0.39 acre lot
- 32 parking spots
- Pool
Neighborhood map
What this means for you Summary
Snapshot
- This is a 27 × 23-bed/31.0-bath units multifamily listed at $9.35M.
Deal economics
- At list price, monthly cash flow is $24k ($289k/yr) — positive. Per door: $892/mo.
- The deal already cash-flows at list — no discount required.
- Meets the 1% rule at list price ($101k rent vs $9.35M).
- Recommended offer: $9.07M (3.0% below list) — sets the bar for market timing.
- Cap rate 9.4% vs local median 1.5% in West Hollywood — top-decile yield for the area; either an underpriced asset or a hidden risk that comps aren't pricing in. Stress-test before assuming the spread holds.
Location & tenants
- Location reads 70/100 on livability (#239 in CA) — a middle-class / working-renter tenant base. Strengths: schools A+, amenities A+, commute A+; Watch: health & safety C-, crime F, cost of living F.
- Los Angeles Unified (urban): math 29% / reading 54% proficiency, ranked #223 of 517 in CA (top 43%) — families likely to look elsewhere, expect single-tenant / working-renter base with shorter leases; 67% free/reduced lunch — lower-income household profile, screen leases tightly.
- Market conditions: Rents soft (-1.5%/yr); 334 active listings in the ZIP; solid renter incomes; 19,697 units permitted in Los Angeles County in 2024 (9,426 in 5+ unit buildings).
- At $101,335/mo this rent would consume 1263% of the median local household income ($96k/yr) (locally 5563% of renters already pay >50% of income on rent) — very limited rent-growth headroom before tenants either downsize or default.
Forward outlook
- Local home prices are declining (-3.0%/yr); year-one equity from $65k of loan paydown is wiped out by about $280k of value loss. Plan a longer hold.
- Los Angeles County population projected at +9% by 2050 — modest demand growth; plan on rents tracking national, not racing it.
Negotiation context
- It's been on market 49 days — a 3% lower offer ($9.07M) is reasonable based on typical stale-listing flexibility.
- 2 sale attempts since 28y ago with the ask held roughly flat each time — persistent listings suggest the price (not the market) is what's stuck; bring a comps-based counter.
- Current owner paid $1.25M; list at $9.35M implies a 647% gain — meaningful room to come down on a strong offer.
Risks & watch-outs
- Watch-outs: built in 1959 — expect roof / HVAC / electrical / plumbing capex.
- Climate carrying-cost: extreme-heat days projected 7→23/yr by 2055 (HVAC capex compounding) — expect insurance premiums to compound above CPI over the hold.
Questions for the listing agent
- It's been on market 49 days. Have you received any prior offers? Is the seller open to a 3% concession, seller financing, or rate buy-down credit?
- Can we see the unit-by-unit rent roll, current vacancy, and any below-market leases? What's the average tenancy length?
- What capital expenditures (roof, boiler, parking lot, exteriors) have been made in the last 5 years, and what's planned in the next 2?
- Built in 1959 — when were the roof, HVAC, electrical panel, plumbing, and water heater last replaced?
- Is there a deadline driving the sale (1031 exchange, divorce, estate, relocation)? That informs how much negotiation room exists.
- Schools are A-rated — typically a magnet for longer-tenancy family renters. What's the average tenant stay here, and is there a school-zone premium baked into asking?
- Crime grade is F in this area — have there been break-ins, vandalism, or insurance claims at this property in the last 3 years? What carrier currently insures it and at what premium?
- What's the average days-on-market for RENTAL listings here right now (not sales)? A rising rental-DOM trend means longer vacancies and softer asking-rent achievability than the comps imply.
- What's the recent tenant-quality profile in this submarket — average credit score on applications, eviction rate, late-payment / NSF rate, and stable-employment percentage? A property-management company in the area should have these aggregated.
- How much new apartment / multifamily construction is in the pipeline within 1–3 miles? Heavy new supply (>2% of stock underway) typically softens rents 12–24 months out; light construction supports rent growth.
Investment metrics
- 1% rule
- 1.08% ✓
- Cap rate
- 9.38%
- Cash-on-cash
- 11.04%
- DSCR
- 1.49
- GRM
- 7.7
CMA / ARV
- ARV (median comp)
- $6,111,137
- List price
- $9,350,000
- Delta
- 53.00%
- Verdict
- OVERPRICED
- Comps
- 11 within 1.0 mi
Projected returns pro-forma
-3.0% appreciation · 0.0% rent growth · sell at horizon
- IRR
- -3.0%
- Equity multiple
- 0.89×
- Total profit
- $-281,917
- Equity at exit
- $1,394,115
- IRR
- 3.4%
- Equity multiple
- 1.22×
- Total profit
- $566,650
- Equity at exit
- $808,417
Cash invested: $2,618,000 (down + closing). Projections, not guarantees.
Landlord ↔ Tenant lean methodology
- Overall (STATE)
- 18 Strongly Tenant-Friendly
- State California
- 18 Strongly Tenant-Friendly · D+13
- County
- — inherits STATE
- City
- — inherits STATE
ZIP-level market 90046
- Rents YoY
- -1.5%
- Active inventory
- 334
- Price-to-rent
- 207.6×
Monthly cashflow live
- Estimated rent
- $101,335 medium interval (Pro) →
- Mortgage (P&I)
- −$49,032
- Tax from tax record
- −$3,042 /mo · $36,505/yr
- Insurance
- −$3,896
- HOA
- −$0
- Vacancy / Maint / Mgmt
- −$21,280
- Net cashflow
- $24,084
Break-even live
27-unit breakdown (identical units grouped — click to expand)
| Units | Beds | Baths | Est. rent |
|---|---|---|---|
| 27× units | 23 | 31 | $101,331 |
| #1 | 23 | 31 | $3,753 |
| #2 | 23 | 31 | $3,753 |
| #3 | 23 | 31 | $3,753 |
| #4 | 23 | 31 | $3,753 |
| #5 | 23 | 31 | $3,753 |
| #6 | 23 | 31 | $3,753 |
| #7 | 23 | 31 | $3,753 |
| #8 | 23 | 31 | $3,753 |
| #9 | 23 | 31 | $3,753 |
| #10 | 23 | 31 | $3,753 |
| #11 | 23 | 31 | $3,753 |
| #12 | 23 | 31 | $3,753 |
| #13 | 23 | 31 | $3,753 |
| #14 | 23 | 31 | $3,753 |
| #15 | 23 | 31 | $3,753 |
| #16 | 23 | 31 | $3,753 |
| #17 | 23 | 31 | $3,753 |
| #18 | 23 | 31 | $3,753 |
| #19 | 23 | 31 | $3,753 |
| #20 | 23 | 31 | $3,753 |
| #21 | 23 | 31 | $3,753 |
| #22 | 23 | 31 | $3,753 |
| #23 | 23 | 31 | $3,753 |
| #24 | 23 | 31 | $3,753 |
| #25 | 23 | 31 | $3,753 |
| #26 | 23 | 31 | $3,753 |
| #27 | 23 | 31 | $3,753 |
| Total (27 units) | $101,335 | ||
UW: 25.0% down · 7.5% · 30yr · 1.5% tax · 5.0% vac · 8.0% maint · 8.0% mgmt
Financing live
Cash to close
- Down payment
- $2,337,500
- Closing costs
- $280,500
- Reserves months
- —
- Total cash needed
- —
Loan-product check · same deal, 3 products live
Conventional
25% down · 7.5% · 30yr
- Down + closing
- —
- Monthly P&I
- —
- Monthly cashflow
- —
- DSCR
- —
- Eligible?
- —
Personal DTI + credit; lowest rate.
DSCR
20% down · 8.5% · 30yr
- Down + closing
- —
- Monthly P&I
- —
- Monthly cashflow
- —
- DSCR
- —
- Eligible?
- —
No personal income docs; deal must DSCR.
Hard money
10% down · 12.0% · 12mo
- Down + closing
- —
- Monthly P&I
- —
- Monthly cashflow
- —
- DSCR
- —
- Eligible?
- —
Short-term bridge; refi at stabilization.
Listing history 17 events
-
2026-06-18days on market $9,350,000 Active 49 DOM
-
2026-06-17days on market $9,350,000 Active 48 DOM
-
2026-06-16days on market $9,350,000 Active 47 DOM
-
2026-06-15days on market $9,350,000 Active 46 DOM
-
2026-06-13days on market $9,350,000 Active 44 DOM
-
2026-06-09days on market $9,350,000 Active 40 DOM
-
2026-06-08days on market $9,350,000 Active 39 DOM
-
2026-06-07days on market $9,350,000 Active 38 DOM
-
2026-06-04days on market $9,350,000 Active 35 DOM
-
2026-06-03days on market $9,350,000 Active 34 DOM
-
2026-06-02days on market $9,350,000 Active 33 DOM
-
2026-06-01days on market $9,350,000 Active 32 DOM
-
2026-05-31days on market $9,350,000 Active 31 DOM
-
2026-04-30$9,350,000 Active 1713-char remark
Show marketing remark (1713 chars)
Rarely does an investment opportunity of this caliber arise in the heart of West Hollywood, one of Los Angeles' most coveted rental submarkets. This impeccably maintained 27-unit complex offers a sophisticated blend of vintage architectural charm and modern infrastructure, perfectly positioned to capture the high-income demographics of this supply-constrained neighborhood. The property boasts a highly functional and balanced unit mix - comprising (4) studios, (19) one-bedrooms, and (4) two-bedrooms - ensuring consistent cash flow through a strategic combination of steady turnover and long-term stability. Units are thoughtfully appointed with engineered wood flooring, upgraded double-pane windows, and improved sliding doors; eleven units feature private balconies, while select residences offer upgraded HVAC systems, including central air or Mitsubishi mini-splits. Perhaps the most significant competitive advantage is the expansive parking, offering 28 spaces (32 total spots), a rare luxury that far exceeds local standards and simplifies urban living for residents. On-site amenities further elevate the tenant experience, including a refreshing pool, controlled access, and owner-owned laundry facilities providing an additional revenue stream of approximately $400 per month. With primarily copper plumbing, separately metered utilities, and a reliable water heating system (including a 2017-installed 100-gallon unit), the property is engineered for low-maintenance ownership. Residents enjoy unparalleled proximity to the Sunset Strip, world-class entertainment studios, and the premier job centers of Beverly Hills and Century City, making this a true trophy asset for any discerning portfolio.
-
1998-02-16historical
-
1998-01-16
-
1988-06-30soldstatus $1,251,500
ⓘ Source: listings_history table (triggers on properties + properties_extension) + one-shot
backfill from property_details.listing_events for pre-trigger history.
Tax reassessment forecast CA · Resets to sale price
- Current annual tax
- $36,505 · $3,042/mo
- Projected year-2 tax
- $71,060 · $5,922/mo
- Expected delta
- +$34,555/yr (+$2,880/mo · 94.7%)
ⓘ Screening estimate from a state-policy table — verify with the county assessor before closing.
Climate risk First Street
- Flood 1/10 Low FEMA zone X (unshaded) · 0% chance over 30 yrs
- Wildfire 1/10 Low
- Heat 6/10 Major 7 d/yr ≥88°F today · 23 d/yr by 30 yrs out
- Wind 1/10 Low
- Air quality 5/10 Major 7 unhealthy d/yr today · 7 by 30 yrs out
Nearby sold comps map
Loading sold comps map…
Walkable amenities ~0.75 mi
Loading nearby amenities…
Taxation est. · year 1
- Rental income
- $1,216,020
- − Mortgage interest
- −$523,745
- − Property taxes
- −$36,505
- − Insurance
- −$46,750
- − Repairs & maintenance
- −$97,282
- − Management
- −$97,282
- − Depreciation
- −$272,000
- Taxable income
- $142,456
- Est. tax owed @ 24.0%
- −$34,189
- After-tax cash flow
- $254,822/yr
For passive investors: Depreciation is non-cash, so a rental often shows a tax loss while cash-flowing — sheltering income. Rental losses are passive: they offset passive income freely, and up to $25,000/yr can offset ordinary (W-2) income if you actively participate and your MAGI is under $100k (phasing out to $0 by $150k); unused losses carry forward. On sale, claimed depreciation is recaptured at up to 25%, and gains may owe capital-gains tax (a 1031 exchange can defer both). Figures are a year-1 estimate at your 24.0% rate — not tax advice; consult a CPA.
Schools (NCES district)
- District
- Los Angeles Unified
- NCES district ID
- 0622710
- Math proficiency
- 29% ▼ -4.00%
- Reading proficiency
- 54% ▲ 10.00%
- Median HH income
- $50,403
- Composite
- 35.67/100
- National rank
- #4875
- State rank
- #223 of 517 in CA
Livability — West Hollywood
- Score
- 70/100
- State rank
- #239
- US rank
- #7852
Category grades
Schools grade is shown separately in the Schools card above.
Census & demographics
- Census place
- West Hollywood, CA
- County
- Los Angeles County · 9,444,647 people
- City population
- 20,961
- Metro
- Los Angeles-Long Beach-Anaheim, CA
- Population (ZIP)
- 48,296
- Household income
- $96,250
- Rent vs Own
- Severe rent burden
- 5563.0
Population outlook (Los Angeles County) Hauer SSP2
- Today (2025)
- 10,940,515 people
- By 2030
- 11,256,481 · +2.9%
- By 2040
- 11,729,929 · +7.2%
- By 2050
- 11,948,407 · +9.2%
- By 2075
- 11,818,114 · +8.0%
- By 2100
- 10,842,928 · -0.9%
Race, ethnicity, and origin ACS 2023
- Neighborhood character
- Majority White (65%)
- Race & ethnicity
- White 65% Hispanic / Latino 16% Two or more races 13% Asian 7% Black 5%
- Hispanic origin (detail)
- Mexican 8% Puerto Rican 1%
- Common ancestry
- Scotch-Irish 6% Lithuanian 4% Romanian 4%
- Foreign-born
- 26% · Canada, China, South Korea
- Languages at home
- 71% English-only · Spanish 9% Russian/Polish/Slavic 8% Other Indo-European 3%
Political lean MEDSL · Los Angeles
- 2024 margin
- Solid D (+32.9) · D 64.8% · R 31.9% · Other 3.3%
- 2008→2024 swing
- -7.4pp toward R · 2008: 40.4pp · 2024: 32.9pp
- All cycles
- 2024: D+32.9 2020: D+44.2 2016: D+48.0 2012: D+40.0 2008: D+40.4
Not yet ingested
- Civics
- —
Market trends
- HPI YoY
- ▼ -571.28%
- Current HPI
- 365.8036
- Rent YoY
- ▼ -1.48%
- Metro
- Los Angeles-Long Beach-Anaheim, CA
- State GDP YoY
- ▲ 3.21%
- F500 in state
- 116
Industry mix (Fortune 500 HQ in CA)
| Industry | F500 HQs | Revenue |
|---|---|---|
| Technology | 27 | $1,492B |
|
||
| Financial Services | 3 | $174B |
|
||
| Retail | 3 | $44B |
|
||
| Insurance | 3 | $26B |
|
||
| Media / Entertainment | 2 | $115B |
|
||
| Pharmaceuticals / Biotech | 2 | $62B |
|
||
Price history
+647.1% since first listed4 events — show timeline
- 2026-04-30 Listed $9,350,000 TheMLS
- 1998-02-16 Delisted — TheMLS
- 1998-01-16 Listed — TheMLS
- 1988-06-30 Sold (Public Records) $1,251,500 Public Records
Property tax history
+1.7%/yrLatest (2025): $36,505 · +3.7% YoY. Source: county tax records.
Cash-flow waterfall
monthlySold comps — $/sqft
last 12 mo · ≤1 miLoading sold comps…