 🏷️ Likely Rental
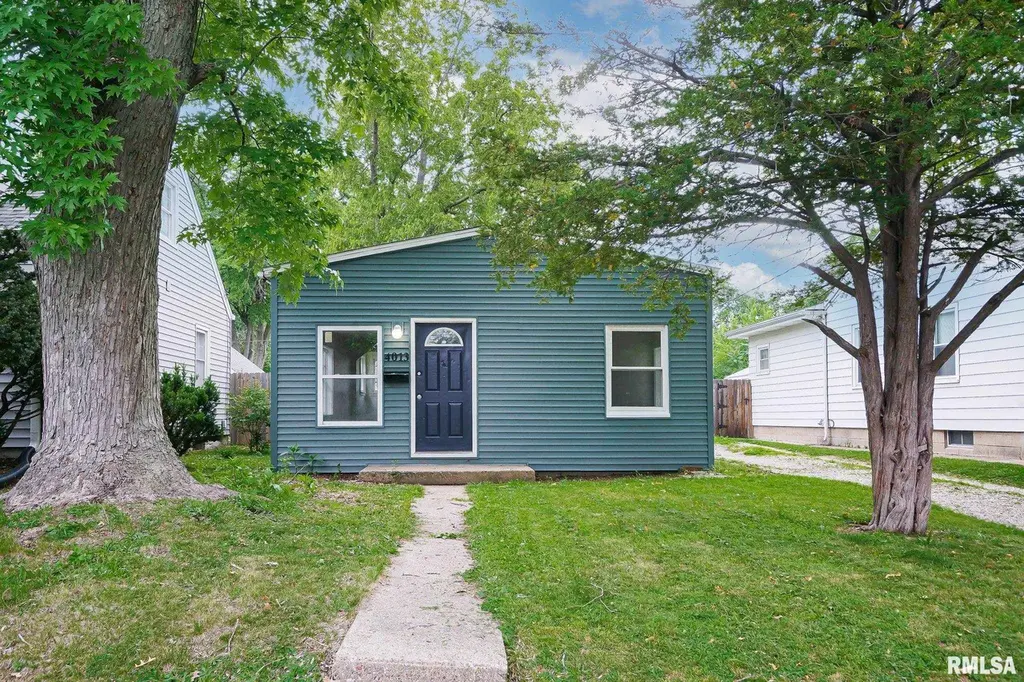
4013 N Columbus Ave · Peoria, IL
Flood risk 1/10 · Minimal
- FEMA flood zone
- X
- Chance of flooding over 30 yrs
- 0.0%
- Est. flood insurance / yr
- $507 – $1,088
Fire risk 1/10 · Minimal
- Est. fire insurance / yr
- $804 – $1,492
Heat risk 3/10 · Minor
- Hot days now (above 104°F)
- 7 days/yr
- Hot days in 30 yrs
- 18 days/yr
Wind risk 2/10 · Minimal
- Chance of severe wind over 30 yrs
- 1.0%
Air-quality risk 3/10 · Minor
- Unhealthy air days now
- 1 days/yr
- Unhealthy air days in 30 yrs
- 3 days/yr
Risk factors via First Street. Map © Google.
Why this score? — see what drove the B+ grade
The composite is a weighted blend of 9 inputs, each scored 0–100. Each bar is that input's sub-score; the figure is the points it added to the 100-point composite (weight × sub-score).
- Cash flow +30.0/30.0
- ARV discount +15.0/15.0
- 1% rule +10.0/10.0
- DSCR +10.0/10.0
- Livability +3.7/5.0
- Rent growth +3.4/5.0
- Condition / age +2.5/5.0
- Schools +1.1/10.0
- Appreciation +0.0/10.0
$68,000
🖨 Deal sheet 📄 Offer letter ✓ Due diligence
Listing remarks MLS
INVESTORS TAKE NOTE! 2 BEDROOM RANCH HOME NESTLED IN THE HEART OF PEORIA CURRENTLY RENTED FOR $700 PER MONTH GENERATING $8,400 ANNUALLY! START OR BUILD YOUR INVESTMENT PORTFOLIO TODAY!
Key facts
- Roof and siding done
- Large garage
- Furnace new
Tags
Property features AI
Finance
- Other: Lot dimensions approximately 40 x 125
- HOA & community: No association fees
Exterior
- Parking: Detached 1-car garage
- Utilities: Public water; Public sewer
- Home design: Single family residence; Built in 1935
- Construction: Shingle roof; Not new construction
- Exterior features: Level lot; Paved road access
Interior
- Kitchen: Refrigerator included
- Bedrooms: 2 bedrooms (one on main level, one on upper level)
- Flooring: Laminate flooring throughout main living areas and bedrooms
- Bathrooms: 1 full bathroom
- Heating & cooling: No central cooling
- Interior features: Refrigerator; Washer; Dryer; No basement
- Laundry & utility: Laundry room on main level; Washer and dryer included
Neighborhood map
What this means for you Summary
Snapshot
- This is a 2-bed/1.0-bath single-family listed at $68k.
Deal economics
- At list price, monthly cash flow is $356 ($4k/yr) — positive.
- The deal already cash-flows at list — no discount required.
- Meets the 1% rule at list price ($1k rent vs $68k).
- Cap rate 12.6% vs local median 5.6% in Peoria — top-decile yield for the area; either an underpriced asset or a hidden risk that comps aren't pricing in. Stress-test before assuming the spread holds.
Location & tenants
- Location reads 73/100 on livability (#270 in IL) — a middle-class / working-renter tenant base. Strengths: commute A+, cost of living A+, housing A+; Watch: employment D+, crime F.
- Peoria SD 150 (urban): math 11% / reading 14% proficiency, ranked #554 of 620 in IL (top 89%) — low school quality limits family demand, transient renter base, plan for 1-2y turnover; 70% free/reduced lunch — lower-income household profile, screen leases tightly.
- Zoned schools: Hines Primary School (math 2% / reading 8%, grade F, #1,741 of 2,056 statewide, top 93%, 435 students, 0% FRL); Von Steuben Middle School (math 0% / reading 0%, grade F, #665 of 665 statewide, top 100%, 269 students, 0% FRL); Peoria High School (math 4% / reading 7%, grade F, #609 of 693 statewide, top 88%, 1,447 students, 0% FRL) — zoned schools average 0% FRL vs 70% district-wide (70 pts lower); this property's tenant base skews higher-income than the district average.
- Market conditions: Rents rising (+3.5%/yr); 104 active listings in the ZIP; 5 comparable units currently listed for rent nearby; rentals leasing fast (median 13d on market — plan ~1-2 weeks tenant-placement turnaround); lower-income renter base — watch delinquency; 73 units permitted in Peoria County in 2024 (0 in 5+ unit buildings).
- This rent runs 30% of the median local income ($42k/yr) — at the standard rent-burdened threshold; future hikes will face affordability resistance.
Forward outlook
- Local home prices are declining (-3.0%/yr); year-one equity from $470 of loan paydown is wiped out by about $2k of value loss. Plan a longer hold.
- Peoria County population projected at -11% by 2050 — secular population decline; favor cash flow + early exit over multi-decade hold.
- At projected returns (-3.0% appreciation + 3.5% rent growth), your $19k cash investment doubles in ~6 years — after that, you're playing with house money.
Negotiation context
- Only 12 days on market — expect competitive offers; lowballing is unlikely to land.
- 3 sale attempts since 20y ago; this cycle's ask has dropped $4k (6%) from the opening price — seller is motivated, your offer sets the floor, not the list.
- Current owner paid $35k; list at $68k implies a 94% gain — meaningful room to come down on a strong offer.
Risks & watch-outs
- Watch-outs: built in 1935 — expect roof / HVAC / electrical / plumbing capex.
Questions for the listing agent
- Built in 1935 — when were the roof, HVAC, electrical panel, plumbing, and water heater last replaced?
- Is there a deadline driving the sale (1031 exchange, divorce, estate, relocation)? That informs how much negotiation room exists.
- Schools are F-rated, which usually means shorter tenancies and higher turnover. Who's the typical renter profile here, and what's been the actual vacancy rate?
- Crime grade is F in this area — have there been break-ins, vandalism, or insurance claims at this property in the last 3 years? What carrier currently insures it and at what premium?
- What's the average days-on-market for RENTAL listings here right now (not sales)? A rising rental-DOM trend means longer vacancies and softer asking-rent achievability than the comps imply.
- What's the recent tenant-quality profile in this submarket — average credit score on applications, eviction rate, late-payment / NSF rate, and stable-employment percentage? A property-management company in the area should have these aggregated.
- How much new for-sale + rental construction is in the pipeline within 1–3 miles? Heavy new supply typically softens prices + rents 12–24 months out; constrained supply supports both.
Investment metrics
- 1% rule
- 1.55% ✓
- Cap rate
- 12.58%
- Cash-on-cash
- 22.46%
- DSCR
- 2.00
- GRM
- 5.4
CMA / ARV
- ARV (on-the-fly)
- $86,460
- Comps found
- 12
Show comp detail 12 sales within ~0.75 mi
| Address | Dist | Beds/Ba | Sqft | Sold | Price | $/sf | Match |
|---|---|---|---|---|---|---|---|
| 3824 N Dayton Ave | 0.16mi | 2/1.0 | 672 (+2%) | 6mo | $65,000 | $97 | 84 |
| 3824 N Ashton Ave | 0.14mi | 2/1.0 | 676 (+2%) | 10mo | $90,000 | $133 | 81 |
| 1315 E Rouse Ave | 0.17mi | 2/1.0 | 700 (+6%) | 12mo | $77,500 | $111 | 72 |
| 1408 E Moneta Ave | 0.32mi | 2/1.0 | 624 (-6%) | 5mo | $115,000 | $184 | 72 |
| 3915 N Dayton Ave | 0.09mi | 2/1.0 | 581 (-12%) | 8mo | $60,000 | $103 | 69 |
| 1107 E Hines Ave | 0.30mi | 2/1.0 | 620 (-6%) | 10mo | $95,000 | $153 | 67 |
| 1308 E London Ave | 0.44mi | 2/1.0 | 676 (+2%) | 13mo | $110,000 | $163 | 65 |
| 3905 N Illinois Ave | 0.52mi | 2/1.0 | 672 (+2%) | 13mo | $88,000 | $131 | 62 |
| 4100 N Illinois Dr | 0.47mi | 2/1.0 | 736 (+12%) | 5mo | $77,000 | $105 | 55 |
| 4415 N Constantine Ave | 0.33mi | 2/1.0 | 744 (+13%) | 12mo | $129,900 | $175 | 54 |
| 1424 E Elmhurst Ave | 0.74mi | 2/1.0 | 651 (-1%) | 14mo | $46,000 | $71 | 52 |
| 705 E Lake Ave | 0.65mi | 2/1.0 | 740 (+12%) | 10mo | $95,000 | $128 | 41 |
Match score weights: distance 35% · size 25% · config 20% · recency 20%. Top-matched comps best support the ARV.
Projected returns pro-forma
-3.0% appreciation · 3.49% rent growth · sell at horizon
- IRR
- 15.9%
- Equity multiple
- 1.64×
- Total profit
- $12,217
- Equity at exit
- $10,139
- IRR
- 24.9%
- Equity multiple
- 3.21×
- Total profit
- $42,104
- Equity at exit
- $5,879
Cash invested: $19,040 (down + closing). Projections, not guarantees.
Landlord ↔ Tenant lean methodology
- Overall (STATE)
- 43 Moderately Tenant-Leaning
- State Illinois
- 43 Moderately Tenant-Leaning · D+7
- County
- — inherits STATE
- City
- — inherits STATE
ZIP-level market 61603
- Home prices YoY
- -31.8%
- Rents YoY
- 3.5%
- Active inventory
- 104
- Price-to-rent
- 5.4×
Monthly cashflow live
- Estimated rent
- $1,054 high interval (Pro) →
- Mortgage (P&I)
- −$357
- Tax from tax record
- −$91 /mo · $1,093/yr
- Insurance
- −$28
- HOA
- −$0
- Vacancy / Maint / Mgmt
- −$221
- Net cashflow
- $356
Break-even live
UW: 25.0% down · 7.5% · 30yr · 1.5% tax · 5.0% vac · 8.0% maint · 8.0% mgmt
Financing live
Cash to close
- Down payment
- $17,000
- Closing costs
- $2,040
- Reserves months
- —
- Total cash needed
- —
Loan-product check · same deal, 3 products live
Conventional
25% down · 7.5% · 30yr
- Down + closing
- —
- Monthly P&I
- —
- Monthly cashflow
- —
- DSCR
- —
- Eligible?
- —
Personal DTI + credit; lowest rate.
DSCR
20% down · 8.5% · 30yr
- Down + closing
- —
- Monthly P&I
- —
- Monthly cashflow
- —
- DSCR
- —
- Eligible?
- —
No personal income docs; deal must DSCR.
Hard money
10% down · 12.0% · 12mo
- Down + closing
- —
- Monthly P&I
- —
- Monthly cashflow
- —
- DSCR
- —
- Eligible?
- —
Short-term bridge; refi at stabilization.
Rent comps 5 comps
| Address | Beds | Baths | Sqft | Rent | $/sqft | DOM | Units | Dist |
|---|---|---|---|---|---|---|---|---|
| 811 E Lake Ave Peoria Heights, IL | 2.0 | 1.0 | 576 | $875 | $1.52 | 13d | 1 | 0.52mi |
| 4914 N Best St Peoria Heights, IL | 2.0 | 1.0 | 720 | $1,200 | $1.67 | 43d | 1 | 1.04mi |
| 249 E Oak Cliff Ct Unit 4 Peoria, IL | 2.0 | 1.0 | 600 | $800 | $1.33 | 13d | 1 | 1.05mi |
| 4809 Knoxville Ave Unit 4819 4B, 5A, & 5B Peoria, IL | 3.0 | 2.0 | 700 | $1,800 | $2.57 | 13d | 1 | 1.34mi |
| 4809 Knoxville Ave Apt 2C Peoria, IL | 1.0 | 1.0 | 700 | $850 | $1.21 | 21d | 1 | 1.34mi |
Listing history 17 events
-
2026-06-03statusdays on market $68,000 Pending 12 DOM
-
2026-06-02days on market $68,000 Active 11 DOM
-
2026-06-01days on market $68,000 Active 10 DOM
-
2026-05-31days on market $68,000 Active 9 DOM
-
2026-05-30pricedays on market $68,000 Active 8 DOM
-
2026-05-22$72,500 Active
-
2025-12-17historical
-
2022-10-20soldstatus $35,000 Closed 184-char remark
Show marketing remark (184 chars)
INVESTORS TAKE NOTE! 2 BEDROOM RANCH HOME NESTLED IN THE HEART OF PEORIA CURRENTLY RENTED FOR $700 PER MONTH GENERATING $8,400 ANNUALLY! START OR BUILD YOUR INVESTMENT PORTFOLIO TODAY!
-
2022-10-08status Pending 184-char remark
Show marketing remark (184 chars)
INVESTORS TAKE NOTE! 2 BEDROOM RANCH HOME NESTLED IN THE HEART OF PEORIA CURRENTLY RENTED FOR $700 PER MONTH GENERATING $8,400 ANNUALLY! START OR BUILD YOUR INVESTMENT PORTFOLIO TODAY!
-
2022-10-04$34,900 Active 184-char remark
Show marketing remark (184 chars)
INVESTORS TAKE NOTE! 2 BEDROOM RANCH HOME NESTLED IN THE HEART OF PEORIA CURRENTLY RENTED FOR $700 PER MONTH GENERATING $8,400 ANNUALLY! START OR BUILD YOUR INVESTMENT PORTFOLIO TODAY!
-
2021-08-06historical
-
2021-08-06historical
-
2021-08-06historical
-
2006-09-01soldstatus $37,000
-
2006-08-31soldstatus $36,900
-
2006-06-11$36,900
-
2005-05-16soldstatus $38,000
ⓘ Source: listings_history table (triggers on properties + properties_extension) + one-shot
backfill from property_details.listing_events for pre-trigger history.
Tax reassessment forecast IL · Partial reset (capped growth)
- Current annual tax
- $1,093 · $91/mo
- Projected year-2 tax
- $1,318 · $110/mo
- Expected delta
- +$225/yr (+$19/mo · 20.6%)
ⓘ Screening estimate from a state-policy table — verify with the county assessor before closing.
Climate risk First Street
- Flood 1/10 Low FEMA zone X · 0% chance over 30 yrs
- Wildfire 1/10 Low
- Heat 3/10 Moderate 7 d/yr ≥104°F today · 18 d/yr by 30 yrs out
- Wind 2/10 Low 100% chance of damaging wind over 30 yrs
- Air quality 3/10 Moderate 1 unhealthy d/yr today · 3 by 30 yrs out
Nearby sold comps map
Loading sold comps map…
Walkable amenities ~0.75 mi
Loading nearby amenities…
Taxation est. · year 1
- Rental income
- $12,643
- − Mortgage interest
- −$3,809
- − Property taxes
- −$1,093
- − Insurance
- −$340
- − Repairs & maintenance
- −$1,011
- − Management
- −$1,011
- − Depreciation
- −$1,978
- Taxable income
- $3,400
- Est. tax owed @ 24.0%
- −$816
- After-tax cash flow
- $3,460/yr
For passive investors: Depreciation is non-cash, so a rental often shows a tax loss while cash-flowing — sheltering income. Rental losses are passive: they offset passive income freely, and up to $25,000/yr can offset ordinary (W-2) income if you actively participate and your MAGI is under $100k (phasing out to $0 by $150k); unused losses carry forward. On sale, claimed depreciation is recaptured at up to 25%, and gains may owe capital-gains tax (a 1031 exchange can defer both). Figures are a year-1 estimate at your 24.0% rate — not tax advice; consult a CPA.
Schools (NCES district)
- District
- Peoria SD 150
- NCES district ID
- 1731230
- Math proficiency
- 11% ▼ -5.00%
- Reading proficiency
- 14% ▼ -4.00%
- Median HH income
- $41,951
- Composite
- 10.92/100
- National rank
- #9751
- State rank
- #554 of 620 in IL
Livability — Peoria
- Score
- 73/100
- State rank
- #270
- US rank
- #5096
Category grades
Schools grade is shown separately in the Schools card above.
Census & demographics
- Census place
- Peoria, IL
- County
- Peoria County · 120,495 people
- City population
- 114,670
- Metro
- Peoria, IL
- Population (ZIP)
- 15,356
- Household income
- $41,618
- Rent vs Own
- Severe rent burden
- 849.0
Population outlook (Peoria County) Hauer SSP2
- Today (2025)
- 183,007 people
- By 2030
- 179,643 · -1.8%
- By 2040
- 171,782 · -6.1%
- By 2050
- 163,508 · -10.7%
- By 2075
- 140,178 · -23.4%
- By 2100
- 114,493 · -37.4%
Race, ethnicity, and origin ACS 2023
- Neighborhood character
- Diverse neighborhood (Simpson 0.68)
- Race & ethnicity
- Black 43% White 36% Two or more races 12% Hispanic / Latino 10% Asian 1%
- Hispanic origin (detail)
- Mexican 7%
- Common ancestry
- Italian 2% Slovak 1% Lithuanian 1%
- Foreign-born
- 7% · Canada
- Languages at home
- 91% English-only · Spanish 6% Tagalog/Filipino 1%
Political lean MEDSL · Peoria
- 2024 margin
- Toss-up / Even · D 51.5% · R 46.9% · Other 1.6%
- 2008→2024 swing
- -9.2pp toward R · 2008: 13.9pp · 2024: 4.7pp
- All cycles
- 2024: D+4.7 2020: D+6.3 2016: D+2.8 2012: D+4.4 2008: D+13.9
Not yet ingested
- Civics
- —
Market trends
- HPI YoY
- ▼ -65.98%
- Current HPI
- 141.5343
- Rent YoY
- ▲ 3.49%
- Metro
- Peoria, IL
- State GDP YoY
- ▲ 1.59%
- F500 in state
- 60
Industry mix (Fortune 500 HQ in IL)
| Industry | F500 HQs | Revenue |
|---|---|---|
| Insurance | 4 | $201B |
|
||
| Consumer Goods | 4 | $87B |
|
||
| Industrial Machinery | 3 | $64B |
|
||
| Healthcare | 2 | $55B |
|
||
| Retail / Pharmacy | 1 | $148B |
|
||
| Agriculture / Food | 1 | $86B |
|
||
Price history
+90.8% since first listed12 events — show timeline
- 2026-05-22 Listed $72,500 RMLSA as Distributed by MLS Grid
- 2025-12-17 Listing Removed — MRED as Distributed by MLS Grid
- 2022-10-20 Sold (MLS) $35,000 RMLSA as Distributed by MLS Grid
- 2022-10-08 Pending — RMLSA as Distributed by MLS Grid
- 2022-10-04 Listed $34,900 RMLSA as Distributed by MLS Grid
- 2021-08-06 Listing Removed — RMLSA as Distributed by MLS Grid
- 2021-08-06 Listing Removed — RMLSA as Distributed by MLS Grid
- 2021-08-06 Listing Removed — RMLSA as Distributed by MLS Grid
- 2006-09-01 Sold (Public Records) $37,000 Public Records
- 2006-08-31 Sold (MLS) $36,900 RMLSA as Distributed by MLS Grid
- 2006-06-11 Listed $36,900 RMLSA as Distributed by MLS Grid
- 2005-05-16 Sold (Public Records) $38,000 Public Records
Property tax history
+6.9%/yrLatest (2024): $1,093 · +4.8% YoY. Source: county tax records.
Cash-flow waterfall
monthlySold comps — $/sqft
last 12 mo · ≤1 miLoading sold comps…