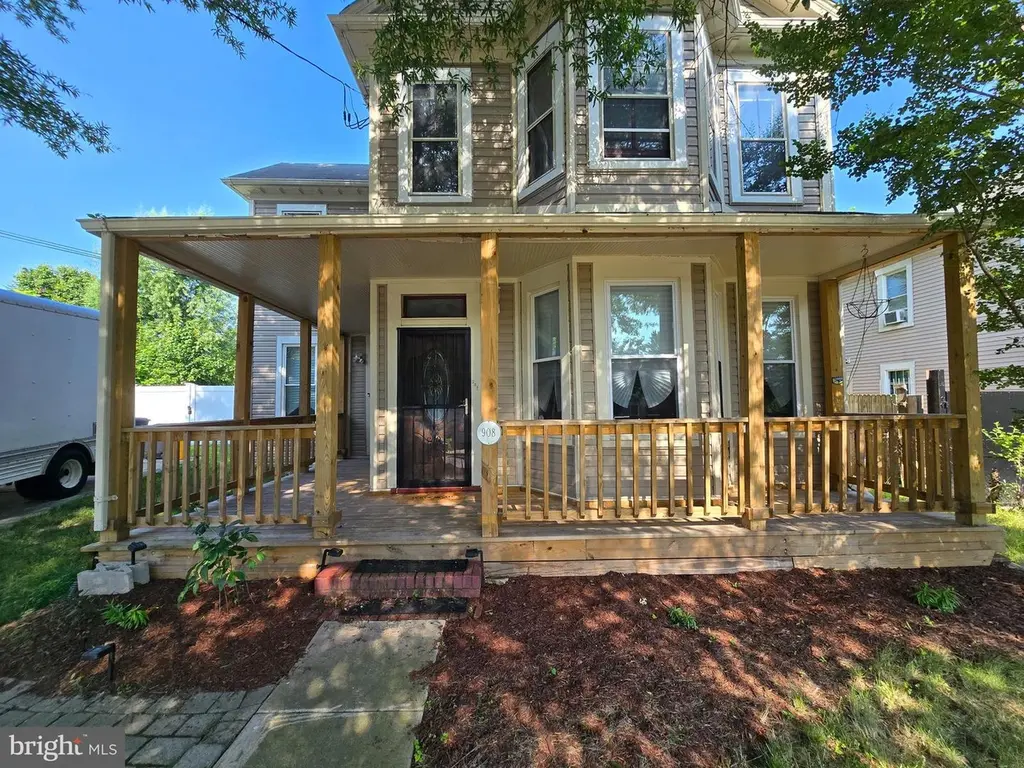
908 59th · Fairmount Heights, MD
Flood risk 1/10 · Minimal
- FEMA flood zone
- X (unshaded)
- Chance of flooding over 30 yrs
- 0.0%
- Est. flood insurance / yr
- $507 – $1,088
Fire risk 1/10 · Minimal
- Est. fire insurance / yr
- $755 – $1,403
Heat risk 8/10 · Major
- Hot days now (above 104°F)
- 7 days/yr
- Hot days in 30 yrs
- 15 days/yr
Wind risk 4/10 · Minor
- Chance of severe wind over 30 yrs
- 21.0%
Air-quality risk 4/10 · Minor
- Unhealthy air days now
- 4 days/yr
- Unhealthy air days in 30 yrs
- 5 days/yr
Risk factors via First Street. Map © Google.
Why this score? — see what drove the C- grade
The composite is a weighted blend of 9 inputs, each scored 0–100. Each bar is that input's sub-score; the figure is the points it added to the 100-point composite (weight × sub-score).
- Cash flow +22.4/30.0
- ARV discount +8.1/15.0
- DSCR +7.2/10.0
- 1% rule +5.7/10.0
- Rent growth +4.0/5.0
- Livability +3.5/5.0
- Condition / age +2.5/5.0
- Schools +1.7/10.0
- Appreciation +0.0/10.0
$400,000
🖨 Deal sheet 📄 Offer letter ✓ Due diligence
Listing remarks MLS
Tucked on a quiet, tree-lined street in Fairmount Heights, this 5-bedroom, 2-bath home is ready for you to move right in and make it yours. Inside, you'll find original character, abundant natural light, an updated kitchen, and a finished basement that’s perfect for a home office, playroom, or additional living space. Outside, enjoy a spacious backyard ideal for entertaining, gardening, or future improvements. Property features include: Five bedrooms with ample space Historic charm with modern updates Move-in ready with opportunity to customize Convenient location just minutes from DC, Metro access, and major highways This is a rare opportunity to own a spacious home in a prime location at a competitive price. * * * * * * * * * * * * * * * * * * Property is being sold strictly AS-IS. * * * * * * * * * * * * * * * * * * * * * * * * * * * Schedule your showing today.
Key facts
- Spacious backyard
- Finished basement
- Updated kitchen
Tags
Neighborhood map
What this means for you Summary
Snapshot
- This is a 5-bed/2.0-bath single-family listed at $400k.
Deal economics
- At list price, monthly cash flow is $663 ($8k/yr) — positive.
- The deal already cash-flows at list — no discount required.
- Meets the 1% rule at list price ($4k rent vs $400k).
- Recommended offer: $388k (3.0% below list) — sets the bar for market timing.
- Cap rate 8.3% vs local median 5.0% in Fairmount Heights — top-decile yield for the area; either an underpriced asset or a hidden risk that comps aren't pricing in. Stress-test before assuming the spread holds.
Location & tenants
- Location reads 69/100 on livability (#195 in MD) — a middle-class / working-renter tenant base. Strengths: commute A+, housing A+, employment A-; Watch: crime F, amenities F, cost of living F.
- Prince George'S County Public Schools (suburban): math 8% / reading 24% proficiency, ranked #21 of 24 in MD (top 88%) — low school quality limits family demand, transient renter base, plan for 1-2y turnover.
- Market conditions: Rents rising fast (+5.9%/yr); 217 active listings in the ZIP; 14 comparable units currently listed for rent nearby; rentals at typical pace (median 25d on market — plan ~3-4 weeks tenant-placement turnaround); solid renter incomes; 1,481 units permitted in Prince George's County in 2024 (0 in 5+ unit buildings).
- At $4,290/mo this rent would consume 67% of the median local household income ($76k/yr) (locally 1418% of renters already pay >50% of income on rent) — very limited rent-growth headroom before tenants either downsize or default.
Forward outlook
- Local home prices are declining (-3.0%/yr); year-one equity from $3k of loan paydown is wiped out by about $12k of value loss. Plan a longer hold.
- Prince George's County population projected at +18% by 2050 — long-run rental-demand tailwind backs the buy-and-hold thesis.
- At projected returns (-3.0% appreciation + 5.9% rent growth), your $112k cash investment doubles in ~10 years — after that, you're playing with house money.
Negotiation context
- It's been on market 57 days — a 3% lower offer ($388k) is reasonable based on typical stale-listing flexibility.
- 9 sale attempts since 23y ago with the ask held roughly flat each time — persistent listings suggest the price (not the market) is what's stuck; bring a comps-based counter.
- Current owner paid $260k; list at $400k implies a 54% gain — meaningful room to come down on a strong offer.
Risks & watch-outs
- Watch-outs: built in 1915 — expect roof / HVAC / electrical / plumbing capex.
- Climate carrying-cost: extreme-heat days projected 7→15/yr by 2055 (HVAC capex compounding) — expect insurance premiums to compound above CPI over the hold.
Questions for the listing agent
- It's been on market 57 days. Have you received any prior offers? Is the seller open to a 3% concession, seller financing, or rate buy-down credit?
- Built in 1915 — when were the roof, HVAC, electrical panel, plumbing, and water heater last replaced?
- Is there a deadline driving the sale (1031 exchange, divorce, estate, relocation)? That informs how much negotiation room exists.
- Schools are B-rated — typically a magnet for longer-tenancy family renters. What's the average tenant stay here, and is there a school-zone premium baked into asking?
- Crime grade is F in this area — have there been break-ins, vandalism, or insurance claims at this property in the last 3 years? What carrier currently insures it and at what premium?
- What's the average days-on-market for RENTAL listings here right now (not sales)? A rising rental-DOM trend means longer vacancies and softer asking-rent achievability than the comps imply.
- What's the recent tenant-quality profile in this submarket — average credit score on applications, eviction rate, late-payment / NSF rate, and stable-employment percentage? A property-management company in the area should have these aggregated.
- How much new for-sale + rental construction is in the pipeline within 1–3 miles? Heavy new supply typically softens prices + rents 12–24 months out; constrained supply supports both.
Investment metrics
- 1% rule
- 1.07% ✓
- Cap rate
- 8.28%
- Cash-on-cash
- 7.10%
- DSCR
- 1.32
- GRM
- 7.8
CMA / ARV
- ARV (median comp)
- $405,215
- List price
- $400,000
- Delta
- -1.29%
- Verdict
- FAIR
- Comps
- 20 within 1.0 mi
Show comp detail 12 sales within ~0.75 mi
| Address | Dist | Beds/Ba | Sqft | Sold | Price | $/sf | Match |
|---|---|---|---|---|---|---|---|
| 5909 K St | 0.08mi | 5/2.0 | 2,100 (+4%) | 9mo | $438,000 | $209 | 83 |
| 1034 58th Ave | 0.13mi | 4/2.0 (-1) | 1,992 (-2%) | 6mo | $405,000 | $203 | 82 |
| 923 57th Pl | 0.12mi | 4/2.0 (-1) | 1,920 (-5%) | 4mo | $465 | — | 78 |
| 505 62nd Ave | 0.43mi | 4/3.0 (-1) | 2,055 (+2%) | 10mo | $420,000 | $204 | 60 |
| 602 63rd Pl | 0.48mi | 5/2.0 | 1,848 (-9%) | 9mo | $430,000 | $233 | 56 |
| 6219 L St | 0.40mi | 4/2.5 (-1) | 1,920 (-5%) | 13mo | $595,000 | $310 | 55 |
| 5030 Lee St NE | 0.63mi | 4/2.5 (-1) | 2,064 (+2%) | 7mo | $440,000 | $213 | 54 |
| 4816 Leroy Gorham Dr | 0.54mi | 4/2.0 (-1) | 1,896 (-6%) | 11mo | $408,000 | $215 | 50 |
| 1004 Minna Ave | 0.62mi | 4/3.5 (-1) | 1,904 (-6%) | 5mo | $515,000 | $270 | 46 |
| 1417 Farmingdale Ave | 0.61mi | 5/2.0 | 2,266 (+12%) | 7mo | $400,000 | $177 | 46 |
| 6200 Foote St | 0.37mi | 4/3.0 (-1) | 1,752 (-13%) | 14mo | $403,000 | $230 | 39 |
| 5643 Clay Pl NE | 0.59mi | 4/3.0 (-1) | 1,800 (-11%) | 14mo | $488,000 | $271 | 33 |
Match score weights: distance 35% · size 25% · config 20% · recency 20%. Top-matched comps best support the ARV.
Projected returns pro-forma
-3.0% appreciation · 5.9% rent growth · sell at horizon
- IRR
- -2.2%
- Equity multiple
- 0.91×
- Total profit
- $-9,666
- Equity at exit
- $59,641
- IRR
- 10.4%
- Equity multiple
- 1.91×
- Total profit
- $102,223
- Equity at exit
- $34,585
Cash invested: $112,000 (down + closing). Projections, not guarantees.
Landlord ↔ Tenant lean methodology
- Overall (STATE)
- 27 Tenant-Leaning
- State Maryland
- 27 Tenant-Leaning · D+14
- County
- — inherits STATE
- City
- — inherits STATE
ZIP-level market 20743
- Rents YoY
- 5.9%
- Active inventory
- 217
- Price-to-rent
- 7.8×
Monthly cashflow live
- Estimated rent
- $4,290 high interval (Pro) →
- Mortgage (P&I)
- −$2,098
- Tax from tax record
- −$462 /mo · $5,539/yr
- Insurance
- −$167
- HOA
- −$0
- Vacancy / Maint / Mgmt
- −$901
- Net cashflow
- $663
Break-even live
UW: 25.0% down · 7.5% · 30yr · 1.5% tax · 5.0% vac · 8.0% maint · 8.0% mgmt
Financing live
Cash to close
- Down payment
- $100,000
- Closing costs
- $12,000
- Reserves months
- —
- Total cash needed
- —
Loan-product check · same deal, 3 products live
Conventional
25% down · 7.5% · 30yr
- Down + closing
- —
- Monthly P&I
- —
- Monthly cashflow
- —
- DSCR
- —
- Eligible?
- —
Personal DTI + credit; lowest rate.
DSCR
20% down · 8.5% · 30yr
- Down + closing
- —
- Monthly P&I
- —
- Monthly cashflow
- —
- DSCR
- —
- Eligible?
- —
No personal income docs; deal must DSCR.
Hard money
10% down · 12.0% · 12mo
- Down + closing
- —
- Monthly P&I
- —
- Monthly cashflow
- —
- DSCR
- —
- Eligible?
- —
Short-term bridge; refi at stabilization.
Rent comps 14 comps
| Address | Beds | Baths | Sqft | Rent | $/sqft | DOM | Units | Dist |
|---|---|---|---|---|---|---|---|---|
| 5501 Jay St NE Washington, DC | 4.0 | 3.0 | 1848 | $3,300 | $1.79 | 24d | 1 | 0.31mi |
| 6005 Eads St NE Apt 1 Washington, DC | 5.0 | 3.0 | 1750 | $6,100 | $3.49 | 24d | 1 | 0.45mi |
| 5333 Hayes St NE Washington, DC | 5.0 | 2.5 | 2500 | $7,000 | $2.80 | 24d | 1 | 0.46mi |
| 520 56th St NE Washington, DC | 5.0 | 2.0 | 1670 | $5,500 | $3.29 | 24d | 1 | 0.46mi |
| 4802 Leroy Gorham Dr Capitol Heights, MD | 4.0 | 3.5 | 2000 | $3,250 | $1.62 | 18d | 1 | 0.57mi |
| 4802 Leroy Gorham Dr Capitol Heights, MD | 4.0 | 3.5 | 1482 | $3,500 | $2.36 | 3d | 1 | 0.57mi |
| 1604 Woodhill Ct Hyattsville, MD | 6.0 | 3.0 | 1455 | $3,600 | $2.47 | 44d | 1 | 0.76mi |
| 522 70th St Capitol Heights, MD | 4.0 | 1.5 | 1840 | $3,000 | $1.63 | 3d | 1 | 0.76mi |
| 522 70th St Capitol Heights, MD | 4.0 | 1.5 | 1820 | $3,000 | $1.65 | 44d | 1 | 0.76mi |
| 1316 Eastern Ave NE Washington, DC | 4.0 | 2.0 | 1548 | $3,200 | $2.07 | 24d | 1 | 0.83mi |
| 574 49th Pl NE Unit Upper Washington, DC | 5.0 | 2.0 | 1744 | $6,500 | $3.73 | 20d | 1 | 0.91mi |
| 6400 Adak St Capitol Heights, MD | 6.0 | 2.0 | 1405 | $3,150 | $2.24 | 44d | 1 | 1.37mi |
| 4262 Clay St NE Washington, DC | 5.0 | 2.0 | 3000 | $7,400 | $2.47 | 15d | 1 | 1.37mi |
| 5005 Call Pl SE Unit 9 Washington, DC | 5.0 | 2.0 | 1800 | $6,000 | $3.33 | 24d | 1 | 1.44mi |
Listing history 42 events
-
2026-06-18days on market $400,000 Active 57 DOM
-
2026-06-17days on market $400,000 Active 56 DOM
-
2026-06-16days on market $400,000 Active 55 DOM
-
2026-06-15days on market $400,000 Active 54 DOM
-
2026-06-13days on market $400,000 Active 52 DOM
-
2026-06-10days on market $400,000 Active 48 DOM
-
2026-06-08days on market $400,000 Active 47 DOM
-
2026-06-07days on market $400,000 Active 46 DOM
-
2026-06-04days on market $400,000 Active 43 DOM
-
2026-06-03days on market $400,000 Active 42 DOM
-
2026-06-02days on market $400,000 Active 41 DOM
-
2026-06-01days on market $400,000 Active 40 DOM
-
2026-05-31days on market $400,000 Active 39 DOM
-
2026-04-22$400,000 Active 927-char remark
Show marketing remark (927 chars)
Tucked on a quiet, tree-lined street in Fairmount Heights, this 5-bedroom, 2-bath home is ready for you to move right in and make it yours. Inside, you'll find original character, abundant natural light, an updated kitchen, and a finished basement that’s perfect for a home office, playroom, or additional living space. Outside, enjoy a spacious backyard ideal for entertaining, gardening, or future improvements. Property features include: Five bedrooms with ample space Historic charm with modern updates Move-in ready with opportunity to customize Convenient location just minutes from DC, Metro access, and major highways This is a rare opportunity to own a spacious home in a prime location at a competitive price. * * * * * * * * * * * * * * * * * * Property is being sold strictly AS-IS. * * * * * * * * * * * * * * * * * * * * * * * * * * * Schedule your showing today.
-
2026-02-09status Pending
-
2026-02-09historical
-
2026-01-13status Active
-
2026-01-08status Pending
-
2026-01-03$350,000 Active
-
2026-01-01historical
-
2025-11-04price $375,000
-
2025-09-04price $450,000
-
2025-07-10$500,000 Active
-
2025-07-08historical
-
2020-06-18soldstatus $260,000
-
2020-05-18soldstatus $260,000 Closed
-
2020-02-22status Pending
-
2020-02-06status Active
-
2020-01-19status Pending
-
2020-01-02price $245,000
-
2020-01-02status Active
-
2019-12-31historical
-
2019-10-18status Active
-
2019-09-27status Pending
-
2019-09-23$260,000 Active
-
2003-12-08soldstatus $198,000
-
2003-12-01soldstatus $198,000
-
2003-10-23historical
-
2003-06-18$198,000
-
1993-03-11soldstatus $51,000
-
1992-11-25soldstatus $75,000
-
1989-06-26soldstatus $76,500
ⓘ Source: listings_history table (triggers on properties + properties_extension) + one-shot
backfill from property_details.listing_events for pre-trigger history.
Tax reassessment forecast MD · Partial reset (capped growth)
- Current annual tax
- $5,539 · $462/mo
- Projected year-2 tax
- $5,539 · $462/mo
- Expected delta
- $0/yr ($0/mo · 0.0%)
ⓘ Screening estimate from a state-policy table — verify with the county assessor before closing.
Climate risk First Street
- Flood 1/10 Low FEMA zone X (unshaded) · 0% chance over 30 yrs
- Wildfire 1/10 Low
- Heat 8/10 Severe 7 d/yr ≥104°F today · 15 d/yr by 30 yrs out
- Wind 4/10 Moderate 21% chance of damaging wind over 30 yrs
- Air quality 4/10 Moderate 4 unhealthy d/yr today · 5 by 30 yrs out
Nearby sold comps map
Loading sold comps map…
Walkable amenities ~0.75 mi
Loading nearby amenities…
Taxation est. · year 1
- Rental income
- $51,477
- − Mortgage interest
- −$22,406
- − Property taxes
- −$5,539
- − Insurance
- −$2,000
- − Repairs & maintenance
- −$4,118
- − Management
- −$4,118
- − Depreciation
- −$11,636
- Taxable income
- $1,660
- Est. tax owed @ 24.0%
- −$398
- After-tax cash flow
- $7,558/yr
For passive investors: Depreciation is non-cash, so a rental often shows a tax loss while cash-flowing — sheltering income. Rental losses are passive: they offset passive income freely, and up to $25,000/yr can offset ordinary (W-2) income if you actively participate and your MAGI is under $100k (phasing out to $0 by $150k); unused losses carry forward. On sale, claimed depreciation is recaptured at up to 25%, and gains may owe capital-gains tax (a 1031 exchange can defer both). Figures are a year-1 estimate at your 24.0% rate — not tax advice; consult a CPA.
Schools (NCES district)
- District
- Prince George'S County Public Schools
- NCES district ID
- 2400510
- Math proficiency
- 8% ▼ -11.00%
- Reading proficiency
- 24% ▼ -9.00%
- Median HH income
- $73,967
- Composite
- 16.82/100
- National rank
- #9151
- State rank
- #21 of 24 in MD
Livability — Fairmount Heights
- Score
- 69/100
- State rank
- #195
- US rank
- #8961
Category grades
Schools grade is shown separately in the Schools card above.
Census & demographics
- Census place
- Fairmount Heights, MD
- County
- Prince Georges County · 919,866 people
- Metro
- Washington-Arlington-Alexandria, DC-VA-MD-WV
- Population (ZIP)
- 41,093
- Household income
- $76,466
- Rent vs Own
- Severe rent burden
- 1418.0
Population outlook (Prince George's County) Hauer SSP2
- Today (2025)
- 1,005,426 people
- By 2030
- 1,048,416 · +4.3%
- By 2040
- 1,123,425 · +11.7%
- By 2050
- 1,183,220 · +17.7%
- By 2075
- 1,306,202 · +29.9%
- By 2100
- 1,408,179 · +40.1%
Race, ethnicity, and origin ACS 2023
- Neighborhood character
- Predominantly Black (78%)
- Race & ethnicity
- Black 78% Hispanic / Latino 16% Two or more races 4% White 3% Asian 1%
- Hispanic origin (detail)
- Mexican 2% Puerto Rican 2%
- Foreign-born
- 16% · Canada
- Languages at home
- 81% English-only · Spanish 13% French/Haitian/Cajun 1%
Political lean MEDSL · Prince George's
- 2024 margin
- Solid D (+75.2) · D 86.3% · R 11.2% · Other 2.5%
- 2008→2024 swing
- -3.3pp toward R · 2008: 78.5pp · 2024: 75.2pp
- All cycles
- 2024: D+75.2 2020: D+80.5 2016: D+81.0 2012: D+80.9 2008: D+78.5
Not yet ingested
- Civics
- —
Market trends
- HPI YoY
- ▼ -311.97%
- Current HPI
- 335.5152
- Rent YoY
- ▲ 5.90%
- Metro
- Washington-Arlington-Alexandria, DC-VA-MD-WV
- State GDP YoY
- ▲ 2.97%
- F500 in state
- 12
Industry mix (Fortune 500 HQ in MD)
| Industry | F500 HQs | Revenue |
|---|---|---|
| Aerospace / Defense | 1 | $71B |
|
||
| Utilities | 1 | $25B |
|
||
| Hotels | 1 | $24B |
|
||
| Consumer Goods | 1 | $7B |
|
||
| Real Estate | 1 | $6B |
|
||
| Chemicals | 1 | $2B |
|
||
Price history
+422.9% since first listed29 events — show timeline
- 2026-04-22 Listed $400,000 BRIGHT MLS
- 2026-02-09 Pending — BRIGHT MLS
- 2026-02-09 Listing Removed — BRIGHT MLS
- 2026-01-13 Relisted — BRIGHT MLS
- 2026-01-08 Pending — BRIGHT MLS
- 2026-01-03 Listed $350,000 BRIGHT MLS
- 2026-01-01 Listing Removed — BRIGHT MLS
- 2025-11-04 Price Changed $375,000 BRIGHT MLS
- 2025-09-04 Price Changed $450,000 BRIGHT MLS
- 2025-07-10 Listed $500,000 BRIGHT MLS
- 2025-07-08 Coming Soon — BRIGHT MLS
- 2020-06-18 Sold (Public Records) $260,000 Public Records
- 2020-05-18 Sold (MLS) $260,000 BRIGHT MLS
- 2020-02-22 Pending — BRIGHT MLS
- 2020-02-06 Relisted — BRIGHT MLS
- 2020-01-19 Pending — BRIGHT MLS
- 2020-01-02 Price Changed $245,000 BRIGHT MLS
- 2020-01-02 Relisted — BRIGHT MLS
- 2019-12-31 Listing Removed — BRIGHT MLS
- 2019-10-18 Relisted — BRIGHT MLS
- 2019-09-27 Pending — BRIGHT MLS
- 2019-09-23 Listed $260,000 BRIGHT MLS
- 2003-12-08 Sold (Public Records) $198,000 Public Records
- 2003-12-01 Sold (MLS) $198,000 MRIS
- 2003-10-23 Delisted — MRIS
- 2003-06-18 Listed $198,000 MRIS
- 1993-03-11 Sold (Public Records) $51,000 Public Records
- 1992-11-25 Sold (Public Records) $75,000 Public Records
- 1989-06-26 Sold (Public Records) $76,500 Public Records
Property tax history
+8.4%/yrLatest (2025): $5,539 · +8.1% YoY. Source: county tax records.
Cash-flow waterfall
monthlySold comps — $/sqft
last 12 mo · ≤1 miLoading sold comps…