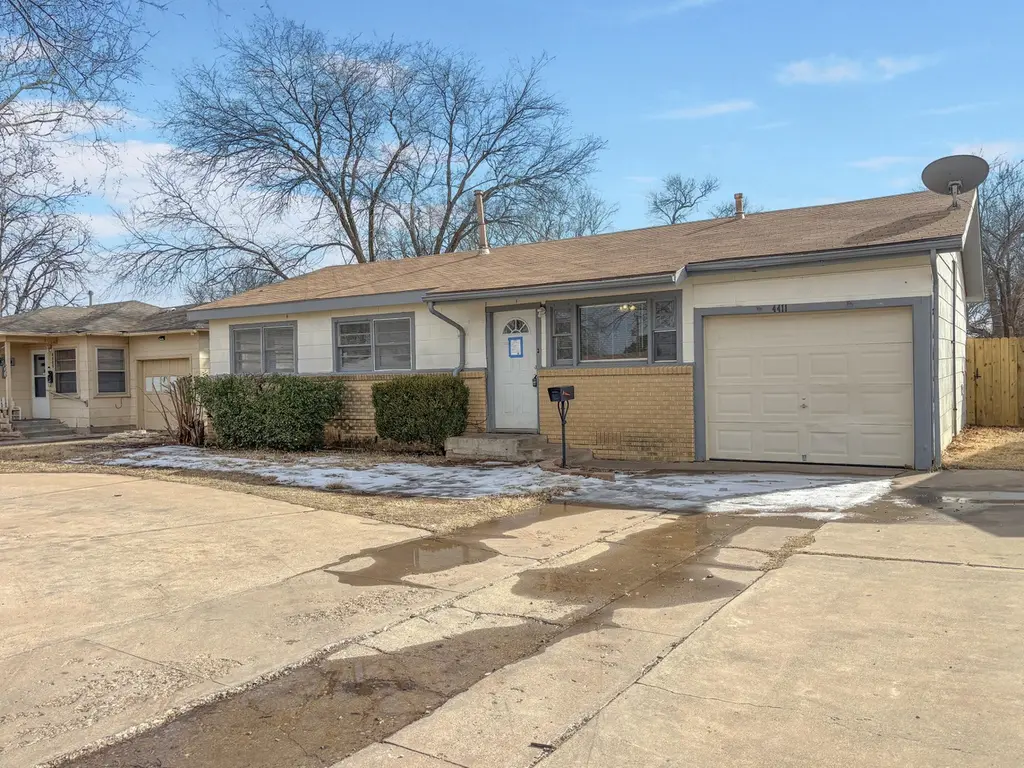
4411 45th St · Lubbock, TX
Flood risk 1/10 · Minimal
- FEMA flood zone
- X (unshaded)
- Chance of flooding over 30 yrs
- 0.0%
- Est. flood insurance / yr
- $507 – $1,088
Fire risk 1/10 · Minimal
- Est. fire insurance / yr
- $1,222 – $2,270
Heat risk 5/10 · Moderate
- Hot days now (above 99°F)
- 7 days/yr
- Hot days in 30 yrs
- 21 days/yr
Wind risk 2/10 · Minimal
- Chance of severe wind over 30 yrs
- —
Air-quality risk 2/10 · Minimal
- Unhealthy air days now
- 1 days/yr
- Unhealthy air days in 30 yrs
- 1 days/yr
Risk factors via First Street. Map © Google.
Why this score? — see what drove the B- grade
The composite is a weighted blend of 9 inputs, each scored 0–100. Each bar is that input's sub-score; the figure is the points it added to the 100-point composite (weight × sub-score).
- Cash flow +23.7/30.0
- ARV discount +15.0/15.0
- DSCR +7.6/10.0
- 1% rule +6.6/10.0
- Livability +4.0/5.0
- Schools +3.1/10.0
- Rent growth +2.6/5.0
- Condition / age +2.5/5.0
- Appreciation +0.0/10.0
$125,000
🖨 Deal sheet 📄 Offer letter ✓ Due diligence
Listing remarks MLS
This home is located in a quiet, established neighborhood in central Lubbock, offering convenient access to schools, shopping, and dining. The low-traffic area and neighborhood stability make this property appealing for long-term tenancy. This property presents a solid opportunity for investors seeking rental income or portfolio growth in a consistently performing area of Lubbock! Schedule a showing to explore the potential this property offers.
Key facts
- Low traffic area
- 7,735 sq ft lot
- Garage
Tags
Neighborhood map
What this means for you Summary
Snapshot
- This is a 3-bed/2.0-bath single-family listed at $125k.
Deal economics
- At list price, monthly cash flow is $238 ($3k/yr) — positive.
- The deal already cash-flows at list — no discount required.
- Meets the 1% rule at list price ($1k rent vs $125k).
- Recommended offer: $123k (1.5% below list) — sets the bar for market timing.
Location & tenants
- Location reads 80/100 on livability (#37 in TX, #1,749 nationally) — a professional / high-income tenant draw. Strengths: commute A+, cost of living A+, housing A+; Watch: employment C-, schools D+, crime F.
- Lubbock ISD (urban): math 36% / reading 39% proficiency, ranked #481 of 826 in TX (top 58%) — families likely to look elsewhere, expect single-tenant / working-renter base with shorter leases; 60% free/reduced lunch — lower-income household profile, screen leases tightly.
- Market conditions: Rents flat; 89 active listings in the ZIP; 40 comparable units currently listed for rent nearby; rentals at typical pace (median 21d on market — plan ~3-4 weeks tenant-placement turnaround); 48% of comp listings sitting > 30 days — soft ceiling on asking rent; 2,219 units permitted in Lubbock County in 2024 (252 in 5+ unit buildings).
- This rent runs 35% of the median local income ($49k/yr) — at the standard rent-burdened threshold; future hikes will face affordability resistance.
Forward outlook
- Local home prices are declining (-3.0%/yr); year-one equity from $864 of loan paydown is wiped out by about $4k of value loss. Plan a longer hold.
- Lubbock County population projected at +39% by 2050 — long-run rental-demand tailwind backs the buy-and-hold thesis.
Negotiation context
- It's been on market 27 days — a 2% lower offer ($123k) is reasonable based on typical stale-listing flexibility.
- 5 sale attempts since 9y ago; this cycle's ask has dropped $10k (7%) from the opening price — seller is motivated, your offer sets the floor, not the list.
Risks & watch-outs
- Watch-outs: built in 1956 — expect roof / HVAC / electrical / plumbing capex.
- Climate carrying-cost: extreme-heat days projected 7→21/yr by 2055 (HVAC capex compounding) — expect insurance premiums to compound above CPI over the hold.
Questions for the listing agent
- Built in 1956 — when were the roof, HVAC, electrical panel, plumbing, and water heater last replaced?
- Is there a deadline driving the sale (1031 exchange, divorce, estate, relocation)? That informs how much negotiation room exists.
- Schools are D-rated, which usually means shorter tenancies and higher turnover. Who's the typical renter profile here, and what's been the actual vacancy rate?
- Crime grade is F in this area — have there been break-ins, vandalism, or insurance claims at this property in the last 3 years? What carrier currently insures it and at what premium?
- What's the average days-on-market for RENTAL listings here right now (not sales)? A rising rental-DOM trend means longer vacancies and softer asking-rent achievability than the comps imply.
- What's the recent tenant-quality profile in this submarket — average credit score on applications, eviction rate, late-payment / NSF rate, and stable-employment percentage? A property-management company in the area should have these aggregated.
- How much new for-sale + rental construction is in the pipeline within 1–3 miles? Heavy new supply typically softens prices + rents 12–24 months out; constrained supply supports both.
Investment metrics
- 1% rule
- 1.16% ✓
- Cap rate
- 8.58%
- Cash-on-cash
- 8.16%
- DSCR
- 1.36
- GRM
- 7.2
CMA / ARV
- ARV (median comp)
- $206,861
- List price
- $125,000
- Delta
- -39.57%
- Verdict
- UNDERPRICED
- Comps
- 1 within 2.0 mi
Projected returns pro-forma
-3.0% appreciation · 0.56% rent growth · sell at horizon
- IRR
- -6.7%
- Equity multiple
- 0.76×
- Total profit
- $-8,519
- Equity at exit
- $18,638
- IRR
- -0.6%
- Equity multiple
- 0.96×
- Total profit
- $-1,245
- Equity at exit
- $10,808
Cash invested: $35,000 (down + closing). Projections, not guarantees.
Landlord ↔ Tenant lean methodology
- Overall (STATE)
- 87 Strongly Landlord-Friendly
- State Texas
- 87 Strongly Landlord-Friendly · R+5
- County
- — inherits STATE
- City
- — inherits STATE
ZIP-level market 79414
- Home prices YoY
- -27.8%
- Rents YoY
- 0.6%
- Active inventory
- 89
- Price-to-rent
- 7.2×
Monthly cashflow live
- Estimated rent
- $1,444 high interval (Pro) →
- Mortgage (P&I)
- −$656
- Tax from tax record
- −$195 /mo · $2,342/yr
- Insurance
- −$52
- HOA
- −$0
- Vacancy / Maint / Mgmt
- −$303
- Net cashflow
- $238
Break-even live
UW: 25.0% down · 7.5% · 30yr · 1.5% tax · 5.0% vac · 8.0% maint · 8.0% mgmt
Financing live
Cash to close
- Down payment
- $31,250
- Closing costs
- $3,750
- Reserves months
- —
- Total cash needed
- —
Loan-product check · same deal, 3 products live
Conventional
25% down · 7.5% · 30yr
- Down + closing
- —
- Monthly P&I
- —
- Monthly cashflow
- —
- DSCR
- —
- Eligible?
- —
Personal DTI + credit; lowest rate.
DSCR
20% down · 8.5% · 30yr
- Down + closing
- —
- Monthly P&I
- —
- Monthly cashflow
- —
- DSCR
- —
- Eligible?
- —
No personal income docs; deal must DSCR.
Hard money
10% down · 12.0% · 12mo
- Down + closing
- —
- Monthly P&I
- —
- Monthly cashflow
- —
- DSCR
- —
- Eligible?
- —
Short-term bridge; refi at stabilization.
Rent comps 40 comps
| Address | Beds | Baths | Sqft | Rent | $/sqft | DOM | Units | Dist |
|---|---|---|---|---|---|---|---|---|
| 4310 42nd St Lubbock, TX | 3.0 | 2.0 | 1754 | $1,700 | $0.97 | 44d | 1 | 0.27mi |
| 4413 40th St Lubbock, TX | 3.0 | 1.0 | 1152 | $1,350 | $1.17 | 21d | 1 | 0.27mi |
| 4315 41st St Lubbock, TX | 3.0 | 2.0 | 1558 | $1,450 | $0.93 | 21d | 1 | 0.27mi |
| 4602 50th St Lubbock, TX | 1.0–3.0 | 1.0–2.5 | 1080 | $1,368 | $1.27 | 13d | 9 | 0.32mi |
| 4619 43rd St Lubbock, TX | 3.0 | 1.0 | 1404 | $1,500 | $1.07 | 44d | 1 | 0.34mi |
| 4211 41st St Lubbock, TX | 4.0 | 2.0 | 1960 | $1,599 | $0.82 | 44d | 1 | 0.35mi |
| 4708 43rd St Lubbock, TX | 3.0 | 1.5 | 1249 | $1,350 | $1.08 | 44d | 1 | 0.39mi |
| 4320 52nd St Unit B Lubbock, TX | 2.0 | 1.5 | 1200 | $1,395 | $1.16 | 44d | 1 | 0.40mi |
| 4707 42nd St Lubbock, TX | 3.0 | 1.0 | 1053 | $1,049 | $1.00 | 13d | 1 | 0.41mi |
| 4314 52nd St Unit A Lubbock, TX | 3.0 | 2.0 | 1863 | $1,400 | $0.75 | 21d | 1 | 0.41mi |
| 4210 52nd St Lubbock, TX | 3.0 | 2.0 | 1715 | $1,575 | $0.92 | 13d | 1 | 0.46mi |
| 4803 43rd St Lubbock, TX | 3.0 | 2.0 | 1412 | $1,200 | $0.85 | 21d | 1 | 0.49mi |
| 4313 53rd St Unit B Lubbock, TX | 2.0 | 1.5 | 1368 | $1,200 | $0.88 | 44d | 1 | 0.51mi |
| 4815 43rd St Lubbock, TX | 3.0 | 2.0 | 1282 | $1,500 | $1.17 | 21d | 1 | 0.56mi |
| 4819 44th St Lubbock, TX | 3.0 | 2.0 | 1412 | $1,300 | $0.92 | 44d | 1 | 0.57mi |
| 4213 54th St Lubbock, TX | 3.0 | 2.0 | 1680 | $1,550 | $0.92 | 13d | 1 | 0.60mi |
| 3712 47th St Lubbock, TX | 3.0 | 2.0 | 1767 | $1,400 | $0.79 | 21d | 1 | 0.61mi |
| 4817 40th St Lubbock, TX | 3.0 | 2.0 | 1254 | $1,300 | $1.04 | 13d | 1 | 0.64mi |
| 4324 56th St Lubbock, TX | 4.0 | 2.0 | 2014 | $2,000 | $0.99 | 44d | 1 | 0.66mi |
| 4916 46th St Lubbock, TX | 3.0 | 2.0 | 1377 | $1,450 | $1.05 | 13d | 1 | 0.66mi |
| 4907 41st St Lubbock, TX | 3.0 | 2.0 | 1196 | $1,200 | $1.00 | 44d | 1 | 0.67mi |
| 4926 48th St Lubbock, TX | 3.0 | 2.0 | 1354 | $1,500 | $1.11 | 21d | 1 | 0.68mi |
| 4606 35th St Lubbock, TX | 4.0 | 2.0 | 1684 | $1,800 | $1.07 | 44d | 1 | 0.70mi |
| 5002 46th St Lubbock, TX | 3.0 | 2.0 | 1369 | $1,450 | $1.06 | 44d | 1 | 0.71mi |
| 3612 44th St Lubbock, TX | 3.0 | 2.0 | 1675 | $1,850 | $1.10 | 44d | 1 | 0.72mi |
| 4801 36th St Lubbock, TX | 3.0 | 2.0 | 1424 | $1,275 | $0.90 | 21d | 1 | 0.73mi |
| 3812 36th St Unit A Lubbock, TX | 3.0 | 2.0 | 1458 | $1,500 | $1.03 | 21d | 1 | 0.76mi |
| 4428 33rd St Lubbock, TX | 3.0 | 1.5 | 1685 | $1,375 | $0.82 | 44d | 1 | 0.80mi |
| 3712 37th St Lubbock, TX | 4.0 | 2.0 | 1672 | $2,100 | $1.26 | 44d | 1 | 0.80mi |
| 4430 33rd St Lubbock, TX | 3.0 | 2.0 | 1402 | $1,100 | $0.78 | 44d | 1 | 0.80mi |
| 4818 36th St Lubbock, TX | 3.0 | 2.0 | 1285 | $1,400 | $1.09 | 21d | 1 | 0.80mi |
| 5017 46th St Lubbock, TX | 3.0 | 2.0 | 1753 | $1,600 | $0.91 | 44d | 1 | 0.81mi |
| 4313 58th St Lubbock, TX | 2.0 | 1.5 | 1165 | $1,099 | $0.94 | 44d | 1 | 0.81mi |
| 3631 54th St Lubbock, TX | 2.0 | 1.5 | 1145 | $1,099 | $0.96 | 44d | 1 | 0.82mi |
| 4303 58th St Unit a Lubbock, TX | 2.0 | 1.5 | 1170 | $1,050 | $0.90 | 44d | 1 | 0.82mi |
| 5018 Kenosha Ave Lubbock, TX | 2.0 | 1.5 | 1245 | $1,275 | $1.02 | 13d | 1 | 0.83mi |
| 5101 44th St Lubbock, TX | 3.0 | 2.0 | 1160 | $1,350 | $1.16 | 21d | 1 | 0.84mi |
| 5202 Kenosha Ave Lubbock, TX | 2.0 | 1.0–1.5 | 1082 | $1,022 | $0.94 | 21d | 1 | 0.86mi |
| 4304 32nd St Lubbock, TX | 3.0 | 2.0 | 1174 | $1,395 | $1.19 | 13d | 1 | 0.86mi |
| 5302 Kenosha Ave Unit 5324 Kenosha Lubbock, TX | 2.0 | 1.5 | 1300 | $950 | $0.73 | 13d | 1 | 0.88mi |
Listing history 32 events
-
2026-06-18days on market $125,000 Active 27 DOM
-
2026-06-17days on market $125,000 Active 26 DOM
-
2026-06-16days on market $125,000 Active 25 DOM
-
2026-06-15days on market $125,000 Active 24 DOM
-
2026-06-14days on market $125,000 Active 22 DOM
-
2026-06-13days on market $125,000 Active 21 DOM
-
2026-06-10days on market $125,000 Active 19 DOM
-
2026-06-09days on market $125,000 Active 18 DOM
-
2026-06-08days on market $125,000 Active 17 DOM
-
2026-06-07days on market $125,000 Active 16 DOM
-
2026-06-05days on market $125,000 Active 13 DOM
-
2026-06-03days on market $125,000 Active 12 DOM
-
2026-06-02days on market $125,000 Active 11 DOM
-
2026-06-01days on market $125,000 Active 10 DOM
-
2026-05-31days on market $125,000 Active 9 DOM
-
2026-05-30days on market $125,000 Active 8 DOM
-
2026-04-15price $125,000 450-char remark
Show marketing remark (450 chars)
This home is located in a quiet, established neighborhood in central Lubbock, offering convenient access to schools, shopping, and dining. The low-traffic area and neighborhood stability make this property appealing for long-term tenancy. This property presents a solid opportunity for investors seeking rental income or portfolio growth in a consistently performing area of Lubbock! Schedule a showing to explore the potential this property offers.
-
2026-03-09historical $1,249
-
2026-02-07price $1,249
-
2026-02-04$135,000 Active 450-char remark
Show marketing remark (450 chars)
This home is located in a quiet, established neighborhood in central Lubbock, offering convenient access to schools, shopping, and dining. The low-traffic area and neighborhood stability make this property appealing for long-term tenancy. This property presents a solid opportunity for investors seeking rental income or portfolio growth in a consistently performing area of Lubbock! Schedule a showing to explore the potential this property offers.
-
2026-01-29$1,299
-
2026-01-25historical $1,299
-
2025-11-07price $1,299
-
2025-10-25price $1,349
-
2025-05-22$1,399
-
2024-09-01historical $1,299
-
2024-07-26$1,299
-
2022-07-01price $1,199
-
2017-10-19soldstatus
-
2017-10-16soldstatus 396-char remark
Show marketing remark (396 chars)
This is a great home for investors or first time home buyers. The location is close to Texas Tech and the hospitals. You have the option of 2 living areas or a very large 4th bedroom. The front bathroom has recently been remodeled and the original hardwood floors are still in the home. Enjoy the large backyard and patio for hang outs. Please feel free to call us for more information if needed.
-
2017-09-13$70,000 396-char remark
Show marketing remark (396 chars)
This is a great home for investors or first time home buyers. The location is close to Texas Tech and the hospitals. You have the option of 2 living areas or a very large 4th bedroom. The front bathroom has recently been remodeled and the original hardwood floors are still in the home. Enjoy the large backyard and patio for hang outs. Please feel free to call us for more information if needed.
-
2004-07-01soldstatus
ⓘ Source: listings_history table (triggers on properties + properties_extension) + one-shot
backfill from property_details.listing_events for pre-trigger history.
Tax reassessment forecast TX · Resets to sale price
- Current annual tax
- $2,342 · $195/mo
- Projected year-2 tax
- $2,342 · $195/mo
- Expected delta
- $0/yr ($0/mo · 0.0%)
ⓘ Screening estimate from a state-policy table — verify with the county assessor before closing.
Climate risk First Street
- Flood 1/10 Low FEMA zone X (unshaded) · 0% chance over 30 yrs
- Wildfire 1/10 Low
- Heat 5/10 Major 7 d/yr ≥99°F today · 21 d/yr by 30 yrs out
- Wind 2/10 Low
- Air quality 2/10 Low 1 unhealthy d/yr today · 1 by 30 yrs out
Nearby sold comps map
Loading sold comps map…
Walkable amenities ~0.75 mi
Loading nearby amenities…
Taxation est. · year 1
- Rental income
- $17,326
- − Mortgage interest
- −$7,002
- − Property taxes
- −$2,342
- − Insurance
- −$625
- − Repairs & maintenance
- −$1,386
- − Management
- −$1,386
- − Depreciation
- −$3,636
- Taxable income
- $949
- Est. tax owed @ 24.0%
- −$228
- After-tax cash flow
- $2,627/yr
For passive investors: Depreciation is non-cash, so a rental often shows a tax loss while cash-flowing — sheltering income. Rental losses are passive: they offset passive income freely, and up to $25,000/yr can offset ordinary (W-2) income if you actively participate and your MAGI is under $100k (phasing out to $0 by $150k); unused losses carry forward. On sale, claimed depreciation is recaptured at up to 25%, and gains may owe capital-gains tax (a 1031 exchange can defer both). Figures are a year-1 estimate at your 24.0% rate — not tax advice; consult a CPA.
Schools (NCES district)
- District
- Lubbock ISD
- NCES district ID
- 4828500
- Math proficiency
- 36% ▼ -8.00%
- Reading proficiency
- 39% ▼ -1.00%
- Median HH income
- $39,820
- Composite
- 31.44/100
- National rank
- #5984
- State rank
- #481 of 826 in TX
Livability — Lubbock
- Score
- 80/100
- State rank
- #37
- US rank
- #1749
Category grades
Schools grade is shown separately in the Schools card above.
Census & demographics
- Census place
- Lubbock, TX
- County
- Lubbock County · 293,542 people
- City population
- 283,030
- Metro
- Lubbock, TX
- Population (ZIP)
- 17,596
- Household income
- $49,057
- Rent vs Own
- Severe rent burden
- 1330.0
Population outlook (Lubbock County) Hauer SSP2
- Today (2025)
- 345,960 people
- By 2030
- 371,449 · +7.4%
- By 2040
- 424,539 · +22.7%
- By 2050
- 481,150 · +39.1%
- By 2075
- 633,467 · +83.1%
- By 2100
- 746,853 · +115.9%
Race, ethnicity, and origin ACS 2023
- Neighborhood character
- Diverse neighborhood (Simpson 0.62)
- Race & ethnicity
- White 47% Hispanic / Latino 39% Two or more races 21% Black 9% Asian 1%
- Hispanic origin (detail)
- Mexican 30%
- Common ancestry
- Slovak 2% Serbian 1% Italian 1%
- Foreign-born
- 3% · Canada, China
- Languages at home
- 82% English-only · Spanish 16%
Political lean MEDSL · Lubbock
- 2024 margin
- Solid R (+39.5) · D 29.7% · R 69.2% · Other 1.0%
- 2008→2024 swing
- -2.8pp toward R · 2008: -36.7pp · 2024: -39.5pp
- All cycles
- 2024: R+39.5 2020: R+32.2 2016: R+38.4 2012: R+40.9 2008: R+36.7
Not yet ingested
- Civics
- —
Market trends
- HPI YoY
- ▼ -95.31%
- Current HPI
- 247.7963
- Rent YoY
- ▲ 0.56%
- Metro
- Lubbock, TX
- State GDP YoY
- ▲ 3.95%
- F500 in state
- 110
Industry mix (Fortune 500 HQ in TX)
| Industry | F500 HQs | Revenue |
|---|---|---|
| Energy | 16 | $1,198B |
|
||
| Technology | 5 | $198B |
|
||
| Engineering / Construction | 4 | $72B |
|
||
| Energy Services | 3 | $60B |
|
||
| Utilities | 3 | $41B |
|
||
| Healthcare | 2 | $330B |
|
||
Price history
+78.6% since first listed16 events — show timeline
- 2026-04-15 Price Changed $125,000 LARMLS
- 2026-03-09 Rental Removed $1,249 SHOWMOJO
- 2026-02-07 Price Changed $1,249 SHOWMOJO
- 2026-02-04 Listed $135,000 LARMLS
- 2026-01-29 Listed for Rent $1,299 SHOWMOJO
- 2026-01-25 Rental Removed $1,299 SHOWMOJO
- 2025-11-07 Price Changed $1,299 SHOWMOJO
- 2025-10-25 Price Changed $1,349 SHOWMOJO
- 2025-05-22 Listed for Rent $1,399 SHOWMOJO
- 2024-09-01 Rental Removed $1,299 SHOWMOJO
- 2024-07-26 Listed for Rent $1,299 SHOWMOJO
- 2022-07-01 Price Changed $1,199 RENT.
- 2017-10-19 Sold (Public Records) — Public Records
- 2017-10-16 Sold (MLS) — LARMLS
- 2017-09-13 Listed $70,000 LARMLS
- 2004-07-01 Sold (Public Records) — Public Records
Property tax history
+2.2%/yrLatest (2025): $2,342 · +11.0% YoY. Source: county tax records.
Cash-flow waterfall
monthlySold comps — $/sqft
last 12 mo · ≤1 miLoading sold comps…