574 Hospital Dr · Raceland, LA
Flood risk 7/10 · Major
- FEMA flood zone
- AE
- Chance of flooding over 30 yrs
- 0.6%
- Est. flood insurance / yr
- $1,737 – $8,500
Fire risk 1/10 · Minimal
- Est. fire insurance / yr
- $1,269 – $2,357
Heat risk 9/10 · Severe
- Hot days now (above 107°F)
- 7 days/yr
- Hot days in 30 yrs
- 21 days/yr
Wind risk 9/10 · Severe
- Chance of severe wind over 30 yrs
- 99.0%
Air-quality risk 1/10 · Minimal
- Unhealthy air days now
- 0 days/yr
- Unhealthy air days in 30 yrs
- 0 days/yr
Risk factors via First Street. Map © Google.
Why this score? — see what drove the B- grade
The composite is a weighted blend of 9 inputs, each scored 0–100. Each bar is that input's sub-score; the figure is the points it added to the 100-point composite (weight × sub-score).
- Cash flow +30.0/30.0
- 1% rule +10.0/10.0
- DSCR +10.0/10.0
- ARV discount +7.5/15.0
- Schools +3.4/10.0
- Livability +2.9/5.0
- Rent growth +2.5/5.0
- Condition / age +2.5/5.0
- Appreciation +0.0/10.0
$75,000
🖨 Deal sheet 📄 Offer letter ✓ Due diligence
Listing remarks MLS
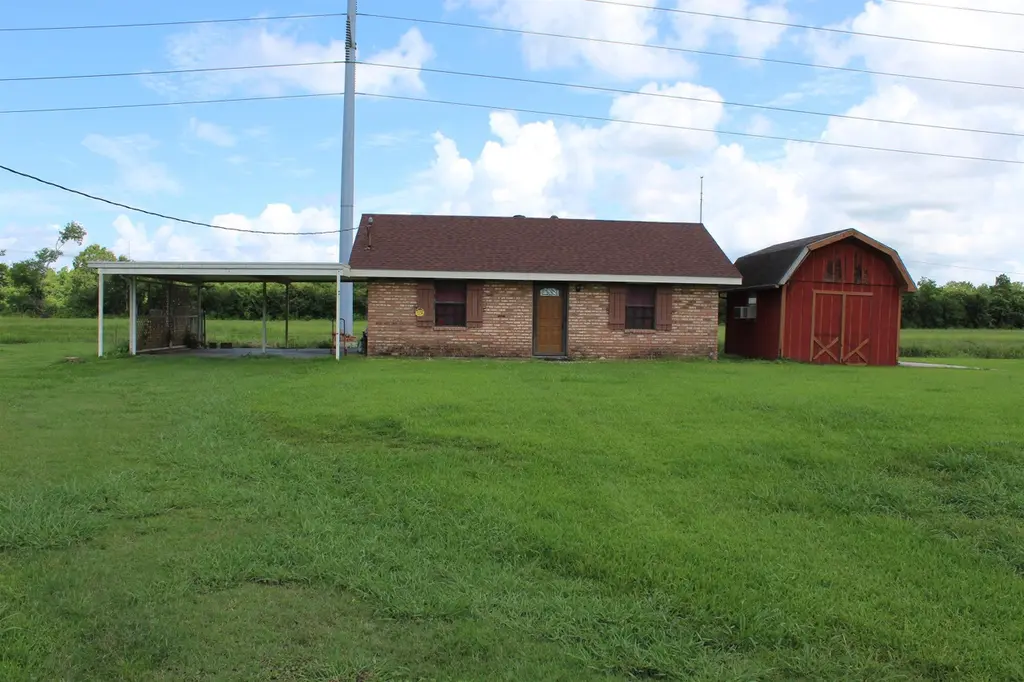
This one-bedroom brick home sits on a huge lot, has a 12 x 14 shed, and a double carport. Appliances remain but are not warranted by seller. Buyer to verify all measurements, zoning, and flood zone classification.
Key facts
- 12 x 14 shed
- Double carport
- Huge lot
Tags
Property features AI
Finance
- Other: Listing broker: CENTRAL LAFOURCHE REALTY LLC; Listing agent: Paula Marschik
- Financial info: Details not provided
- HOA & community: Subdivision: Sunny Acres
Exterior
- Parking: Carport
- Security: Details not provided
- Utilities: Cesspool sewer
- Home design: Detached single-family residence; Residential property
- Construction: Brick construction; Slab foundation; Built details not provided
- Exterior features: Nearly 0.75-acre lot (approx. 140 x 202 + 45 x 100)
Interior
- Kitchen: Details not provided
- Bedrooms: Details not provided
- Flooring: Tile; Concrete; Vinyl
- Bathrooms: 1 full bathroom
- Heating & cooling: Central heating; Central air conditioning
- Interior features: Tile, concrete, and vinyl flooring
- Laundry & utility: Details not provided
Neighborhood map
What this means for you Summary
Snapshot
- This is a 1-bed/1.0-bath single-family listed at $75k.
Deal economics
- At list price, monthly cash flow is $88 ($1k/yr) — positive.
- The deal already cash-flows at list — no discount required.
- Meets the 1% rule at list price ($1k rent vs $75k).
- Cap rate 14.5% vs local median 7.1% in Raceland — top-decile yield for the area; either an underpriced asset or a hidden risk that comps aren't pricing in. Stress-test before assuming the spread holds.
Location & tenants
- Location reads 58/100 on livability (#295 in LA) — a working-class tenant base; expect higher turnover. Strengths: cost of living A+, housing A+; Watch: crime F, amenities F, commute F.
- Lafourche Parish (other): math 31% / reading 49% proficiency, ranked #22 of 98 in LA (top 22%) — families likely to look elsewhere, expect single-tenant / working-renter base with shorter leases.
- Market conditions: 128 active listings in the ZIP; 319 units permitted in Lafourche Parish in 2024 (0 in 5+ unit buildings).
Forward outlook
- Local home prices are declining (-3.0%/yr); year-one equity from $519 of loan paydown is wiped out by about $2k of value loss. Plan a longer hold.
Negotiation context
- Only 10 days on market — expect competitive offers; lowballing is unlikely to land.
- 2 sale attempts; this cycle's ask has dropped $14k (16%) from the opening price — seller is motivated, your offer sets the floor, not the list.
Risks & watch-outs
- Watch-outs: flood insurance adds $427/mo.
- Climate carrying-cost: in FEMA flood zone AE (mandatory federal flood insurance); severe wind risk, 99% chance of damaging wind over 30y; extreme-heat days projected 7→21/yr by 2055 (HVAC capex compounding) — expect insurance premiums to compound above CPI over the hold.
Questions for the listing agent
- What's the actual annual flood-insurance premium (NFIP or private), and is the property in a SFHA with mandatory coverage?
- Is there a deadline driving the sale (1031 exchange, divorce, estate, relocation)? That informs how much negotiation room exists.
- Schools are B-rated — typically a magnet for longer-tenancy family renters. What's the average tenant stay here, and is there a school-zone premium baked into asking?
- Crime grade is F in this area — have there been break-ins, vandalism, or insurance claims at this property in the last 3 years? What carrier currently insures it and at what premium?
- What's the average days-on-market for RENTAL listings here right now (not sales)? A rising rental-DOM trend means longer vacancies and softer asking-rent achievability than the comps imply.
- What's the recent tenant-quality profile in this submarket — average credit score on applications, eviction rate, late-payment / NSF rate, and stable-employment percentage? A property-management company in the area should have these aggregated.
- How much new for-sale + rental construction is in the pipeline within 1–3 miles? Heavy new supply typically softens prices + rents 12–24 months out; constrained supply supports both.
Investment metrics
- 1% rule
- 1.66% ✓
- Cap rate
- 14.53%
- Cash-on-cash
- 29.43%
- DSCR
- 2.31
- GRM
- 5.0
CMA / ARV
No comps found within radius.
Projected returns pro-forma
-3.0% appreciation · 3.0% rent growth · sell at horizon
- IRR
- -8.1%
- Equity multiple
- 0.70×
- Total profit
- $-6,270
- Equity at exit
- $11,183
- IRR
- 1.9%
- Equity multiple
- 1.13×
- Total profit
- $2,809
- Equity at exit
- $6,485
Cash invested: $21,000 (down + closing). Projections, not guarantees.
Landlord ↔ Tenant lean methodology
- Overall (STATE)
- 90 Strongly Landlord-Friendly
- State Louisiana
- 90 Strongly Landlord-Friendly · R+12
- County
- — inherits STATE
- City
- — inherits STATE
ZIP-level market 70394
- Active inventory
- 128
- Price-to-rent
- 5.0×
Monthly cashflow live
- Estimated rent
- $1,244 medium interval (Pro) →
- Mortgage (P&I)
- −$393
- Tax from tax record
- −$43 /mo · $516/yr
- Insurance
- −$31
- Flood insurance flood zone
- −$427 /mo · $5,118/yr
- HOA
- −$0
- Vacancy / Maint / Mgmt
- −$261
- Net cashflow
- $88
Break-even live
UW: 25.0% down · 7.5% · 30yr · 1.5% tax · 5.0% vac · 8.0% maint · 8.0% mgmt
Financing live
Cash to close
- Down payment
- $18,750
- Closing costs
- $2,250
- Reserves months
- —
- Total cash needed
- —
Loan-product check · same deal, 3 products live
Conventional
25% down · 7.5% · 30yr
- Down + closing
- —
- Monthly P&I
- —
- Monthly cashflow
- —
- DSCR
- —
- Eligible?
- —
Personal DTI + credit; lowest rate.
DSCR
20% down · 8.5% · 30yr
- Down + closing
- —
- Monthly P&I
- —
- Monthly cashflow
- —
- DSCR
- —
- Eligible?
- —
No personal income docs; deal must DSCR.
Hard money
10% down · 12.0% · 12mo
- Down + closing
- —
- Monthly P&I
- —
- Monthly cashflow
- —
- DSCR
- —
- Eligible?
- —
Short-term bridge; refi at stabilization.
Listing history 11 events
-
2026-06-19days on market $75,000 Active 10 DOM
-
2026-06-18days on market $75,000 Active 9 DOM
-
2026-06-18remarks 240-char remark
-
2026-06-18price $75,000 Active 8 DOM
-
2026-06-17days on market $89,000 Active 8 DOM
-
2026-06-16days on market $89,000 Active 7 DOM
-
2026-06-15days on market $89,000 Active 6 DOM
-
2026-06-14days on market $89,000 Active 4 DOM
-
2026-06-13days on market $89,000 Active 3 DOM
-
2026-06-10remarks 213-char remark
-
2026-06-10$89,000 Active 1 DOM
ⓘ Source: listings_history table (triggers on properties + properties_extension) + one-shot
backfill from property_details.listing_events for pre-trigger history.
Tax reassessment forecast LA · Resets to sale price
- Current annual tax
- $516 · $43/mo
- Projected year-2 tax
- $516 · $43/mo
- Expected delta
- $0/yr ($0/mo · 0.0%)
ⓘ Screening estimate from a state-policy table — verify with the county assessor before closing.
Climate risk First Street
- Flood 7/10 Severe FEMA zone AE · 60% chance over 30 yrs
- Wildfire 1/10 Low
- Heat 9/10 Extreme 7 d/yr ≥107°F today · 21 d/yr by 30 yrs out
- Wind 9/10 Extreme 99% chance of damaging wind over 30 yrs
- Air quality 1/10 Low 0 unhealthy d/yr today · 0 by 30 yrs out
Nearby sold comps map
Loading sold comps map…
Walkable amenities ~0.75 mi
Loading nearby amenities…
Taxation est. · year 1
- Rental income
- $14,925
- − Mortgage interest
- −$4,201
- − Property taxes
- −$516
- − Insurance
- −$5,494
- − Repairs & maintenance
- −$1,194
- − Management
- −$1,194
- − Depreciation
- −$2,182
- Taxable income
- $144
- Est. tax owed @ 24.0%
- −$35
- After-tax cash flow
- $1,027/yr
For passive investors: Depreciation is non-cash, so a rental often shows a tax loss while cash-flowing — sheltering income. Rental losses are passive: they offset passive income freely, and up to $25,000/yr can offset ordinary (W-2) income if you actively participate and your MAGI is under $100k (phasing out to $0 by $150k); unused losses carry forward. On sale, claimed depreciation is recaptured at up to 25%, and gains may owe capital-gains tax (a 1031 exchange can defer both). Figures are a year-1 estimate at your 24.0% rate — not tax advice; consult a CPA.
Schools (NCES district)
- District
- Lafourche Parish
- NCES district ID
- 2200900
- Math proficiency
- 31% ▼ -43.00%
- Reading proficiency
- 49% ▼ -32.00%
- Median HH income
- $49,703
- Composite
- 34.4/100
- National rank
- #5205
- State rank
- #22 of 98 in LA
Livability — Raceland
- Score
- 58/100
- State rank
- #295
- US rank
- #20904
Category grades
Schools grade is shown separately in the Schools card above.
Census & demographics
- Census place
- Raceland, LA
- Population (ZIP)
- 13,683
Population outlook (Lafourche County) Hauer SSP2
- Today (2025)
- 102,122 people
- By 2030
- 103,361 · +1.2%
- By 2040
- 104,401 · +2.2%
- By 2050
- 102,795 · +0.7%
- By 2075
- 95,599 · -6.4%
- By 2100
- 82,303 · -19.4%
Race, ethnicity, and origin ACS 2023
- Neighborhood character
- Predominantly White (73%)
- Race & ethnicity
- White 73% Black 21% Two or more races 4% Hispanic / Latino 2%
- Common ancestry
- Lithuanian 23% Iranian 1%
- Foreign-born
- 2% · Canada
- Languages at home
- 94% English-only · French/Haitian/Cajun 4% Spanish 1%
Political lean MEDSL · Lafourche
- 2024 margin
- Solid R (+62.1) · D 18.4% · R 80.4% · Other 1.2%
- 2008→2024 swing
- -16.1pp toward R · 2008: -46.0pp · 2024: -62.1pp
- All cycles
- 2024: R+62.1 2020: R+60.3 2016: R+56.5 2012: R+48.5 2008: R+46.0
Not yet ingested
- Civics
- —
Market trends
- HPI YoY
- ▼ -81.48%
- Current HPI
- 136.5498
- Rent YoY
- —
- Metro
- —
- State GDP YoY
- ▲ 3.29%
- F500 in state
- 10
Industry mix (Fortune 500 HQ in LA)
| Industry | F500 HQs | Revenue |
|---|---|---|
| Telecommunications | 2 | $23B |
|
||
| Utilities | 1 | $12B |
|
||
| Wholesale / Distribution | 1 | $5B |
|
||
| Advertising | 1 | $2B |
|
||
Price history
+0.0% since first listed2 events — show timeline
- 2026-06-07 Listed $89,000 AcadianaMLS
- 2026-06-07 Listed $89,000 GBRMLS
Property tax history
+0.1%/yrLatest (2024): $516 · +1.9% YoY. Source: county tax records.
Cash-flow waterfall
monthlySold comps — $/sqft
last 12 mo · ≤1 miLoading sold comps…