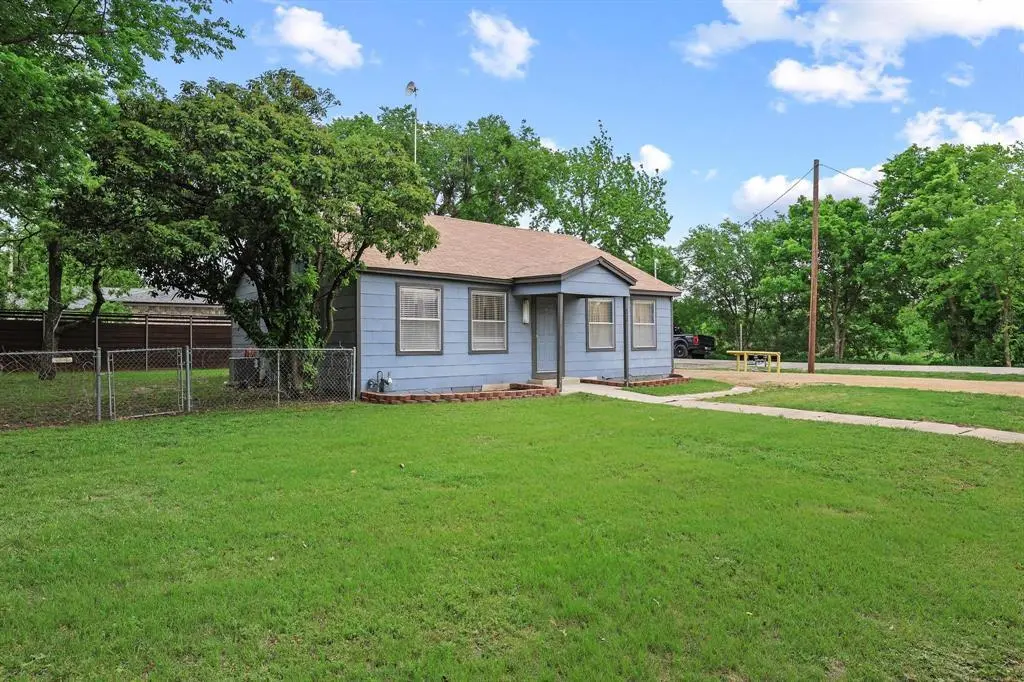
312 E Saunders St · Trenton, TX
Flood risk 1/10 · Minimal
- FEMA flood zone
- X (unshaded)
- Chance of flooding over 30 yrs
- 0.0%
- Est. flood insurance / yr
- $507 – $1,088
Fire risk 7/10 · Major
- Est. fire insurance / yr
- $1,222 – $2,270
Heat risk 6/10 · Moderate
- Hot days now (above 109°F)
- 6 days/yr
- Hot days in 30 yrs
- 19 days/yr
Wind risk 6/10 · Moderate
- Chance of severe wind over 30 yrs
- 27.0%
Air-quality risk 2/10 · Minimal
- Unhealthy air days now
- 1 days/yr
- Unhealthy air days in 30 yrs
- 1 days/yr
Risk factors via First Street. Map © Google.
Why this score? — see what drove the A- grade
The composite is a weighted blend of 9 inputs, each scored 0–100. Each bar is that input's sub-score; the figure is the points it added to the 100-point composite (weight × sub-score).
- Cash flow +30.0/30.0
- ARV discount +15.0/15.0
- DSCR +10.0/10.0
- Appreciation +10.0/10.0
- 1% rule +8.8/10.0
- Schools +3.1/10.0
- Livability +3.0/5.0
- Rent growth +2.5/5.0
- Condition / age +2.5/5.0
$145,000
🖨 Deal sheet (PDF) 📄 Offer letter ✓ Due diligence
Listing remarks
Opportunity meets charm in the heart of Trenton! This charming 3-bedroom, 1-bath home sits on a spacious corner lot on a main road just minutes from downtown, offering convenience, character, and incredible potential. Built in 1945 with 1,310 sq ft of living space, this home is perfect for a first-time buyer, investor, or rental opportunity. Beautiful mature trees create shade and curb appeal, while the carport adds everyday convenience. With its prime location, timeless charm, and endless possibilities, this property is a rare find for anyone looking to invest in a growing area! Positioned in rapidly growing Fannin County, home to Bois d’Arc Lake, Ralph Hall Lake, and Lake Bonham. Th
Key facts
- Convenient access
- Carport
- Corner lot
Tags
Property features AI
Finance
- Other: Restrictions: Building; Possession: Negotiable
- Financial info: Listing terms: Cash or Conventional; Treat as clear loan type; No second mortgage
- HOA & community: No homeowners association
Exterior
- Parking: Covered parking (1 covered space); Carport with 1 space; Private driveway
- Security: Wireless security features; Audio and video surveillance devices present
- Utilities: City water; City sewer; Individual gas meter; Not in a municipal utility district
- Home design: Single family residence; Residential property; One story; Not attached; Built in 1945; No accessibility features listed; Subdivision: Earnhart Add
- Construction: Wood construction; Block foundation; Composition/shingle roof
- Exterior features: Corner lot; Level lot; Large backyard with grass; Outdoor lighting; Partial chain link and wood fencing; Easements for utilities
Interior
- Kitchen: Electric oven; Eat-in kitchen
- Bedrooms: 3 bedrooms (all on the main level); Primary bedroom on the main level
- Flooring: Carpet
- Bathrooms: 1 full bathroom
- Heating & cooling: Central heating (natural gas); Central electric air conditioning
- Interior features: Eat-in kitchen; High-speed internet available; Paneling; One living area; One dining area; Total rooms: 5; One level
Neighborhood map
What this means for you Summary
Snapshot
- This is a 3-bed/1.0-bath single-family listed at $145k.
Deal economics
- At list price, monthly cash flow is $626 ($8k/yr) — positive.
- The deal already cash-flows at list — no discount required.
- Meets the 1% rule at list price ($2k rent vs $145k).
- Recommended offer: $141k (3.0% below list) — sets the bar for market timing.
- Cap rate 11.5% vs local median 2.7% in Trenton — top-decile yield for the area; either an underpriced asset or a hidden risk that comps aren't pricing in. Stress-test before assuming the spread holds.
Location & tenants
- Location reads 59/100 on livability (#1,108 in TX) — a working-class tenant base; expect higher turnover. Strengths: cost of living A+, housing A+, employment B+; Watch: crime D, amenities F, commute F.
- Trenton ISD (rural): math 27% / reading 43% proficiency, ranked #483 of 826 in TX (top 58%) — families likely to look elsewhere, expect single-tenant / working-renter base with shorter leases.
- Zoned schools: Trenton El (math 22% / reading 32%, grade F, #2,791 of 4,322 statewide, top 68%, 299 students, 46% FRL); Trenton Middle (math 27% / reading 42%, grade F, #858 of 1,662 statewide, top 54%, 192 students, 38% FRL); Trenton H S (math 54% / reading 64%, grade C+, #275 of 1,632 statewide, top 19%, 208 students, 34% FRL) — zoned schools at 39% FRL track the district average.
- Market conditions: 166 active listings in the ZIP; 1 comparable units currently listed for rent nearby; 82 units permitted in Fannin County in 2024 (0 in 5+ unit buildings).
Forward outlook
- In year one you build about $16k of equity ($1k loan paydown + $14k appreciation (10.0% local appreciation)).
- Fannin County population projected to shrink 6% by 2050 — rents likely to lag national; underwrite the cash flow, not the appreciation.
- At projected returns (10.0% appreciation + 3.0% rent growth), your $41k cash investment doubles in ~2 years — after that, you're playing with house money.
- By year 3, paydown + projected appreciation supports a ~$39k cash-out refi (75% LTV) — recoverable capital for the next deal without selling this one.
Negotiation context
- It's been on market 57 days — a 3% lower offer ($141k) is reasonable based on typical stale-listing flexibility.
Risks & watch-outs
- Watch-outs: built in 1945 — expect roof / HVAC / electrical / plumbing capex.
- Climate carrying-cost: major wind risk, 27% chance of damaging wind over 30y; major wildfire risk; extreme-heat days projected 6→19/yr by 2055 (HVAC capex compounding) — expect insurance premiums to compound above CPI over the hold.
Questions for the listing agent
- It's been on market 57 days. Have you received any prior offers? Is the seller open to a 3% concession, seller financing, or rate buy-down credit?
- Built in 1945 — when were the roof, HVAC, electrical panel, plumbing, and water heater last replaced?
- Is there a deadline driving the sale (1031 exchange, divorce, estate, relocation)? That informs how much negotiation room exists.
- Crime grade is D in this area — have there been break-ins, vandalism, or insurance claims at this property in the last 3 years? What carrier currently insures it and at what premium?
- What's the average days-on-market for RENTAL listings here right now (not sales)? A rising rental-DOM trend means longer vacancies and softer asking-rent achievability than the comps imply.
- What's the recent tenant-quality profile in this submarket — average credit score on applications, eviction rate, late-payment / NSF rate, and stable-employment percentage? A property-management company in the area should have these aggregated.
- How much new for-sale + rental construction is in the pipeline within 1–3 miles? Heavy new supply typically softens prices + rents 12–24 months out; constrained supply supports both.
Investment metrics
- 1% rule
- 1.38% ✓
- Cap rate
- 11.47%
- Cash-on-cash
- 18.50%
- DSCR
- 1.82
- GRM
- 6.0
CMA / ARV
- ARV (median comp)
- $243,395
- List price
- $145,000
- Delta
- -40.43%
- Verdict
- UNDERPRICED
- Comps
- 20 within 1.0 mi
Show comp detail 7 sales within ~0.75 mi
| Address | Dist | Beds/Ba | Sqft | Sold | Price | $/sf | Match |
|---|---|---|---|---|---|---|---|
| 1214 Anderson Dr | 0.21mi | 3/2.0 | 1,316 (+0%) | 0mo | $271,873 | $207 | 85 |
| 1104 Alexander St | 0.26mi | 3/2.0 | 1,316 (+0%) | 4mo | $273,000 | $207 | 80 |
| 502 S Pearl St | 0.27mi | 3/2.5 | 1,360 (+4%) | 8mo | $115,000 | $85 | 68 |
| 501 E of S Pearl St | 0.36mi | 2/1.0 (-1) | 1,200 (-8%) | 9mo | $262,900 | $219 | 57 |
| 409 N 2nd St | 0.24mi | 2/2.0 (-1) | 1,223 (-7%) | 18mo | $275,000 | $225 | 54 |
| 108 Ann | 0.37mi | 2/1.0 (-1) | 1,214 (-7%) | 16mo | $115,000 | $95 | 52 |
| 805 S Pearl St | 0.55mi | 3/1.0 | 1,176 (-10%) | 8mo | $165,000 | $140 | 50 |
Match score weights: distance 35% · size 25% · config 20% · recency 20%. Top-matched comps best support the ARV.
Projected returns pro-forma
10.0% appreciation · 3.0% rent growth · sell at horizon
- IRR
- 38.0%
- Equity multiple
- 3.93×
- Total profit
- $118,846
- Equity at exit
- $130,627
- IRR
- 32.8%
- Equity multiple
- 8.85×
- Total profit
- $318,625
- Equity at exit
- $281,703
Cash invested: $40,600 (down + closing). Projections, not guarantees.
Landlord ↔ Tenant lean methodology
- Overall (STATE)
- 87 Strongly Landlord-Friendly
- State Texas
- 87 Strongly Landlord-Friendly · R+5
- County
- — inherits STATE
- City
- — inherits STATE
ZIP-level market 75490
- Home prices YoY
- 5.6%
- Active inventory
- 166
- Price-to-rent
- 6.0×
Monthly cashflow live
- Estimated rent
- $2,000 medium interval (Pro) →
- Mortgage (P&I)
- −$760
- Tax from tax record
- −$133 /mo · $1,598/yr
- Insurance
- −$60
- HOA
- −$0
- Vacancy / Maint / Mgmt
- −$420
- Net cashflow
- $626
Break-even live
Sensitivity live
| Price | -10% $708 | -5% $667 | +0% $626 | +5% $585 | +10% $544 |
|---|---|---|---|---|---|
| Rent | -10% $468 | -5% $547 | +0% $626 | +5% $705 | +10% $784 |
| Rate | -1.0pp $699 | -0.5pp $663 | base $626 | +0.5pp $588 | +1.0pp $550 |
UW: 25.0% down · 7.5% · 30yr · 1.5% tax · 5.0% vac · 8.0% maint · 8.0% mgmt
Financing live
Cash to close
- Down payment
- $36,250
- Closing costs
- $4,350
- Reserves months
- —
- Total cash needed
- —
Loan-product check · same deal, 3 products live
Conventional
25% down · 7.5% · 30yr
- Down + closing
- —
- Monthly P&I
- —
- Monthly cashflow
- —
- DSCR
- —
- Eligible?
- —
Personal DTI + credit; lowest rate.
DSCR
20% down · 8.5% · 30yr
- Down + closing
- —
- Monthly P&I
- —
- Monthly cashflow
- —
- DSCR
- —
- Eligible?
- —
No personal income docs; deal must DSCR.
Hard money
10% down · 12.0% · 12mo
- Down + closing
- —
- Monthly P&I
- —
- Monthly cashflow
- —
- DSCR
- —
- Eligible?
- —
Short-term bridge; refi at stabilization.
Rent comps 1 comps
| Address | Beds | Baths | Sqft | Rent | $/sqft | DOM | Units | Dist |
|---|---|---|---|---|---|---|---|---|
| 340 Sunnyside Dr Unit B Trenton, TX | 3.0 | 3.5 | 1673 | $2,000 | $1.20 | 0d | 1 | 0.59mi |
Listing history 15 events
-
2026-06-21days on market $145,000 Active 57 DOM
-
2026-06-18days on market $145,000 Active 54 DOM
-
2026-06-17days on market $145,000 Active 53 DOM
-
2026-06-16days on market $145,000 Active 52 DOM
-
2026-06-15days on market $145,000 Active 51 DOM
-
2026-06-13days on market $145,000 Active 49 DOM
-
2026-06-09days on market $145,000 Active 45 DOM
-
2026-06-08days on market $145,000 Active 44 DOM
-
2026-06-07days on market $145,000 Active 43 DOM
-
2026-06-04days on market $145,000 Active 40 DOM
-
2026-06-03days on market $145,000 Active 39 DOM
-
2026-06-02days on market $145,000 Active 38 DOM
-
2026-06-01days on market $145,000 Active 37 DOM
-
2026-05-31days on market $145,000 Active 36 DOM
-
2026-04-25$145,000 Active 863-char remark
ⓘ Source: listings_history table (triggers on properties + properties_extension) + one-shot
backfill from property_details.listing_events for pre-trigger history.
Tax reassessment forecast TX · Resets to sale price
- Current annual tax
- $1,598 · $133/mo
- Projected year-2 tax
- $2,654 · $221/mo
- Expected delta
- +$1,056/yr (+$88/mo · 66.1%)
ⓘ Screening estimate from a state-policy table — verify with the county assessor before closing.
Climate risk First Street
- Flood 1/10 Low FEMA zone X (unshaded) · 0% chance over 30 yrs
- Wildfire 7/10 Severe
- Heat 6/10 Major 6 d/yr ≥109°F today · 19 d/yr by 30 yrs out
- Wind 6/10 Major 27% chance of damaging wind over 30 yrs
- Air quality 2/10 Low 1 unhealthy d/yr today · 1 by 30 yrs out
Nearby sold comps map
Loading sold comps map…
Walkable amenities ~0.75 mi
Loading nearby amenities…
Taxation est. · year 1
- Rental income
- $24,000
- − Mortgage interest
- −$8,122
- − Property taxes
- −$1,598
- − Insurance
- −$725
- − Repairs & maintenance
- −$1,920
- − Management
- −$1,920
- − Depreciation
- −$4,218
- Taxable income
- $5,497
- Est. tax owed @ 24.0%
- −$1,319
- After-tax cash flow
- $6,193/yr
For passive investors: Depreciation is non-cash, so a rental often shows a tax loss while cash-flowing — sheltering income. Rental losses are passive: they offset passive income freely, and up to $25,000/yr can offset ordinary (W-2) income if you actively participate and your MAGI is under $100k (phasing out to $0 by $150k); unused losses carry forward. On sale, claimed depreciation is recaptured at up to 25%, and gains may owe capital-gains tax (a 1031 exchange can defer both). Figures are a year-1 estimate at your 24.0% rate — not tax advice; consult a CPA.
Schools (NCES district)
- District
- Trenton ISD
- NCES district ID
- 4843140
- Math proficiency
- 27% ▼ -16.00%
- Reading proficiency
- 43% ▼ -11.00%
- Median HH income
- $61,383
- Composite
- 31.38/100
- National rank
- #5993
- State rank
- #483 of 826 in TX
Livability — Trenton
- Score
- 59/100
- State rank
- #1108
- US rank
- #19614
Category grades
Schools grade is shown separately in the Schools card above.
Census & demographics
- Census place
- Trenton, TX
- Population (ZIP)
- 3,024
Population outlook (Fannin County) Hauer SSP2
- Today (2025)
- 33,423 people
- By 2030
- 33,035 · -1.2%
- By 2040
- 32,250 · -3.5%
- By 2050
- 31,462 · -5.9%
- By 2075
- 29,447 · -11.9%
- By 2100
- 25,459 · -23.8%
Race, ethnicity, and origin ACS 2023
- Neighborhood character
- Predominantly White (84%)
- Race & ethnicity
- White 84% Hispanic / Latino 10% Two or more races 8% Black 5%
- Hispanic origin (detail)
- Mexican 8%
- Common ancestry
- Slovak 1%
- Foreign-born
- 3% · Canada, Dominican Republic
- Languages at home
- 95% English-only · Spanish 5%
Political lean MEDSL · Fannin
- 2024 margin
- Solid R (+67.4) · D 15.9% · R 83.3%
- 2008→2024 swing
- -27.8pp toward R · 2008: -39.6pp · 2024: -67.4pp
- All cycles
- 2024: R+67.4 2020: R+63.4 2016: R+61.9 2012: R+52.5 2008: R+39.6
Not yet ingested
- Civics
- —
Market trends
- HPI YoY
- ▲ 16.09%
- Current HPI
- 301.2127
- Rent YoY
- —
- Metro
- —
- State GDP YoY
- ▲ 3.95%
- F500 in state
- 110
Industry mix (Fortune 500 HQ in TX)
| Industry | F500 HQs | Revenue |
|---|---|---|
| Energy | 16 | $1,198B |
|
||
| Technology | 5 | $198B |
|
||
| Engineering / Construction | 4 | $72B |
|
||
| Energy Services | 3 | $60B |
|
||
| Utilities | 3 | $41B |
|
||
| Healthcare | 2 | $330B |
|
||
Price history
1 event — show timeline
- 2026-04-25 Listed $145,000 NTREIS
Property tax history
+6.5%/yrLatest (2025): $1,598 · -7.7% YoY. Source: county tax records.
Cash-flow waterfall
monthlySold comps — $/sqft
last 12 mo · ≤1 miLoading sold comps…