 🌊 Lakefront
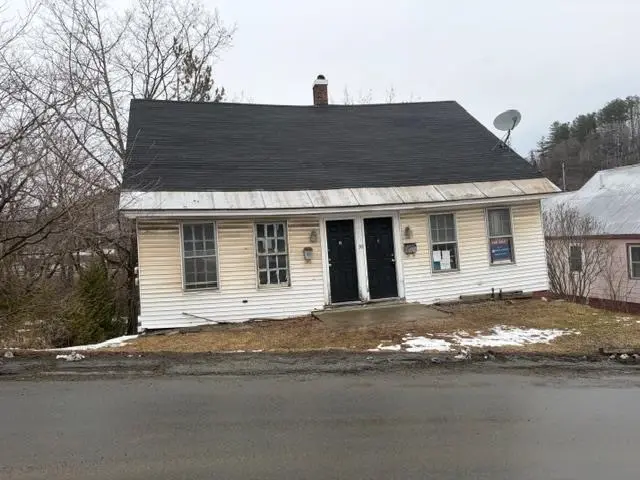
90 Mt Vernon St · St. Johnsbury, VT
Flood risk 10/10 · Severe
- FEMA flood zone
- X
- Chance of flooding over 30 yrs
- 0.99%
- Est. flood insurance / yr
- $473 – $860
Fire risk 1/10 · Minimal
- Est. fire insurance / yr
- $480 – $892
Heat risk 2/10 · Minimal
- Hot days now (above 92°F)
- 7 days/yr
- Hot days in 30 yrs
- 17 days/yr
Wind risk 2/10 · Minimal
- Chance of severe wind over 30 yrs
- 2.0%
Air-quality risk 2/10 · Minimal
- Unhealthy air days now
- 1 days/yr
- Unhealthy air days in 30 yrs
- 1 days/yr
Risk factors via First Street. Map © Google.
Why this score? — see what drove the B grade
The composite is a weighted blend of 9 inputs, each scored 0–100. Each bar is that input's sub-score; the figure is the points it added to the 100-point composite (weight × sub-score).
- Cash flow +30.0/30.0
- 1% rule +10.0/10.0
- DSCR +10.0/10.0
- ARV discount +7.5/15.0
- Schools +5.0/10.0
- Appreciation +3.8/10.0
- Rent growth +2.5/5.0
- Livability +2.5/5.0
- Condition / age +2.5/5.0
$56,000
🖨 Deal sheet 📄 Offer letter ✓ Due diligence
Listing remarks
Total rehab is needed on this 2 unit St Johnsbury property but the price is right and renovation funding is available through The Vermont Housing Improvement Program (VHIP). This funding is to renovate vacant, code-deficient, or underutilized rental housing. It offers 5- or 10-year forgivable loans, typically up to $50,000 per unit, to bring units up to code and increase affordable housing. Property is lender-owned, is being sold “as-is”, and seller makes no representations or warranties.
Key facts
- 0.65 acre lot
- Built 1900
- Listed 79 days
Property features AI
Finance
- Financial info: Property is foreclosed/bank-owned/REO
Exterior
- Parking: Gravel driveway
- Utilities: Public water; Public sewer; Electric service with circuit breaker(s); Phone service; Cable internet available
- Home design: Cape-style building; Existing structure; White exterior color; Two-unit (multi-family) property
- Construction: Wood frame construction; Metal roof; Built in 1900
- Exterior features: Sloping lot; Gravel driveway; Paved public road frontage with approximately 150' of frontage; Parking behind the property
Interior
- Bedrooms: Two units, each with four bedrooms
- Bathrooms: Two full bathrooms total (one full bath per unit)
- Heating & cooling: Oil heating; No central air
- Interior features: Finished living space totaling 2,536; Basement with walkout access; Concrete basement
Neighborhood map
What this means for you Summary
Snapshot
- This is a 8-bed/2.0-bath single-family listed at $56k.
Deal economics
- At list price, monthly cash flow is $790 ($9k/yr) — positive.
- The deal already cash-flows at list — no discount required.
- Meets the 1% rule at list price ($2k rent vs $56k).
- Recommended offer: $53k (6.0% below list) — sets the bar for market timing.
- Cap rate 24.4% vs local median 3.4% in St. Johnsbury — top-decile yield for the area; either an underpriced asset or a hidden risk that comps aren't pricing in. Stress-test before assuming the spread holds.
Location & tenants
- Location reads: area grade B — affects rentability + tenant quality, not the cash-flow math above.
- Zoned schools: St. Johnsbury School (math 19% / reading 37%, grade F, #149 of 192 statewide, top 78%, 702 students, 52% FRL).
- Market conditions: 66 active listings in the ZIP; 112 units permitted in Caledonia County in 2024 (15 in 5+ unit buildings).
Forward outlook
- Local home prices are declining (-2.4%/yr); year-one equity from $387 of loan paydown is wiped out by about $1k of value loss. Plan a longer hold.
- Caledonia County population projected at -20% by 2050 — secular population decline; favor cash flow + early exit over multi-decade hold.
- At projected returns (-2.4% appreciation + 3.0% rent growth), your $16k cash investment doubles in ~2 years — after that, you're playing with house money.
Negotiation context
- It's been on market 80 days — a 6% lower offer ($53k) is reasonable based on typical stale-listing flexibility.
- 2 sale attempts since 20y ago; this cycle's ask has dropped $33k (37%) from the opening price — seller is motivated, your offer sets the floor, not the list.
Risks & watch-outs
- Watch-outs: property tax is 2.5% of price; flood insurance adds $56/mo; built in 1900 — expect roof / HVAC / electrical / plumbing capex.
- Climate carrying-cost: severe flood risk — expect insurance premiums to compound above CPI over the hold.
Questions for the listing agent
- It's been on market 80 days. Have you received any prior offers? Is the seller open to a 6% concession, seller financing, or rate buy-down credit?
- Built in 1900 — when were the roof, HVAC, electrical panel, plumbing, and water heater last replaced?
- Property tax is high relative to price — has the assessment been appealed recently, and will the sale trigger a re-assessment?
- What's the actual annual flood-insurance premium (NFIP or private), and is the property in a SFHA with mandatory coverage?
- Why hasn't it sold? Are there any deal-killer items the seller is aware of (foundation, flood, title, zoning, code violations)?
- Is there a deadline driving the sale (1031 exchange, divorce, estate, relocation)? That informs how much negotiation room exists.
- This sits on a lake — are riparian / water-frontage rights deeded with the parcel? Any dock permits, shoreline easements, or HOA water-use restrictions?
- What's the documented flood / surge / shoreline-erosion history here (FEMA AND non-FEMA — e.g., storm surge, creek backup, septic-field saturation)?
- Any water-quality or seasonal algae-bloom issues that affect tenant satisfaction or short-term-rental demand?
- What's the average days-on-market for RENTAL listings here right now (not sales)? A rising rental-DOM trend means longer vacancies and softer asking-rent achievability than the comps imply.
- What's the recent tenant-quality profile in this submarket — average credit score on applications, eviction rate, late-payment / NSF rate, and stable-employment percentage? A property-management company in the area should have these aggregated.
- How much new for-sale + rental construction is in the pipeline within 1–3 miles? Heavy new supply typically softens prices + rents 12–24 months out; constrained supply supports both.
Investment metrics
- 1% rule
- 2.89% ✓
- Cap rate
- 24.41%
- Cash-on-cash
- 64.72%
- DSCR
- 3.88
- GRM
- 2.9
CMA / ARV
No comps found within radius.
Projected returns pro-forma
-2.41% appreciation · 3.0% rent growth · sell at horizon
- IRR
- 59.9%
- Equity multiple
- 3.73×
- Total profit
- $42,729
- Equity at exit
- $9,830
- IRR
- 64.1%
- Equity multiple
- 7.61×
- Total profit
- $103,579
- Equity at exit
- $7,423
Cash invested: $15,680 (down + closing). Projections, not guarantees.
Landlord ↔ Tenant lean methodology
- Overall (STATE)
- 41 Moderately Tenant-Leaning
- State Vermont
- 41 Moderately Tenant-Leaning · D+15
- County
- — inherits STATE
- City
- — inherits STATE
ZIP-level market 05819
- Home prices YoY
- -0.8%
- Active inventory
- 66
- Price-to-rent
- 2.9×
Monthly cashflow live
- Estimated rent
- $1,620 medium interval (Pro) →
- Mortgage (P&I)
- −$294
- Tax from tax record
- −$117 /mo · $1,404/yr
- Insurance
- −$23
- Flood insurance flood zone
- −$56 /mo · $666/yr
- HOA
- −$0
- Vacancy / Maint / Mgmt
- −$340
- Net cashflow
- $790
Break-even live
UW: 25.0% down · 7.5% · 30yr · 1.5% tax · 5.0% vac · 8.0% maint · 8.0% mgmt
Financing live
Cash to close
- Down payment
- $14,000
- Closing costs
- $1,680
- Reserves months
- —
- Total cash needed
- —
Loan-product check · same deal, 3 products live
Conventional
25% down · 7.5% · 30yr
- Down + closing
- —
- Monthly P&I
- —
- Monthly cashflow
- —
- DSCR
- —
- Eligible?
- —
Personal DTI + credit; lowest rate.
DSCR
20% down · 8.5% · 30yr
- Down + closing
- —
- Monthly P&I
- —
- Monthly cashflow
- —
- DSCR
- —
- Eligible?
- —
No personal income docs; deal must DSCR.
Hard money
10% down · 12.0% · 12mo
- Down + closing
- —
- Monthly P&I
- —
- Monthly cashflow
- —
- DSCR
- —
- Eligible?
- —
Short-term bridge; refi at stabilization.
Listing history 28 events
-
2026-06-18days on market $56,000 Active 80 DOM
-
2026-06-17days on market $56,000 Active 79 DOM
-
2026-06-16days on market $56,000 Active 78 DOM
-
2026-06-15days on market $56,000 Active 77 DOM
-
2026-06-15days on market $56,000 Active 76 DOM
-
2026-06-13days on market $56,000 Active 75 DOM
-
2026-06-12days on market $56,000 Active 74 DOM
-
2026-06-09days on market $56,000 Active 71 DOM
-
2026-06-08days on market $56,000 Active 70 DOM
-
2026-06-08days on market $56,000 Active 69 DOM
-
2026-06-07days on market $56,000 Active 68 DOM
-
2026-06-03days on market $56,000 Active 65 DOM
-
2026-06-02days on market $56,000 Active 64 DOM
-
2026-06-01days on market $56,000 Active 63 DOM
-
2026-05-31days on market $56,000 Active 62 DOM
-
2026-05-09price $56,000
-
2026-03-30$89,200 Active
-
2026-02-06price $93,800
-
2026-01-05price $98,700
-
2025-12-03price $103,800
-
2025-10-31price $109,200
-
2025-10-01price $114,900
-
2025-08-28price $120,900
-
2023-11-23price $74,500
-
2023-08-20price $85,000
-
2006-10-02soldstatus $71,550
-
2006-09-27soldstatus $71,550
-
2006-08-02$72,900
ⓘ Source: listings_history table (triggers on properties + properties_extension) + one-shot
backfill from property_details.listing_events for pre-trigger history.
Tax reassessment forecast VT · Partial reset (capped growth)
- Current annual tax
- $1,404 · $117/mo
- Projected year-2 tax
- $1,404 · $117/mo
- Expected delta
- $0/yr ($0/mo · 0.0%)
ⓘ Screening estimate from a state-policy table — verify with the county assessor before closing.
Climate risk First Street
- Flood 10/10 Extreme FEMA zone X · 99% chance over 30 yrs
- Wildfire 1/10 Low
- Heat 2/10 Low 7 d/yr ≥92°F today · 17 d/yr by 30 yrs out
- Wind 2/10 Low 2% chance of damaging wind over 30 yrs
- Air quality 2/10 Low 1 unhealthy d/yr today · 1 by 30 yrs out
Nearby sold comps map
Loading sold comps map…
Walkable amenities ~0.75 mi
Loading nearby amenities…
Taxation est. · year 1
- Rental income
- $19,439
- − Mortgage interest
- −$3,137
- − Property taxes
- −$1,404
- − Insurance
- −$946
- − Repairs & maintenance
- −$1,555
- − Management
- −$1,555
- − Depreciation
- −$1,629
- Taxable income
- $9,212
- Est. tax owed @ 24.0%
- −$2,211
- After-tax cash flow
- $7,271/yr
For passive investors: Depreciation is non-cash, so a rental often shows a tax loss while cash-flowing — sheltering income. Rental losses are passive: they offset passive income freely, and up to $25,000/yr can offset ordinary (W-2) income if you actively participate and your MAGI is under $100k (phasing out to $0 by $150k); unused losses carry forward. On sale, claimed depreciation is recaptured at up to 25%, and gains may owe capital-gains tax (a 1031 exchange can defer both). Figures are a year-1 estimate at your 24.0% rate — not tax advice; consult a CPA.
Schools (NCES district)
No district data.
Livability — St. Johnsbury
No livability data for this city. (Only ~50 U.S. cities are tracked.)
Census & demographics
- Census place
- St. Johnsbury, VT
- Population (ZIP)
- 9,323
Population outlook (Caledonia County) Hauer SSP2
- Today (2025)
- 29,828 people
- By 2030
- 28,820 · -3.4%
- By 2040
- 26,262 · -12.0%
- By 2050
- 23,780 · -20.3%
- By 2075
- 18,516 · -37.9%
- By 2100
- 13,647 · -54.2%
Race, ethnicity, and origin ACS 2023
- Neighborhood character
- Predominantly White (92%)
- Race & ethnicity
- White 92% Two or more races 5% Hispanic / Latino 2%
- Common ancestry
- Lithuanian 11% Slovak 6% Serbian 3%
- Foreign-born
- 2% · Canada
- Languages at home
- 93% English-only · French/Haitian/Cajun 3% Other Asian/Pacific 2% Spanish 1%
Political lean MEDSL · Caledonia
- 2024 margin
- D (+12.4) · D 54.5% · R 42.0% · Other 3.5%
- 2008→2024 swing
- -10.8pp toward R · 2008: 23.3pp · 2024: 12.4pp
- All cycles
- 2024: D+12.4 2020: D+15.2 2016: D+7.0 2012: D+22.9 2008: D+23.3
Not yet ingested
- Civics
- —
Market trends
- HPI YoY
- ▼ -2.41%
- Current HPI
- 291.8894
- Rent YoY
- —
- Metro
- —
- State GDP YoY
- —
- F500 in state
- 0
Price history
-23.2% since first listed13 events — show timeline
- 2026-05-09 Price Changed $56,000 PrimeMLS
- 2026-03-30 Listed $89,200 PrimeMLS
- 2026-02-06 Price Changed $93,800 PrimeMLS
- 2026-01-05 Price Changed $98,700 PrimeMLS
- 2025-12-03 Price Changed $103,800 PrimeMLS
- 2025-10-31 Price Changed $109,200 PrimeMLS
- 2025-10-01 Price Changed $114,900 PrimeMLS
- 2025-08-28 Price Changed $120,900 PrimeMLS
- 2023-11-23 Price Changed $74,500 PrimeMLS
- 2023-08-20 Price Changed $85,000 PrimeMLS
- 2006-10-02 Sold (Public Records) $71,550 Public Records
- 2006-09-27 Sold (MLS) $71,550 PrimeMLS
- 2006-08-02 Listed $72,900 PrimeMLS
Property tax history
-7.5%/yrLatest (2024): $1,404 · +18.7% YoY. Source: county tax records.
Cash-flow waterfall
monthlySold comps — $/sqft
last 12 mo · ≤1 miLoading sold comps…