800 Parkview Dr #323 · Hallandale Beach, FL
Flood risk 7/10 · Major
- FEMA flood zone
- AE
- Chance of flooding over 30 yrs
- 0.76%
- Est. flood insurance / yr
- $1,737 – $8,500
Fire risk 1/10 · Minimal
- Est. fire insurance / yr
- $947 – $1,759
Heat risk 10/10 · Severe
- Hot days now (above 104°F)
- 7 days/yr
- Hot days in 30 yrs
- 27 days/yr
Wind risk 10/10 · Severe
- Chance of severe wind over 30 yrs
- 99.0%
Air-quality risk 2/10 · Minimal
- Unhealthy air days now
- 1 days/yr
- Unhealthy air days in 30 yrs
- 2 days/yr
Risk factors via First Street. Map © Google.
Why this score? — see what drove the B grade
The composite is a weighted blend of 9 inputs, each scored 0–100. Each bar is that input's sub-score; the figure is the points it added to the 100-point composite (weight × sub-score).
- Cash flow +30.0/30.0
- 1% rule +10.0/10.0
- DSCR +10.0/10.0
- ARV discount +7.5/15.0
- Schools +4.1/10.0
- Livability +4.0/5.0
- Rent growth +2.6/5.0
- Condition / age +2.5/5.0
- Appreciation +0.0/10.0
$210,000
🖨 Deal sheet 📄 Offer letter ✓ Due diligence
Listing remarks MLS
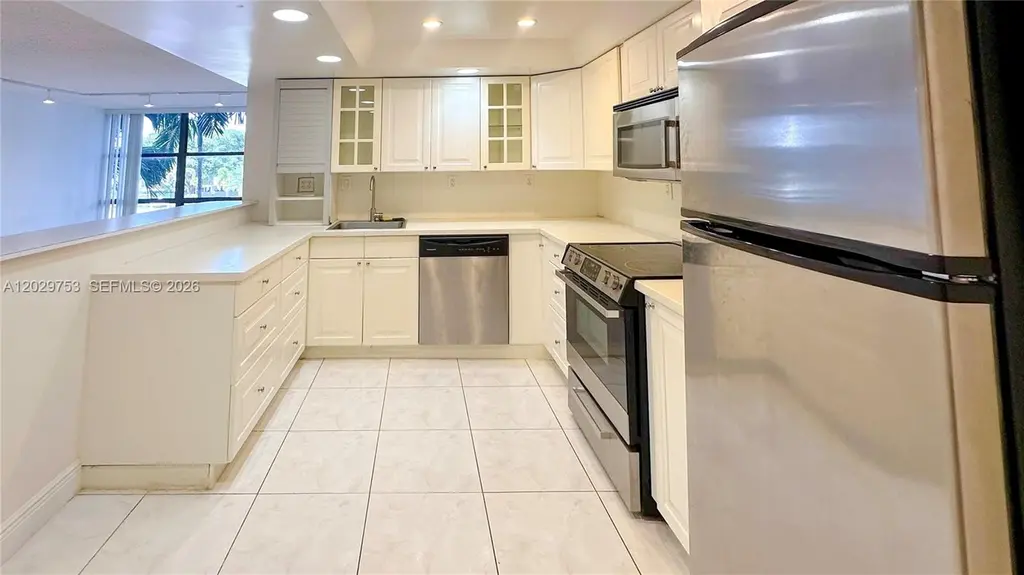
Great opportunity on this 1/1.5 condo. Being sold As-Is. Please allow 2-3 business days for seller response. Realtors, Please see broker remarks for showing instructions and link to submit offers.
Key facts
- Community amenities
- Prime location
- $728 HOA
Tags
Property features AI
Finance
- Financial info: Pets allowed
- HOA & community: Monthly association fee; Association fee covers common areas, cable TV, and water; Association amenities include clubhouse, fitness center, laundry, pool, tennis courts, and elevators
Exterior
- Parking: Attached garage with one covered space
- Security: Doorman; Secured elevator; Secured lobby
- Utilities: Water included in association fee
- Home design: Condo/Apartment (attached property); 10-story building; Entry on level 3; Has a view
- Construction: Block construction; Effective year built
- Exterior features: Deck; Canal-front with Intracoastal access; Association pool
Interior
- Kitchen: Dishwasher; Disposal
- Bedrooms: Bedroom on main level
- Flooring: Tile
- Bathrooms: 1 full bathroom; 1 half bathroom
- Heating & cooling: Central heating (electric); Central air conditioning (electric)
- Interior features: Bedroom on main level; Walk-in closet(s)
- Laundry & utility: Common area laundry
Neighborhood map
What this means for you Summary
Snapshot
- This is a 2-bed/2.0-bath condo listed at $210k.
Deal economics
- At list price, monthly cash flow is $675 ($8k/yr) — positive.
- The deal already cash-flows at list — no discount required.
- Meets the 1% rule at list price ($4k rent vs $210k).
- Cap rate 12.6% vs local median 5.2% in Hallandale Beach — top-decile yield for the area; either an underpriced asset or a hidden risk that comps aren't pricing in. Stress-test before assuming the spread holds.
Location & tenants
- Location reads 81/100 on livability (#86 in FL, #1,400 nationally) — a professional / high-income tenant draw. Strengths: commute A+, health & safety A+, crime B+; Watch: schools C-, employment D-.
- Broward (suburban): math 42% / reading 53% proficiency, ranked #46 of 73 in FL (top 63%) — families likely to look elsewhere, expect single-tenant / working-renter base with shorter leases.
- Market conditions: Rents flat; 1373 active listings in the ZIP; 40 comparable units currently listed for rent nearby; rentals at typical pace (median 14d on market — plan ~3-4 weeks tenant-placement turnaround); 2,111 units permitted in Broward County in 2024 (1,265 in 5+ unit buildings).
- At $4,315/mo this rent would consume 99% of the median local household income ($52k/yr) (locally 3293% of renters already pay >50% of income on rent) — very limited rent-growth headroom before tenants either downsize or default.
Forward outlook
- Local home prices are declining (-3.0%/yr); year-one equity from $1k of loan paydown is wiped out by about $6k of value loss. Plan a longer hold.
- Broward County population projected at +34% by 2050 — long-run rental-demand tailwind backs the buy-and-hold thesis.
Negotiation context
- Only 14 days on market — expect competitive offers; lowballing is unlikely to land.
- 5 sale attempts with the ask held roughly flat each time — persistent listings suggest the price (not the market) is what's stuck; bring a comps-based counter.
- Current owner paid $105k; list at $210k implies a 100% gain — meaningful room to come down on a strong offer.
Risks & watch-outs
- Watch-outs: flood insurance adds $427/mo.
- Climate carrying-cost: in FEMA flood zone AE (mandatory federal flood insurance); severe wind risk, 99% chance of damaging wind over 30y; extreme-heat days projected 7→27/yr by 2055 (HVAC capex compounding) — expect insurance premiums to compound above CPI over the hold.
Questions for the listing agent
- Built in 1976 — when were the roof, HVAC, electrical panel, plumbing, and water heater last replaced?
- What's the actual annual flood-insurance premium (NFIP or private), and is the property in a SFHA with mandatory coverage?
- What does the HOA fee cover, when was the last increase, and are there any pending special assessments or reserve-fund shortfalls?
- Any open or pending special assessments — roof, HVAC, plumbing, elevator, façade? What's the per-unit balance and payoff schedule, and is the seller paying it off at close or rolling it to the buyer?
- Is there a deadline driving the sale (1031 exchange, divorce, estate, relocation)? That informs how much negotiation room exists.
- What's the average days-on-market for RENTAL listings here right now (not sales)? A rising rental-DOM trend means longer vacancies and softer asking-rent achievability than the comps imply.
- What's the recent tenant-quality profile in this submarket — average credit score on applications, eviction rate, late-payment / NSF rate, and stable-employment percentage? A property-management company in the area should have these aggregated.
- How much new apartment / multifamily construction is in the pipeline within 1–3 miles? Heavy new supply (>2% of stock underway) typically softens rents 12–24 months out; light construction supports rent growth.
Investment metrics
- 1% rule
- 2.05% ✓
- Cap rate
- 12.58%
- Cash-on-cash
- 22.47%
- DSCR
- 2.00
- GRM
- 4.1
CMA / ARV
No comps found within radius.
Projected returns pro-forma
-3.0% appreciation · 0.43% rent growth · sell at horizon
- IRR
- -0.5%
- Equity multiple
- 0.98×
- Total profit
- $-1,092
- Equity at exit
- $31,312
- IRR
- 4.4%
- Equity multiple
- 1.26×
- Total profit
- $15,435
- Equity at exit
- $18,157
Cash invested: $58,800 (down + closing). Projections, not guarantees.
Landlord ↔ Tenant lean methodology
- Overall (STATE)
- 87 Strongly Landlord-Friendly
- State Florida
- 87 Strongly Landlord-Friendly · R+3
- County
- — inherits STATE
- City
- — inherits STATE
ZIP-level market 33009
- Rents YoY
- 0.4%
- Active inventory
- 1373
- Price-to-rent
- 4.1×
Monthly cashflow live
- Estimated rent
- $4,315 high interval (Pro) →
- Mortgage (P&I)
- −$1,101
- Tax from tax record
- −$391 /mo · $4,693/yr
- Insurance
- −$88
- Flood insurance flood zone
- −$427 /mo · $5,118/yr
- HOA
- −$728
- Vacancy / Maint / Mgmt
- −$906
- Net cashflow
- $675
Break-even live
UW: 25.0% down · 7.5% · 30yr · 1.5% tax · 5.0% vac · 8.0% maint · 8.0% mgmt
Financing live
Cash to close
- Down payment
- $52,500
- Closing costs
- $6,300
- Reserves months
- —
- Total cash needed
- —
Loan-product check · same deal, 3 products live
Conventional
25% down · 7.5% · 30yr
- Down + closing
- —
- Monthly P&I
- —
- Monthly cashflow
- —
- DSCR
- —
- Eligible?
- —
Personal DTI + credit; lowest rate.
DSCR
20% down · 8.5% · 30yr
- Down + closing
- —
- Monthly P&I
- —
- Monthly cashflow
- —
- DSCR
- —
- Eligible?
- —
No personal income docs; deal must DSCR.
Hard money
10% down · 12.0% · 12mo
- Down + closing
- —
- Monthly P&I
- —
- Monthly cashflow
- —
- DSCR
- —
- Eligible?
- —
Short-term bridge; refi at stabilization.
Rent comps 40 comps
| Address | Beds | Baths | Sqft | Rent | $/sqft | DOM | Units | Dist |
|---|---|---|---|---|---|---|---|---|
| 3001 S Ocean Dr #1211 Hollywood, FL | 2.0 | 2.0 | 1208 | $4,750 | $3.93 | 24d | 1 | 0.22mi |
| 3001 S Ocean Dr #1211 Hollywood, FL | 2.0 | 2.0 | 1208 | $4,750 | $3.93 | 7d | 1 | 0.22mi |
| 2751 S Ocean Dr Unit 1705 Hollywood, FL | 2.0 | 2.0 | 1360 | $5,000 | $3.68 | 7d | 1 | 0.22mi |
| 2751 S Ocean Dr Unit 1706S Hollywood, FL | 2.0 | 2.0 | 1360 | $5,000 | $3.68 | 24d | 1 | 0.22mi |
| 3505 S Ocean Dr Hollywood, FL | 1.0–2.0 | 1.5–2.0 | 1085 | $6,500 | $5.99 | 12d | 17 | 0.23mi |
| 3505 S Ocean Dr Hollywood, FL | 1.0–2.0 | 1.5–2.0 | 1085 | $6,500 | $5.99 | 10d | 18 | 0.23mi |
| 3505 S Ocean Dr Unit 1049820P Hollywood, FL | 1.0 | 1.0 | 785 | $4,827 | $6.15 | 3d | 1 | 0.24mi |
| 2501 S Ocean Dr Hollywood, FL | 1.0–2.0 | 1.0–2.0 | 971 | $5,800 | $5.97 | 14d | 7 | 0.27mi |
| 2501 S Ocean Dr Hollywood, FL | 1.0–2.0 | 1.0–2.0 | 971 | $5,800 | $5.97 | 10d | 6 | 0.27mi |
| 2501 S Ocean Dr Hollywood, FL | 1.0–2.0 | 1.0–2.0 | 971 | $5,400 | $5.56 | 7d | 7 | 0.27mi |
| 2501 S Ocean Dr Hollywood, FL | 1.0–2.0 | 1.0–2.0 | 971 | $5,800 | $5.97 | 19d | 8 | 0.27mi |
| 2500 Parkview Dr #2518 Hallandale Beach, FL | 2.0 | 2.0 | 1280 | $4,000 | $3.12 | 14d | 1 | 0.28mi |
| 2500 Parkview Dr #2518 Hallandale Beach, FL | 2.0 | 2.0 | 1280 | $4,000 | $3.12 | 7d | 1 | 0.28mi |
| 2401 S Ocean Dr #1405 Hollywood, FL | 2.0 | 2.0 | 1250 | $4,250 | $3.40 | 24d | 1 | 0.31mi |
| 2301 S Ocean Dr #2003 Hollywood, FL | 2.0 | 2.0 | 1400 | $5,500 | $3.93 | 24d | 1 | 0.34mi |
| 2301 S Ocean Dr #607 Hollywood, FL | 2.0 | 2.0 | 1240 | $4,000 | $3.23 | 24d | 1 | 0.34mi |
| 2301 S Ocean Dr #2507 Hollywood, FL | 2.0 | 2.0 | 1240 | $4,300 | $3.47 | 24d | 1 | 0.34mi |
| 2101 S Ocean Dr #1201 Hollywood, FL | 2.0 | 2.0 | 1270 | $4,200 | $3.31 | 24d | 1 | 0.36mi |
| 2201 S Ocean Dr #2001 Hollywood, FL | 2.0 | 2.0 | 1400 | $3,800 | $2.71 | 14d | 1 | 0.37mi |
| 2201 S Ocean Dr #1507 Hollywood, FL | 2.0 | 2.0 | 1350 | $5,000 | $3.70 | 24d | 1 | 0.37mi |
| 3725 S Ocean Dr Hollywood, FL | 2.0–3.0 | 2.0 | 1377 | $4,000 | $2.90 | 2d | 7 | 0.39mi |
| 3725 S Ocean Dr Hollywood, FL | 2.0–3.0 | 2.0 | 1454 | $4,000 | $2.75 | 24d | 6 | 0.39mi |
| 3725 S Ocean Dr Hollywood, FL | 2.0–3.0 | 2.0 | 1377 | $4,000 | $2.90 | 14d | 8 | 0.39mi |
| 3725 S Ocean Dr Unit 1339235P Hollywood, FL | 2.0 | 2.0 | 1248 | $5,429 | $4.35 | 3d | 1 | 0.39mi |
| 3800 S Ocean Dr Hollywood, FL | 2.0 | 2.0 | 1302 | $3,750 | $2.88 | 4d | 3 | 0.42mi |
| 3800 S Ocean Dr Hollywood, FL | 2.0 | 2.0 | 1301 | $3,775 | $2.90 | 5d | 2 | 0.42mi |
| 3800 S Ocean Dr #1818 Hollywood, FL | 2.0 | 2.0 | 1270 | $4,200 | $3.31 | 7d | 1 | 0.42mi |
| 3800 S Ocean Dr #1818 Hollywood, FL | 2.0 | 2.0 | 1270 | $3,800 | $2.99 | 4d | 1 | 0.42mi |
| 3801 S Ocean Dr Unit 7O Hollywood, FL | 2.0 | 2.0 | 1173 | $5,000 | $4.26 | 5d | 1 | 0.44mi |
| 3801 S Ocean Dr Unit 7X Hollywood, FL | 2.0 | 1.5 | 1236 | $3,800 | $3.07 | 24d | 1 | 0.44mi |
| 3801 S Ocean Dr Unit 10V Hollywood, FL | 2.0 | 2.0 | 1176 | $4,300 | $3.66 | 24d | 1 | 0.44mi |
| 3801 S Ocean Dr Unit 7O Hollywood, FL | 2.0 | 2.0 | 1173 | $5,000 | $4.26 | 24d | 1 | 0.44mi |
| 3801 S Ocean Dr Unit 4R Hollywood, FL | 1.0 | 1.0 | 812 | $3,850 | $4.74 | 24d | 1 | 0.44mi |
| 3901 S Ocean Dr Unit 1227197P Hollywood, FL | 1.0–2.0 | 1.0–2.0 | 1054 | $3,820 | $3.62 | 1d | 2 | 0.50mi |
| 3901 S Ocean Dr Unit 11M Hollywood, FL | 1.0 | 1.0 | 874 | $4,400 | $5.03 | 3d | 1 | 0.50mi |
| 3901 S Ocean Dr Unit 10Z Hollywood, FL | 1.0 | 1.0 | 874 | $4,000 | $4.58 | 3d | 1 | 0.50mi |
| 3901 S Ocean Dr Unit 8E Hollywood, FL | 2.0 | 2.0 | 1355 | $5,500 | $4.06 | 24d | 1 | 0.50mi |
| 3901 S Ocean Dr Unit 10Z Hollywood, FL | 1.0 | 1.0 | 874 | $4,000 | $4.58 | 24d | 1 | 0.50mi |
| 3901 S Ocean Dr Unit 10M Hollywood, FL | 1.0 | 1.0 | 874 | $5,000 | $5.72 | 24d | 1 | 0.50mi |
| 3901 S Ocean Dr Unit 14E Hollywood, FL | 2.0 | 2.0 | 1355 | $4,500 | $3.32 | 24d | 1 | 0.50mi |
HOA detail condo
- Monthly dues
- $728 · $8,736/yr
- Assessments
- None detected in remarks — confirm with the listing agent.
Listing history 9 events
-
2026-06-18days on market $210,000 Active 14 DOM
-
2026-06-17days on market $210,000 Active 13 DOM
-
2026-06-16days on market $210,000 Active 12 DOM
-
2026-06-15days on market $210,000 Active 11 DOM
-
2026-06-13days on market $210,000 Active 9 DOM
-
2026-06-09days on market $210,000 Active 5 DOM
-
2026-06-08days on market $210,000 Active 4 DOM
-
2026-06-07remarks 473-char remark
-
2026-06-07$210,000 Active 3 DOM
ⓘ Source: listings_history table (triggers on properties + properties_extension) + one-shot
backfill from property_details.listing_events for pre-trigger history.
Tax reassessment forecast FL · Resets to sale price
- Current annual tax
- $4,693 · $391/mo
- Projected year-2 tax
- $4,693 · $391/mo
- Expected delta
- $0/yr ($0/mo · 0.0%)
ⓘ Screening estimate from a state-policy table — verify with the county assessor before closing.
Climate risk First Street
- Flood 7/10 Severe FEMA zone AE · 76% chance over 30 yrs
- Wildfire 1/10 Low
- Heat 10/10 Extreme 7 d/yr ≥104°F today · 27 d/yr by 30 yrs out
- Wind 10/10 Extreme 99% chance of damaging wind over 30 yrs
- Air quality 2/10 Low 1 unhealthy d/yr today · 2 by 30 yrs out
Nearby sold comps map
Loading sold comps map…
Walkable amenities ~0.75 mi
Loading nearby amenities…
Taxation est. · year 1
- Rental income
- $51,781
- − Mortgage interest
- −$11,763
- − Property taxes
- −$4,693
- − Insurance
- −$6,169
- − Repairs & maintenance
- −$4,142
- − Management
- −$4,142
- − HOA
- −$8,736
- − Depreciation
- −$6,109
- Taxable income
- $6,026
- Est. tax owed @ 24.0%
- −$1,446
- After-tax cash flow
- $6,648/yr
For passive investors: Depreciation is non-cash, so a rental often shows a tax loss while cash-flowing — sheltering income. Rental losses are passive: they offset passive income freely, and up to $25,000/yr can offset ordinary (W-2) income if you actively participate and your MAGI is under $100k (phasing out to $0 by $150k); unused losses carry forward. On sale, claimed depreciation is recaptured at up to 25%, and gains may owe capital-gains tax (a 1031 exchange can defer both). Figures are a year-1 estimate at your 24.0% rate — not tax advice; consult a CPA.
Schools (NCES district)
- District
- Broward
- NCES district ID
- 1200180
- Math proficiency
- 42% ▼ -18.00%
- Reading proficiency
- 53% ▼ -5.00%
- Median HH income
- $52,139
- Composite
- 40.88/100
- National rank
- #3621
- State rank
- #46 of 73 in FL
Livability — Hallandale Beach
- Score
- 81/100
- State rank
- #86
- US rank
- #1400
Category grades
Schools grade is shown separately in the Schools card above.
Census & demographics
- Census place
- Hallandale Beach, FL
- County
- Broward County · 1,963,430 people
- City population
- 44,021
- Metro
- Miami-Fort Lauderdale-Pompano Beach, FL
- Population (ZIP)
- 44,502
- Household income
- $52,079
- Rent vs Own
- Severe rent burden
- 3293.0
Population outlook (Broward County) Hauer SSP2
- Today (2025)
- 2,207,033 people
- By 2030
- 2,360,704 · +7.0%
- By 2040
- 2,661,208 · +20.6%
- By 2050
- 2,946,698 · +33.5%
- By 2075
- 3,602,273 · +63.2%
- By 2100
- 3,970,984 · +79.9%
Race, ethnicity, and origin ACS 2023
- Neighborhood character
- Diverse neighborhood (Simpson 0.67)
- Race & ethnicity
- Hispanic / Latino 39% White 39% Two or more races 24% Black 17% Asian 1%
- Hispanic origin (detail)
- Mexican 2% Puerto Rican 3% Cuban 9% Dominican 3% Salvadoran 2%
- Common ancestry
- Scotch-Irish 5% Hispanic 5% Subsaharan African 3%
- Foreign-born
- 51% · Canada, Jamaica, Dominican Republic
- Languages at home
- 38% English-only · Spanish 36% Russian/Polish/Slavic 12% French/Haitian/Cajun 7%
Political lean MEDSL · Broward
- 2024 margin
- D (+17.0) · D 58.0% · R 41.0%
- 2008→2024 swing
- -17.8pp toward R · 2008: 34.7pp · 2024: 17.0pp
- All cycles
- 2024: D+17.0 2020: D+29.8 2016: D+35.0 2012: D+34.9 2008: D+34.7
Not yet ingested
- Civics
- —
Market trends
- HPI YoY
- ▼ -299.13%
- Current HPI
- 329.9081
- Rent YoY
- ▲ 0.43%
- Metro
- Miami-Fort Lauderdale-Pompano Beach, FL
- State GDP YoY
- ▲ 3.28%
- F500 in state
- 36
Industry mix (Fortune 500 HQ in FL)
| Industry | F500 HQs | Revenue |
|---|---|---|
| Industrial Technology | 2 | $29B |
|
||
| Insurance | 2 | $17B |
|
||
| Retail | 1 | $60B |
|
||
| Technology Distribution | 1 | $58B |
|
||
| Homebuilding | 1 | $35B |
|
||
| Technology Manufacturing | 1 | $35B |
|
||
Price history
+406.0% since first listed14 events — show timeline
- 2026-06-04 Listed $210,000 MARMLS
- 2026-03-12 Rental Removed $1,860 MARMLS
- 2026-03-10 Price Changed $1,860 MARMLS
- 2026-02-14 Listed for Rent $2,000 MARMLS
- 2026-02-09 Rental Removed $2,000 MARMLS
- 2026-01-22 Listed for Rent $2,000 MARMLS
- 2025-12-30 Rental Removed $2,000 MARMLS
- 2025-11-11 Listed for Rent $2,100 MARMLS
- 2025-11-01 Rental Removed $2,100 MARMLS
- 2025-10-08 Listed for Rent $2,100 MARMLS
- 2013-07-02 Sold (MLS) $105,000 MARMLS
- 2013-05-30 Pending — MARMLS
- 2000-10-16 Sold (Public Records) $64,000 Public Records
- 1977-12-01 Sold (Public Records) $41,500 Public Records
Property tax history
+6.9%/yrLatest (2025): $4,693 · +3.4% YoY. Source: county tax records.
Cash-flow waterfall
monthlySold comps — $/sqft
last 12 mo · ≤1 miLoading sold comps…