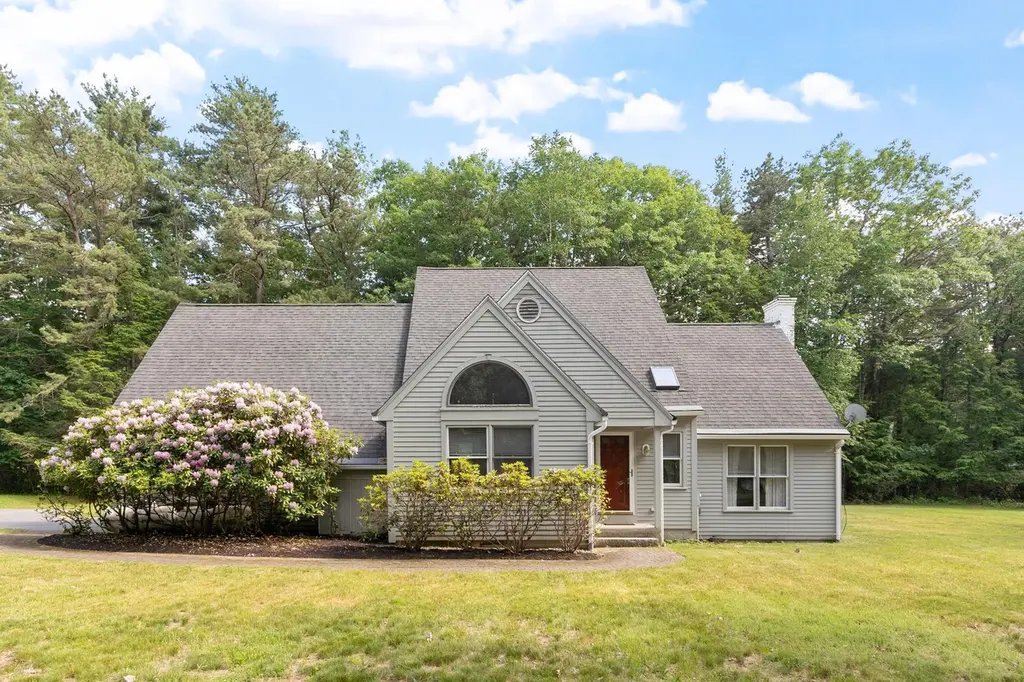
11 Rebecca Rd · Ogunquit, ME
Flood risk No data
- FEMA flood zone
- —
- Chance of flooding over 30 yrs
- %
- Est. flood insurance / yr
- —
Fire risk No data
- Est. fire insurance / yr
- —
Heat risk No data
- Hot days now (above °F)
- days/yr
- Hot days in 30 yrs
- days/yr
Wind risk No data
- Chance of severe wind over 30 yrs
- %
Air-quality risk No data
- Unhealthy air days now
- days/yr
- Unhealthy air days in 30 yrs
- days/yr
Risk factors via First Street. Map © Google.
Why this score? — see what drove the C grade
The composite is a weighted blend of 9 inputs, each scored 0–100. Each bar is that input's sub-score; the figure is the points it added to the 100-point composite (weight × sub-score).
- Cash flow +22.4/30.0
- Appreciation +7.8/10.0
- Schools +7.6/10.0
- DSCR +7.2/10.0
- 1% rule +5.9/10.0
- Rent growth +2.5/5.0
- Livability +2.5/5.0
- Condition / age +2.5/5.0
- ARV discount +0.0/15.0
$875,000
🖨 Deal sheet 📄 Offer letter ✓ Due diligence
Listing remarks
Imagine starting your day with coffee on the screened porch as the breeze drifts through the trees, spending the afternoon at Footbridge Beach, and ending the evening gathered around the stone fireplace after a day by the ocean. Set on a generous 1.5-acre lot in one of Ogunquit's most desirable residential neighborhoods, this inviting home offers the perfect balance of privacy, comfort, and Maine charm. Natural light, vaulted ceilings, and warm bamboo flooring create an inviting atmosphere in the living room, which flows seamlessly into the dining area and kitchen. A first-floor bedroom, full bath, and laundry add flexibility and convenience for guests or one-level living. Upstairs, the pri
Key facts
- 1.5 acre lot
- Screened porch
- Stone fireplace
Tags
Neighborhood map
What this means for you Summary
Snapshot
- This is a 3-bed/3.0-bath single-family listed at $875k.
Deal economics
- At list price, monthly cash flow is $1k ($17k/yr) — positive.
- The deal already cash-flows at list — no discount required.
- Meets the 1% rule at list price ($10k rent vs $875k).
Location & tenants
- Location reads: area grade C — affects rentability + tenant quality, not the cash-flow math above.
- Wells-Ogunquit CSD (rural): math 87% / reading 90% proficiency, ranked #32 of 112 in ME (top 29%) — strong family-tenant draw, lease renewals of 3-5y typical; only 17% free/reduced lunch — higher-income household profile.
- Market conditions: 42 active listings in the ZIP; 1 comparable units currently listed for rent nearby; 1,386 units permitted in York County in 2024 (338 in 5+ unit buildings).
Forward outlook
- In year one you build about $55k of equity ($6k loan paydown + $49k appreciation (5.6% local appreciation)).
- At projected returns (5.6% appreciation + 3.0% rent growth), your $245k cash investment doubles in ~4 years — after that, you're playing with house money.
- By year 2, paydown + projected appreciation supports a ~$89k cash-out refi (75% LTV) — recoverable capital for the next deal without selling this one.
Negotiation context
- Only 1 days on market — expect competitive offers; lowballing is unlikely to land.
Questions for the listing agent
- Is there a deadline driving the sale (1031 exchange, divorce, estate, relocation)? That informs how much negotiation room exists.
- What's the average days-on-market for RENTAL listings here right now (not sales)? A rising rental-DOM trend means longer vacancies and softer asking-rent achievability than the comps imply.
- What's the recent tenant-quality profile in this submarket — average credit score on applications, eviction rate, late-payment / NSF rate, and stable-employment percentage? A property-management company in the area should have these aggregated.
- How much new for-sale + rental construction is in the pipeline within 1–3 miles? Heavy new supply typically softens prices + rents 12–24 months out; constrained supply supports both.
Investment metrics
- 1% rule
- 1.09% ✓
- Cap rate
- 8.29%
- Cash-on-cash
- 7.14%
- DSCR
- 1.32
- GRM
- 7.7
CMA / ARV
- ARV (on-the-fly)
- $677,768
- Comps found
- 6
Show comp detail 6 sales within ~0.75 mi
| Address | Dist | Beds/Ba | Sqft | Sold | Price | $/sf | Match |
|---|---|---|---|---|---|---|---|
| 20 Ocean Heights Ln | 0.24mi | 3/1.0 | 1,720 (-8%) | 8mo | $625,000 | $363 | 62 |
| 21 Beach Plum Ln | 0.63mi | 3/2.5 | 1,851 (-1%) | 8mo | $2,000,000 | $1,080 | 61 |
| 62 Moody Hts | 0.72mi | 4/2.0 (+1) | 1,882 (+1%) | 6mo | $530,000 | $282 | 51 |
| 41 Kings Ct | 0.47mi | 3/2.0 | 1,690 (-9%) | 11mo | $899,900 | $532 | 49 |
| 32 Queens Way | 0.44mi | 4/2.0 (+1) | 2,128 (+14%) | 5mo | $500,000 | $235 | 42 |
| 92 Moody Hts | 0.70mi | 4/3.0 (+1) | 2,060 (+11%) | 19mo | $750,000 | $364 | 28 |
Match score weights: distance 35% · size 25% · config 20% · recency 20%. Top-matched comps best support the ARV.
Projected returns pro-forma
5.63% appreciation · 3.0% rent growth · sell at horizon
- IRR
- 20.4%
- Equity multiple
- 2.33×
- Total profit
- $326,711
- Equity at exit
- $529,922
- IRR
- 19.8%
- Equity multiple
- 4.65×
- Total profit
- $893,996
- Equity at exit
- $944,070
Cash invested: $245,000 (down + closing). Projections, not guarantees.
Landlord ↔ Tenant lean methodology
- Overall (STATE)
- 41 Moderately Tenant-Leaning
- State Maine
- 41 Moderately Tenant-Leaning · D+2
- County
- — inherits STATE
- City
- — inherits STATE
ZIP-level market 03907
- Home prices YoY
- 1.2%
- Active inventory
- 42
- Price-to-rent
- 7.7×
Monthly cashflow live
- Estimated rent
- $9,500 medium interval (Pro) →
- Mortgage (P&I)
- −$4,589
- Tax est. 1.5%
- −$1,094 /mo · $13,125/yr
- Insurance
- −$365
- HOA
- −$0
- Vacancy / Maint / Mgmt
- −$1,995
- Net cashflow
- $1,458
Break-even live
UW: 25.0% down · 7.5% · 30yr · 1.5% tax · 5.0% vac · 8.0% maint · 8.0% mgmt
Financing live
Cash to close
- Down payment
- $218,750
- Closing costs
- $26,250
- Reserves months
- —
- Total cash needed
- —
Loan-product check · same deal, 3 products live
Conventional
25% down · 7.5% · 30yr
- Down + closing
- —
- Monthly P&I
- —
- Monthly cashflow
- —
- DSCR
- —
- Eligible?
- —
Personal DTI + credit; lowest rate.
DSCR
20% down · 8.5% · 30yr
- Down + closing
- —
- Monthly P&I
- —
- Monthly cashflow
- —
- DSCR
- —
- Eligible?
- —
No personal income docs; deal must DSCR.
Hard money
10% down · 12.0% · 12mo
- Down + closing
- —
- Monthly P&I
- —
- Monthly cashflow
- —
- DSCR
- —
- Eligible?
- —
Short-term bridge; refi at stabilization.
Rent comps 1 comps
| Address | Beds | Baths | Sqft | Rent | $/sqft | DOM | Units | Dist |
|---|---|---|---|---|---|---|---|---|
| 8 Birch Cir Ogunquit, ME | 4.0 | 2.0 | 2346 | $9,500 | $4.05 | 43d | 1 | 0.89mi |
Listing history 2 events
-
2026-06-18remarks 699-char remark
-
2026-06-18$875,000 Active 1 DOM
ⓘ Source: listings_history table (triggers on properties + properties_extension) + one-shot
backfill from property_details.listing_events for pre-trigger history.
Nearby sold comps map
Loading sold comps map…
Walkable amenities ~0.75 mi
Loading nearby amenities…
Taxation est. · year 1
- Rental income
- $114,000
- − Mortgage interest
- −$49,014
- − Property taxes
- −$13,125
- − Insurance
- −$4,375
- − Repairs & maintenance
- −$9,120
- − Management
- −$9,120
- − Depreciation
- −$25,455
- Taxable income
- $3,792
- Est. tax owed @ 24.0%
- −$910
- After-tax cash flow
- $16,587/yr
For passive investors: Depreciation is non-cash, so a rental often shows a tax loss while cash-flowing — sheltering income. Rental losses are passive: they offset passive income freely, and up to $25,000/yr can offset ordinary (W-2) income if you actively participate and your MAGI is under $100k (phasing out to $0 by $150k); unused losses carry forward. On sale, claimed depreciation is recaptured at up to 25%, and gains may owe capital-gains tax (a 1031 exchange can defer both). Figures are a year-1 estimate at your 24.0% rate — not tax advice; consult a CPA.
Schools (NCES district)
- District
- Wells-Ogunquit CSD
- NCES district ID
- 2313490
- Math proficiency
- 87% ▲ 42.00%
- Reading proficiency
- 90% ▲ 26.00%
- Median HH income
- $61,341
- Composite
- 75.79/100
- National rank
- #125
- State rank
- #32 of 112 in ME
Livability — Ogunquit
No livability data for this city. (Only ~50 U.S. cities are tracked.)
Census & demographics
- Population (ZIP)
- 1,264
Population outlook (York County) Hauer SSP2
- Today (2025)
- 209,961 people
- By 2030
- 212,816 · +1.4%
- By 2040
- 214,360 · +2.1%
- By 2050
- 210,350 · +0.2%
- By 2075
- 201,686 · -3.9%
- By 2100
- 183,392 · -12.7%
Race, ethnicity, and origin ACS 2023
- Neighborhood character
- Predominantly White (96%)
- Race & ethnicity
- White 96% Two or more races 3% Hispanic / Latino 1%
- Common ancestry
- Lithuanian 13% German 5% Slovak 4%
- Foreign-born
- 3% · Canada
- Languages at home
- 94% English-only · Other Indo-European 2% Other Asian/Pacific 2%
Political lean MEDSL · York
- 2024 margin
- D (+10.5) · D 54.3% · R 43.8% · Other 1.9%
- 2008→2024 swing
- -10.1pp toward R · 2008: 20.5pp · 2024: 10.5pp
- All cycles
- 2024: D+10.5 2020: D+12.6 2016: D+4.8 2012: D+16.4 2008: D+20.5
Not yet ingested
- Civics
- —
Market trends
- HPI YoY
- ▲ 5.63%
- Current HPI
- 471.7521
- Rent YoY
- —
- Metro
- —
- State GDP YoY
- —
- F500 in state
- 0
Cash-flow waterfall
monthlySold comps — $/sqft
last 12 mo · ≤1 miLoading sold comps…