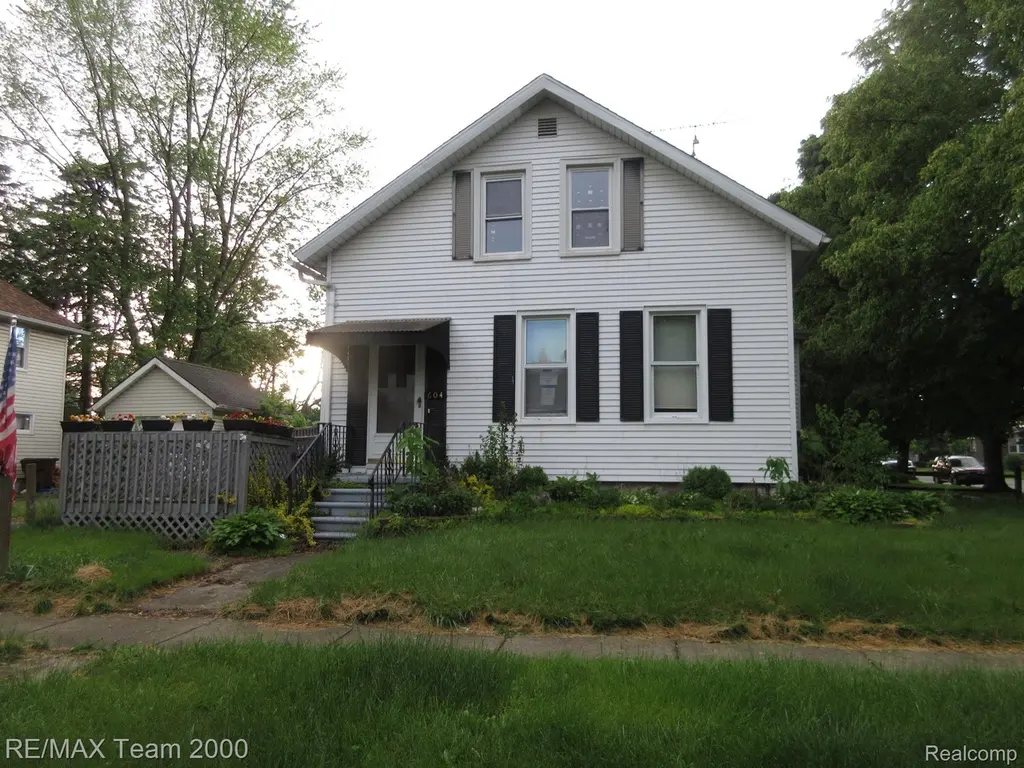
604 Smith St · Monroe, MI
Flood risk 1/10 · Minimal
- FEMA flood zone
- X (unshaded)
- Chance of flooding over 30 yrs
- 0.0%
- Est. flood insurance / yr
- $473 – $860
Fire risk 1/10 · Minimal
- Est. fire insurance / yr
- $784 – $1,456
Heat risk 3/10 · Minor
- Hot days now (above 101°F)
- 7 days/yr
- Hot days in 30 yrs
- 15 days/yr
Wind risk 2/10 · Minimal
- Chance of severe wind over 30 yrs
- —
Air-quality risk 4/10 · Minor
- Unhealthy air days now
- 3 days/yr
- Unhealthy air days in 30 yrs
- 6 days/yr
Risk factors via First Street. Map © Google.
Why this score? — see what drove the B grade
The composite is a weighted blend of 9 inputs, each scored 0–100. Each bar is that input's sub-score; the figure is the points it added to the 100-point composite (weight × sub-score).
- Cash flow +29.4/30.0
- ARV discount +15.0/15.0
- DSCR +10.0/10.0
- 1% rule +8.1/10.0
- Livability +4.2/5.0
- Schools +3.0/10.0
- Rent growth +2.5/5.0
- Condition / age +2.5/5.0
- Appreciation +0.0/10.0
$109,900
🖨 Deal sheet 📄 Offer letter ✓ Due diligence
Listing remarks MLS
Welcome home to this charming and timeless front-gabled traditional home, offering a perfect blend of classic character and everyday functionality. The exterior features crisp siding complemented by sharp accent shutters and a welcoming, covered front entryway. Inside, the smart layout maximizes space, highlighted by bright, double-hung windows that flood the rooms with natural light. 3 (with room for a potential 4th) bedrooms - spacious throughout. Sold as is. Buyer and agent to verify all information. Images in this listing have been virtually staged.
Key facts
- 4,356 sq ft lot
- Built 1893
- Listed 6 days
Tags
Property features AI
Exterior
- Parking: No garage
- Utilities: Public water; Public sewer
- Home design: Single-family residence; One-and-a-half story; Ground-level entry with steps
- Construction: Block construction; Block foundation
- Exterior features: Paved road access; Lot approximately 0.1 acre (75 x 57)
Interior
- Bathrooms: 1 full bathroom
- Heating & cooling: Central air conditioning; Forced air heating; Natural gas heating
- Interior features: Unfinished basement; Total of 4 rooms
Neighborhood map
What this means for you Summary
Snapshot
- This is a 3-bed/1.0-bath single-family listed at $110k.
Deal economics
- At list price, monthly cash flow is $389 ($5k/yr) — positive.
- The deal already cash-flows at list — no discount required.
- Meets the 1% rule at list price ($1k rent vs $110k).
- Cap rate 10.5% vs local median 4.0% in Monroe — top-decile yield for the area; either an underpriced asset or a hidden risk that comps aren't pricing in. Stress-test before assuming the spread holds.
Location & tenants
- Location reads 83/100 on livability (#51 in MI, #1,034 nationally) — a professional / high-income tenant draw. Strengths: commute A+, cost of living A+, housing A+; Watch: employment C-, crime D+, amenities D+.
- Monroe Public Schools (suburban): math 24% / reading 47% proficiency, ranked #278 of 540 in MI (top 52%) — families likely to look elsewhere, expect single-tenant / working-renter base with shorter leases.
- Market conditions: 142 active listings in the ZIP; 7 comparable units currently listed for rent nearby; rentals lingering (median 44d on market — plan ~5-8 weeks vacancy on turnover, expect pricing pressure); 71% of comp listings sitting > 30 days — soft ceiling on asking rent; 264 units permitted in Monroe County in 2024 (40 in 5+ unit buildings).
Forward outlook
- Local home prices are declining (-3.0%/yr); year-one equity from $760 of loan paydown is wiped out by about $3k of value loss. Plan a longer hold.
- Monroe County population projected at -20% by 2050 — secular population decline; favor cash flow + early exit over multi-decade hold.
- At projected returns (-3.0% appreciation + 3.0% rent growth), your $31k cash investment doubles in ~8 years — after that, you're playing with house money.
Negotiation context
- Only 6 days on market — expect competitive offers; lowballing is unlikely to land.
- 2 sale attempts with the ask held roughly flat each time — persistent listings suggest the price (not the market) is what's stuck; bring a comps-based counter.
Risks & watch-outs
- Watch-outs: built in 1893 — expect roof / HVAC / electrical / plumbing capex.
Questions for the listing agent
- Built in 1893 — when were the roof, HVAC, electrical panel, plumbing, and water heater last replaced?
- Is there a deadline driving the sale (1031 exchange, divorce, estate, relocation)? That informs how much negotiation room exists.
- Schools are D-rated, which usually means shorter tenancies and higher turnover. Who's the typical renter profile here, and what's been the actual vacancy rate?
- Crime grade is D in this area — have there been break-ins, vandalism, or insurance claims at this property in the last 3 years? What carrier currently insures it and at what premium?
- What's the average days-on-market for RENTAL listings here right now (not sales)? A rising rental-DOM trend means longer vacancies and softer asking-rent achievability than the comps imply.
- What's the recent tenant-quality profile in this submarket — average credit score on applications, eviction rate, late-payment / NSF rate, and stable-employment percentage? A property-management company in the area should have these aggregated.
- How much new for-sale + rental construction is in the pipeline within 1–3 miles? Heavy new supply typically softens prices + rents 12–24 months out; constrained supply supports both.
Investment metrics
- 1% rule
- 1.31% ✓
- Cap rate
- 10.54%
- Cash-on-cash
- 15.16%
- DSCR
- 1.67
- GRM
- 6.4
CMA / ARV
- ARV (on-the-fly)
- $151,164
- Comps found
- 12
Show comp detail 12 sales within ~0.75 mi
| Address | Dist | Beds/Ba | Sqft | Sold | Price | $/sf | Match |
|---|---|---|---|---|---|---|---|
| 609 W 5th St | 0.20mi | 3/2.0 | 1,340 (+1%) | 6mo | $220,000 | $164 | 80 |
| 825 Smith St | 0.21mi | 3/2.0 | 1,389 (+5%) | 5mo | $180,000 | $130 | 74 |
| 409 Adams St | 0.16mi | 3/1.0 | 1,200 (-10%) | 4mo | $172,500 | $144 | 73 |
| 727 W 4th St | 0.31mi | 3/1.0 | 1,269 (-4%) | 6mo | $135,000 | $106 | 73 |
| 812 Bacon St | 0.25mi | 3/2.0 | 1,216 (-8%) | 1mo | $95,000 | $78 | 70 |
| 711 W 5th St | 0.26mi | 3/1.0 | 1,200 (-10%) | 4mo | $117,000 | $98 | 69 |
| 508 W Third St | 0.27mi | 3/1.5 | 1,190 (-10%) | 6mo | $95,000 | $80 | 64 |
| 725 W 6th St | 0.28mi | 3/2.0 | 1,144 (-14%) | 2mo | $130,000 | $114 | 58 |
| 527 E Fifth St | 0.65mi | 3/2.5 | 1,287 (-3%) | 2mo | $195,900 | $152 | 57 |
| 729 Union St | 0.30mi | 4/1.0 (+1) | 1,506 (+14%) | 4mo | $153,000 | $102 | 55 |
| 405 E 5th St | 0.55mi | 3/1.5 | 1,515 (+14%) | 4mo | $125,000 | $83 | 46 |
| 312 Navarre St | 0.68mi | 4/2.0 (+1) | 1,456 (+10%) | 4mo | $189,900 | $130 | 40 |
Match score weights: distance 35% · size 25% · config 20% · recency 20%. Top-matched comps best support the ARV.
Projected returns pro-forma
-3.0% appreciation · 3.0% rent growth · sell at horizon
- IRR
- 5.8%
- Equity multiple
- 1.23×
- Total profit
- $6,969
- Equity at exit
- $16,386
- IRR
- 15.2%
- Equity multiple
- 2.24×
- Total profit
- $38,015
- Equity at exit
- $9,502
Cash invested: $30,772 (down + closing). Projections, not guarantees.
Landlord ↔ Tenant lean methodology
- Overall (STATE)
- 62 Landlord-Friendly
- State Michigan
- 62 Landlord-Friendly · EVEN
- County
- — inherits STATE
- City
- — inherits STATE
ZIP-level market 48161
- Active inventory
- 142
- Price-to-rent
- 6.4×
Monthly cashflow live
- Estimated rent
- $1,439 high interval (Pro) →
- Mortgage (P&I)
- −$576
- Tax from tax record
- −$126 /mo · $1,512/yr
- Insurance
- −$46
- HOA
- −$0
- Vacancy / Maint / Mgmt
- −$302
- Net cashflow
- $389
Break-even live
UW: 25.0% down · 7.5% · 30yr · 1.5% tax · 5.0% vac · 8.0% maint · 8.0% mgmt
Financing live
Cash to close
- Down payment
- $27,475
- Closing costs
- $3,297
- Reserves months
- —
- Total cash needed
- —
Loan-product check · same deal, 3 products live
Conventional
25% down · 7.5% · 30yr
- Down + closing
- —
- Monthly P&I
- —
- Monthly cashflow
- —
- DSCR
- —
- Eligible?
- —
Personal DTI + credit; lowest rate.
DSCR
20% down · 8.5% · 30yr
- Down + closing
- —
- Monthly P&I
- —
- Monthly cashflow
- —
- DSCR
- —
- Eligible?
- —
No personal income docs; deal must DSCR.
Hard money
10% down · 12.0% · 12mo
- Down + closing
- —
- Monthly P&I
- —
- Monthly cashflow
- —
- DSCR
- —
- Eligible?
- —
Short-term bridge; refi at stabilization.
Rent comps 7 comps
| Address | Beds | Baths | Sqft | Rent | $/sqft | DOM | Units | Dist |
|---|---|---|---|---|---|---|---|---|
| 733 Smith St Monroe, MI | 3.0 | 1.5 | 1000 | $1,500 | $1.50 | 43d | 1 | 0.12mi |
| 505 Harrison St Monroe, MI | 3.0 | 2.0 | 1188 | $1,600 | $1.35 | 43d | 1 | 0.13mi |
| 1250 Strandwyck Dr Monroe, MI | 3.0 | 2.0 | 1256 | $1,274 | $1.01 | 13d | 1 | 1.11mi |
| 1985 S Custer Rd Apt 3 Monroe, MI | 2.0 | 1.0 | 1000 | $1,200 | $1.20 | 43d | 1 | 1.25mi |
| 765 N Macomb St Monroe, MI | 2.0 | 1.0 | 1050 | $1,150 | $1.10 | 43d | 1 | 1.26mi |
| 767 N Macomb St Monroe, MI | 2.0 | 1.0 | 1050 | $1,150 | $1.10 | 43d | 1 | 1.26mi |
| 75 Briarwood Trl Monroe, MI | 3.0–4.0 | 2.0 | 1360 | $1,199 | $0.88 | 13d | 1 | 1.47mi |
Listing history 7 events
-
2026-06-05statusdays on market $109,900 Pending 6 DOM
-
2026-06-02days on market $109,900 Active 5 DOM
-
2026-06-01days on market $109,900 Active 4 DOM
-
2026-05-31days on market $109,900 Active 3 DOM
-
2026-05-30days on market $109,900 Active 2 DOM
-
2026-05-28$109,900 Active
Show marketing remark (559 chars)
Welcome home to this charming and timeless front-gabled traditional home, offering a perfect blend of classic character and everyday functionality. The exterior features crisp siding complemented by sharp accent shutters and a welcoming, covered front entryway. Inside, the smart layout maximizes space, highlighted by bright, double-hung windows that flood the rooms with natural light. 3 (with room for a potential 4th) bedrooms - spacious throughout. Sold as is. Buyer and agent to verify all information. Images in this listing have been virtually staged.
-
2026-05-28$109,900 Active 559-char remark
Show marketing remark (559 chars)
Welcome home to this charming and timeless front-gabled traditional home, offering a perfect blend of classic character and everyday functionality. The exterior features crisp siding complemented by sharp accent shutters and a welcoming, covered front entryway. Inside, the smart layout maximizes space, highlighted by bright, double-hung windows that flood the rooms with natural light. 3 (with room for a potential 4th) bedrooms - spacious throughout. Sold as is. Buyer and agent to verify all information. Images in this listing have been virtually staged.
ⓘ Source: listings_history table (triggers on properties + properties_extension) + one-shot
backfill from property_details.listing_events for pre-trigger history.
Tax reassessment forecast MI · Partial reset (capped growth)
- Current annual tax
- $1,512 · $126/mo
- Projected year-2 tax
- $1,602 · $134/mo
- Expected delta
- +$90/yr (+$8/mo · 6.0%)
ⓘ Screening estimate from a state-policy table — verify with the county assessor before closing.
Climate risk First Street
- Flood 1/10 Low FEMA zone X (unshaded) · 0% chance over 30 yrs
- Wildfire 1/10 Low
- Heat 3/10 Moderate 7 d/yr ≥101°F today · 15 d/yr by 30 yrs out
- Wind 2/10 Low
- Air quality 4/10 Moderate 3 unhealthy d/yr today · 6 by 30 yrs out
Nearby sold comps map
Loading sold comps map…
Walkable amenities ~0.75 mi
Loading nearby amenities…
Taxation est. · year 1
- Rental income
- $17,269
- − Mortgage interest
- −$6,156
- − Property taxes
- −$1,512
- − Insurance
- −$550
- − Repairs & maintenance
- −$1,382
- − Management
- −$1,382
- − Depreciation
- −$3,197
- Taxable income
- $3,092
- Est. tax owed @ 24.0%
- −$742
- After-tax cash flow
- $3,924/yr
For passive investors: Depreciation is non-cash, so a rental often shows a tax loss while cash-flowing — sheltering income. Rental losses are passive: they offset passive income freely, and up to $25,000/yr can offset ordinary (W-2) income if you actively participate and your MAGI is under $100k (phasing out to $0 by $150k); unused losses carry forward. On sale, claimed depreciation is recaptured at up to 25%, and gains may owe capital-gains tax (a 1031 exchange can defer both). Figures are a year-1 estimate at your 24.0% rate — not tax advice; consult a CPA.
Schools (NCES district)
- District
- Monroe Public Schools
- NCES district ID
- 2624150
- Math proficiency
- 24% ▲ 3.00%
- Reading proficiency
- 47% ▲ 12.00%
- Median HH income
- $46,437
- Composite
- 30.33/100
- National rank
- #6269
- State rank
- #278 of 540 in MI
Livability — Monroe
- Score
- 83/100
- State rank
- #51
- US rank
- #1034
Category grades
Schools grade is shown separately in the Schools card above.
Census & demographics
- Census place
- Monroe, MI
- County
- Monroe County · 54,460 people
- City population
- 54,460
- Metro
- Monroe, MI
- Population (ZIP)
- 26,304
- Household income
- $67,414
- Rent vs Own
- Severe rent burden
- 733.0
Population outlook (Monroe County) Hauer SSP2
- Today (2025)
- 144,439 people
- By 2030
- 140,033 · -3.1%
- By 2040
- 128,408 · -11.1%
- By 2050
- 115,024 · -20.4%
- By 2075
- 87,273 · -39.6%
- By 2100
- 63,110 · -56.3%
Race, ethnicity, and origin ACS 2023
- Neighborhood character
- Predominantly White (85%)
- Race & ethnicity
- White 85% Two or more races 7% Black 5% Hispanic / Latino 5%
- Common ancestry
- Lithuanian 10% Romanian 8% Italian 2%
- Foreign-born
- 3% · Canada, Jamaica
- Languages at home
- 96% English-only · Spanish 2% Other Indo-European 1% Arabic 1%
Political lean MEDSL · Monroe
- 2024 margin
- Strong R (+27.1) · D 35.7% · R 62.9% · Other 1.4%
- 2008→2024 swing
- -31.5pp toward R · 2008: 4.3pp · 2024: -27.1pp
- All cycles
- 2024: R+27.1 2020: R+22.6 2016: R+22.1 2012: D+1.0 2008: D+4.3
Not yet ingested
- Civics
- —
Market trends
- HPI YoY
- ▼ -178.99%
- Current HPI
- 126.2638
- Rent YoY
- —
- Metro
- Monroe, MI
- State GDP YoY
- ▲ 1.37%
- F500 in state
- 28
Industry mix (Fortune 500 HQ in MI)
| Industry | F500 HQs | Revenue |
|---|---|---|
| Automotive Parts | 3 | $48B |
|
||
| Automotive | 2 | $372B |
|
||
| Chemicals | 1 | $45B |
|
||
| Automotive Retail | 1 | $29B |
|
||
| Healthcare / Medical Devices | 1 | $23B |
|
||
| Automotive Technology | 1 | $20B |
|
||
Price history
+0.0% since first listed2 events — show timeline
- 2026-05-28 Listed $109,900 MiRealSource-MiMLS
- 2026-05-28 Listed $109,900 REALCOMP
Property tax history
+7.7%/yrLatest (2025): $1,512 · -46.9% YoY. Source: county tax records.
Cash-flow waterfall
monthlySold comps — $/sqft
last 12 mo · ≤1 miLoading sold comps…