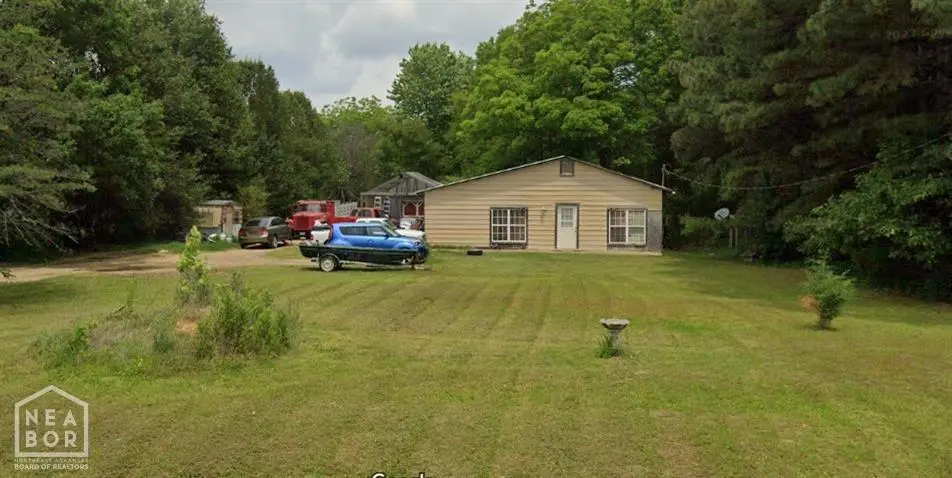
3520 Limestone Drive Dr · Jonesboro, AR
Flood risk 4/10 · Minor
- FEMA flood zone
- X
- Chance of flooding over 30 yrs
- 0.22%
- Est. flood insurance / yr
- $507 – $1,088
Fire risk 3/10 · Minor
- Est. fire insurance / yr
- $1,499 – $2,785
Heat risk 5/10 · Moderate
- Hot days now (above 108°F)
- 7 days/yr
- Hot days in 30 yrs
- 20 days/yr
Wind risk 4/10 · Minor
- Chance of severe wind over 30 yrs
- 10.0%
Air-quality risk 1/10 · Minimal
- Unhealthy air days now
- 0 days/yr
- Unhealthy air days in 30 yrs
- 0 days/yr
Risk factors via First Street. Map © Google.
Why this score? — see what drove the C+ grade
The composite is a weighted blend of 9 inputs, each scored 0–100. Each bar is that input's sub-score; the figure is the points it added to the 100-point composite (weight × sub-score).
- Cash flow +28.3/30.0
- DSCR +10.0/10.0
- 1% rule +7.8/10.0
- ARV discount +7.5/15.0
- Livability +3.2/5.0
- Rent growth +2.7/5.0
- Condition / age +2.5/5.0
- Schools +1.9/10.0
- Appreciation +0.0/10.0
$110,000
🖨 Deal sheet 📄 Offer letter ✓ Due diligence
Listing remarks MLS
Discover serenity on this 4-acre property, a flat canvas for your dreams. Formerly a shop, now a cozy living space, envision building your dream home or a quiet retreat. Fruit and nut trees add a touch of nature. Wire fencing for horses and a small barn provide practicality. Escape urban life! Schedule a showing today and explore the potential of this one of a kind property.
Key facts
- Fruit and nut trees
- 4 acre property
- Small barn
Tags
Neighborhood map
What this means for you Summary
Snapshot
- This is a 2-bed/1.0-bath single-family listed at $110k.
Deal economics
- At list price, monthly cash flow is $354 ($4k/yr) — positive.
- The deal already cash-flows at list — no discount required.
- Meets the 1% rule at list price ($1k rent vs $110k).
- Recommended offer: $97k (12.0% below list) — sets the bar for market timing.
- Cap rate 10.2% vs local median 4.4% in Jonesboro — top-decile yield for the area; either an underpriced asset or a hidden risk that comps aren't pricing in. Stress-test before assuming the spread holds.
Location & tenants
- Location reads 65/100 on livability (#145 in AR) — a middle-class / working-renter tenant base. Strengths: cost of living A+, housing A+, health & safety A+; Watch: schools D, crime F, amenities F.
- Nettleton School District (urban): math 21% / reading 24% proficiency, ranked #199 of 238 in AR (top 84%) — low school quality limits family demand, transient renter base, plan for 1-2y turnover.
- Market conditions: Rents flat; 309 active listings in the ZIP; 926 units permitted in Craighead County in 2024 (69 in 5+ unit buildings).
Forward outlook
- Local home prices are declining (-3.0%/yr); year-one equity from $761 of loan paydown is wiped out by about $3k of value loss. Plan a longer hold.
- Craighead County population projected at +38% by 2050 — long-run rental-demand tailwind backs the buy-and-hold thesis.
Negotiation context
- It's been on market 155 days — a 12% lower offer ($97k) is reasonable based on typical stale-listing flexibility.
- 4 sale attempts since 2y ago with the ask held roughly flat each time — persistent listings suggest the price (not the market) is what's stuck; bring a comps-based counter.
Risks & watch-outs
- Climate carrying-cost: extreme-heat days projected 7→20/yr by 2055 (HVAC capex compounding) — expect insurance premiums to compound above CPI over the hold.
Questions for the listing agent
- It's been on market 155 days. Have you received any prior offers? Is the seller open to a 12% concession, seller financing, or rate buy-down credit?
- Why hasn't it sold? Are there any deal-killer items the seller is aware of (foundation, flood, title, zoning, code violations)?
- Is there a deadline driving the sale (1031 exchange, divorce, estate, relocation)? That informs how much negotiation room exists.
- Schools are D-rated, which usually means shorter tenancies and higher turnover. Who's the typical renter profile here, and what's been the actual vacancy rate?
- Crime grade is F in this area — have there been break-ins, vandalism, or insurance claims at this property in the last 3 years? What carrier currently insures it and at what premium?
- What's the average days-on-market for RENTAL listings here right now (not sales)? A rising rental-DOM trend means longer vacancies and softer asking-rent achievability than the comps imply.
- What's the recent tenant-quality profile in this submarket — average credit score on applications, eviction rate, late-payment / NSF rate, and stable-employment percentage? A property-management company in the area should have these aggregated.
- How much new for-sale + rental construction is in the pipeline within 1–3 miles? Heavy new supply typically softens prices + rents 12–24 months out; constrained supply supports both.
Investment metrics
- 1% rule
- 1.28% ✓
- Cap rate
- 10.15%
- Cash-on-cash
- 13.79%
- DSCR
- 1.61
- GRM
- 6.5
CMA / ARV
- ARV (median comp)
- $277,532
- List price
- $110,000
- Delta
- -60.36%
- Verdict
- UNDERPRICED
- Comps
- 11 within 1.0 mi
Show comp detail 1 sale within ~0.75 mi
| Address | Dist | Beds/Ba | Sqft | Sold | Price | $/sf | Match |
|---|---|---|---|---|---|---|---|
| 5616 Hollow Creek Ln | 0.72mi | 3/2.0 (+1) | 2,334 (-11%) | 4mo | $320,000 | $137 | 36 |
Match score weights: distance 35% · size 25% · config 20% · recency 20%. Top-matched comps best support the ARV.
Projected returns pro-forma
-3.0% appreciation · 0.74% rent growth · sell at horizon
- IRR
- 1.4%
- Equity multiple
- 1.05×
- Total profit
- $1,603
- Equity at exit
- $16,401
- IRR
- 8.6%
- Equity multiple
- 1.59×
- Total profit
- $18,210
- Equity at exit
- $9,511
Cash invested: $30,800 (down + closing). Projections, not guarantees.
Landlord ↔ Tenant lean methodology
- Overall (STATE)
- 92 Strongly Landlord-Friendly
- State Arkansas
- 92 Strongly Landlord-Friendly · R+14
- County
- — inherits STATE
- City
- — inherits STATE
ZIP-level market 72404
- Home prices YoY
- -14.5%
- Rents YoY
- 0.7%
- Active inventory
- 309
- Price-to-rent
- 6.5×
Monthly cashflow live
- Estimated rent
- $1,410 medium interval (Pro) →
- Mortgage (P&I)
- −$577
- Tax est. 1.5%
- −$138 /mo · $1,650/yr
- Insurance
- −$46
- HOA
- −$0
- Vacancy / Maint / Mgmt
- −$296
- Net cashflow
- $354
Break-even live
UW: 25.0% down · 7.5% · 30yr · 1.5% tax · 5.0% vac · 8.0% maint · 8.0% mgmt
Financing live
Cash to close
- Down payment
- $27,500
- Closing costs
- $3,300
- Reserves months
- —
- Total cash needed
- —
Loan-product check · same deal, 3 products live
Conventional
25% down · 7.5% · 30yr
- Down + closing
- —
- Monthly P&I
- —
- Monthly cashflow
- —
- DSCR
- —
- Eligible?
- —
Personal DTI + credit; lowest rate.
DSCR
20% down · 8.5% · 30yr
- Down + closing
- —
- Monthly P&I
- —
- Monthly cashflow
- —
- DSCR
- —
- Eligible?
- —
No personal income docs; deal must DSCR.
Hard money
10% down · 12.0% · 12mo
- Down + closing
- —
- Monthly P&I
- —
- Monthly cashflow
- —
- DSCR
- —
- Eligible?
- —
Short-term bridge; refi at stabilization.
Listing history 29 events
-
2026-06-19days on market $110,000 Active 155 DOM
-
2026-06-18days on market $110,000 Active 154 DOM
-
2026-06-17days on market $110,000 Active 153 DOM
-
2026-06-16days on market $110,000 Active 152 DOM
-
2026-06-15days on market $110,000 Active 151 DOM
-
2026-06-14days on market $110,000 Active 149 DOM
-
2026-06-13days on market $110,000 Active 148 DOM
-
2026-06-10days on market $110,000 Active 146 DOM
-
2026-06-09days on market $110,000 Active 145 DOM
-
2026-06-08days on market $110,000 Active 144 DOM
-
2026-06-07days on market $110,000 Active 143 DOM
-
2026-06-05days on market $110,000 Active 140 DOM
-
2026-06-03days on market $110,000 Active 139 DOM
-
2026-06-02days on market $110,000 Active 138 DOM
-
2026-06-01days on market $110,000 Active 137 DOM
-
2026-05-31days on market $110,000 Active 136 DOM
-
2026-05-30days on market $110,000 Active 135 DOM
-
2026-01-06$110,000 Active 377-char remark
Show marketing remark (377 chars)
Discover serenity on this 4-acre property, a flat canvas for your dreams. Formerly a shop, now a cozy living space, envision building your dream home or a quiet retreat. Fruit and nut trees add a touch of nature. Wire fencing for horses and a small barn provide practicality. Escape urban life! Schedule a showing today and explore the potential of this one of a kind property.
-
2025-11-20historical
-
2025-09-18price $100,000
-
2025-09-18price $100,000
-
2025-08-29price $115,000
-
2025-08-29price $115,000
-
2025-05-21price $125,000
-
2025-05-21price $125,000
-
2025-05-01$134,900 Active
-
2025-04-30$134,900 New Listing
-
2024-10-25price $120,000
-
2024-02-04$149,000 Active
ⓘ Source: listings_history table (triggers on properties + properties_extension) + one-shot
backfill from property_details.listing_events for pre-trigger history.
Climate risk First Street
- Flood 4/10 Moderate FEMA zone X · 22% chance over 30 yrs
- Wildfire 3/10 Moderate
- Heat 5/10 Major 7 d/yr ≥108°F today · 20 d/yr by 30 yrs out
- Wind 4/10 Moderate 10% chance of damaging wind over 30 yrs
- Air quality 1/10 Low 0 unhealthy d/yr today · 0 by 30 yrs out
Nearby sold comps map
Loading sold comps map…
Walkable amenities ~0.75 mi
Loading nearby amenities…
Taxation est. · year 1
- Rental income
- $16,923
- − Mortgage interest
- −$6,162
- − Property taxes
- −$1,650
- − Insurance
- −$550
- − Repairs & maintenance
- −$1,354
- − Management
- −$1,354
- − Depreciation
- −$3,200
- Taxable income
- $2,654
- Est. tax owed @ 24.0%
- −$637
- After-tax cash flow
- $3,610/yr
For passive investors: Depreciation is non-cash, so a rental often shows a tax loss while cash-flowing — sheltering income. Rental losses are passive: they offset passive income freely, and up to $25,000/yr can offset ordinary (W-2) income if you actively participate and your MAGI is under $100k (phasing out to $0 by $150k); unused losses carry forward. On sale, claimed depreciation is recaptured at up to 25%, and gains may owe capital-gains tax (a 1031 exchange can defer both). Figures are a year-1 estimate at your 24.0% rate — not tax advice; consult a CPA.
Schools (NCES district)
- District
- Nettleton School District
- NCES district ID
- 0510440
- Math proficiency
- 21% ▼ -16.00%
- Reading proficiency
- 24% ▼ -12.00%
- Median HH income
- $39,754
- Composite
- 19.0/100
- National rank
- #8846
- State rank
- #199 of 238 in AR
Livability — Jonesboro
- Score
- 65/100
- State rank
- #145
- US rank
- #12692
Category grades
Schools grade is shown separately in the Schools card above.
Census & demographics
- Census place
- Jonesboro, AR
- County
- Craighead County · 97,185 people
- City population
- 91,245
- Metro
- Jonesboro, AR
- Population (ZIP)
- 29,968
- Household income
- $70,269
- Rent vs Own
- Severe rent burden
- 869.0
Population outlook (Craighead County) Hauer SSP2
- Today (2025)
- 122,235 people
- By 2030
- 131,338 · +7.4%
- By 2040
- 149,862 · +22.6%
- By 2050
- 168,034 · +37.5%
- By 2075
- 208,094 · +70.2%
- By 2100
- 233,251 · +90.8%
Race, ethnicity, and origin ACS 2023
- Neighborhood character
- Predominantly White (72%)
- Race & ethnicity
- White 72% Black 18% Two or more races 5% Hispanic / Latino 4% Asian 2%
- Common ancestry
- Slovak 3% Lithuanian 1% Italian 1%
- Foreign-born
- 5% · Canada, China, South Korea
- Languages at home
- 95% English-only · Spanish 3% Chinese 1%
Political lean MEDSL · Craighead
- 2024 margin
- Solid R (+37.4) · D 30.1% · R 67.5% · Other 2.4%
- 2008→2024 swing
- -12.9pp toward R · 2008: -24.5pp · 2024: -37.4pp
- All cycles
- 2024: R+37.4 2020: R+35.4 2016: R+35.2 2012: R+31.1 2008: R+24.5
Not yet ingested
- Civics
- —
Market trends
- HPI YoY
- ▼ -35.22%
- Current HPI
- 208.3772
- Rent YoY
- ▲ 0.74%
- Metro
- Jonesboro, AR
- State GDP YoY
- ▲ 3.80%
- F500 in state
- 10
Industry mix (Fortune 500 HQ in AR)
| Industry | F500 HQs | Revenue |
|---|---|---|
| Retail | 1 | $681B |
|
||
| Food / Agriculture | 1 | $53B |
|
||
| Retail / Energy | 1 | $22B |
|
||
| Transportation / Logistics | 1 | $12B |
|
||
| Energy | 1 | $4B |
|
||
Price history
-26.2% since first listed12 events — show timeline
- 2026-01-06 Listed $110,000 NEABOR MLS
- 2025-11-20 Listing Removed — CARMLS
- 2025-09-18 Price Changed $100,000 CARMLS
- 2025-09-18 Price Changed $100,000 NEABOR MLS
- 2025-08-29 Price Changed $115,000 CARMLS
- 2025-08-29 Price Changed $115,000 NEABOR MLS
- 2025-05-21 Price Changed $125,000 CARMLS
- 2025-05-21 Price Changed $125,000 NEABOR MLS
- 2025-05-01 Listed $134,900 NEABOR MLS
- 2025-04-30 Listed $134,900 CARMLS
- 2024-10-25 Price Changed $120,000 NEABOR MLS
- 2024-02-04 Listed $149,000 NEABOR MLS
Property tax history
-0.2%/yrLatest (2025): $173 · +0.2% YoY. Source: county tax records.
Cash-flow waterfall
monthlySold comps — $/sqft
last 12 mo · ≤1 miLoading sold comps…