1013 Forest Park St · Bunnell, FL
Flood risk 1/10 · Minimal
- FEMA flood zone
- X (unshaded)
- Chance of flooding over 30 yrs
- 0.0%
- Est. flood insurance / yr
- $507 – $1,088
Fire risk 5/10 · Moderate
- Est. fire insurance / yr
- $947 – $1,759
Heat risk 9/10 · Severe
- Hot days now (above 108°F)
- 7 days/yr
- Hot days in 30 yrs
- 20 days/yr
Wind risk 10/10 · Severe
- Chance of severe wind over 30 yrs
- 99.0%
Air-quality risk 2/10 · Minimal
- Unhealthy air days now
- 2 days/yr
- Unhealthy air days in 30 yrs
- 2 days/yr
Risk factors via First Street. Map © Google.
Why this score? — see what drove the F grade
The composite is a weighted blend of 9 inputs, each scored 0–100. Each bar is that input's sub-score; the figure is the points it added to the 100-point composite (weight × sub-score).
- Cash flow +13.2/30.0
- Schools +4.6/10.0
- DSCR +4.0/10.0
- Livability +3.6/5.0
- 1% rule +2.8/10.0
- Rent growth +2.5/5.0
- Condition / age +2.5/5.0
- ARV discount +1.0/15.0
- Appreciation +0.0/10.0
$239,000
🖨 Deal sheet (PDF) 📄 Offer letter ✓ Due diligence
Listing remarks MLS
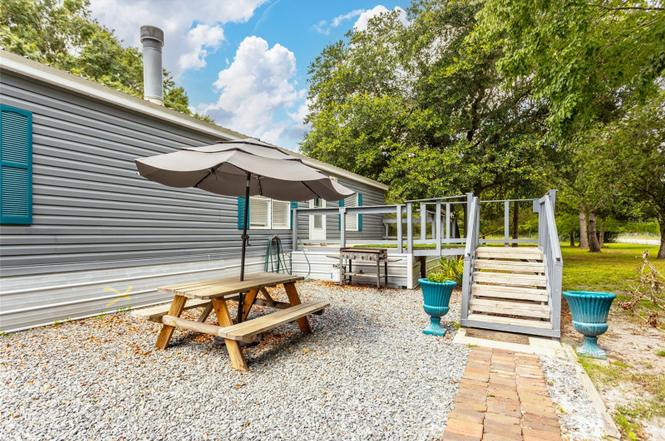
3 Bedroom, 2 bathroom home located on corner lot with almost an acre of land. The home features a wooden ramp to the front deck, high ceilings, open living room with fireplace, New laminate floors, recently painted, walk in closets and a large tub in master bath with separate shower.
Key facts
- Remodeled fireplace
- Fully fenced
- Electric gate
Tags
Property features AI
Finance
- Other: Property type: Residential; Property subtype: Manufactured Home; Zoning: MH-1; Total building area approximately 1,559 square feet; Living area approximately 1,431 square feet; Lot size about 0.92 acres (approx. 1/2 to less than 1 acre); One well and one septic on the property
- HOA & community: No HOA; Located in the Daytona North development
Exterior
- Parking: Dirt road access
- Utilities: Well water; Septic tank; Electricity connected; Sewer connected
- Home design: Manufactured double-wide home; Single-story; North-facing; Completed condition; Homestead exempt
- Construction: Vinyl siding; Metal roof; Crawlspace foundation; Built as a manufactured home
- Exterior features: Front porch; Exterior storage; Cleared lot; Corner lot; Trees and landscaped
Interior
- Kitchen: Convection oven; Cooktop; Range; Microwave; Dishwasher; Refrigerator; Water softener; Electric water heater
- Bedrooms: 3 bedrooms
- Flooring: Wood flooring
- Bathrooms: 2 full bathrooms
- Heating & cooling: Central heating; Central air conditioning
- Interior features: Ceiling fans; Open floor plan; Walk-in closets
- Laundry & utility: Washer hookup; Electric dryer hookup; Dedicated laundry room
Neighborhood map
What this means for you Summary
Snapshot
- This is a 3-bed/2.0-bath manufactured listed at $239k.
Deal economics
- At list price, monthly cash flow is $-6 ($-67/yr) — negative.
- To cash-flow at today's rent, offer at most $238k (0.4% below list).
- To meet the 1% rule (rent ≥ 1% of price), the offer needs to be $187k (21.7% below list).
- Recommended offer: $187k (21.7% below list) — sets the bar for 1% rule.
- Cap rate 6.3% vs local median 3.5% in Bunnell — top-decile yield for the area; either an underpriced asset or a hidden risk that comps aren't pricing in. Stress-test before assuming the spread holds.
Location & tenants
- Location reads 71/100 on livability (#378 in FL) — a middle-class / working-renter tenant base. Strengths: crime A+, cost of living A+, health & safety A+; Watch: amenities F, commute F, employment F.
- Flagler (rural): math 53% / reading 56% proficiency, ranked #20 of 73 in FL (top 27%) — acceptable for families but not a draw, mixed tenant base, ~2y average lease.
- Zoned schools: Bunnell Elementary School (math 42% / reading 44%, grade F, #1,366 of 2,144 statewide, top 64%, 1,080 students, 73% FRL); Buddy Taylor Middle School (math 50% / reading 45%, grade C-, #288 of 571 statewide, top 51%, 1,343 students, 63% FRL); Flagler-Palm Coast High School (math 36% / reading 51%, grade F, #248 of 667 statewide, top 38%, 2,523 students, 52% FRL).
- Market conditions: 281 active listings in the ZIP; 2,588 units permitted in Flagler County in 2024 (0 in 5+ unit buildings).
Forward outlook
- Local home prices are declining (-3.0%/yr); year-one equity from $2k of loan paydown is wiped out by about $7k of value loss. Plan a longer hold.
- Flagler County population projected at +28% by 2050 — long-run rental-demand tailwind backs the buy-and-hold thesis.
Negotiation context
- It's been on market 353 days — a 12% lower offer ($210k) is reasonable based on typical stale-listing flexibility.
- 6 sale attempts since 7y ago; this cycle's ask has dropped $51k (18%) from the opening price — seller is motivated, your offer sets the floor, not the list.
- Current owner paid $170k; 41% above their basis — modest negotiation headroom, anchor on the comps not their cost.
Risks & watch-outs
- Climate carrying-cost: severe wind risk, 99% chance of damaging wind over 30y; moderate wildfire risk; extreme-heat days projected 7→20/yr by 2055 (HVAC capex compounding) — expect insurance premiums to compound above CPI over the hold.
Questions for the listing agent
- What do current leases actually rent for vs. the listed asking? Can we see a recent rent roll and the last 12 months of T-12 income?
- It's been on market 353 days. Have you received any prior offers? Is the seller open to a 22% concession, seller financing, or rate buy-down credit?
- Why hasn't it sold? Are there any deal-killer items the seller is aware of (foundation, flood, title, zoning, code violations)?
- Is there a deadline driving the sale (1031 exchange, divorce, estate, relocation)? That informs how much negotiation room exists.
- The area grade is low — what's the realistic commute time and amenity access for the typical tenant pool here? Any planned neighborhood developments (good or bad) we should know about?
- What's the average days-on-market for RENTAL listings here right now (not sales)? A rising rental-DOM trend means longer vacancies and softer asking-rent achievability than the comps imply.
- What's the recent tenant-quality profile in this submarket — average credit score on applications, eviction rate, late-payment / NSF rate, and stable-employment percentage? A property-management company in the area should have these aggregated.
- How much new for-sale + rental construction is in the pipeline within 1–3 miles? Heavy new supply typically softens prices + rents 12–24 months out; constrained supply supports both.
Investment metrics
- 1% rule
- 0.78% ✗
- Cap rate
- 6.26%
- Cash-on-cash
- -0.10%
- DSCR
- 1.00
- GRM
- 10.6
CMA / ARV
- ARV (on-the-fly)
- $208,926
- Comps found
- 3
Show comp detail 3 sales within ~0.75 mi
| Address | Dist | Beds/Ba | Sqft | Sold | Price | $/sf | Match |
|---|---|---|---|---|---|---|---|
| 1089 Aspen St | 0.45mi | 3/2.0 | 1,493 (+4%) | 1mo | $279,000 | $187 | 71 |
| 1328 County Road 305 | 0.58mi | 3/2.0 | 1,512 (+6%) | 10mo | $220,000 | $146 | 55 |
| 1101 Hazelnut St | 0.69mi | 4/2.0 (+1) | 1,620 (+13%) | 3mo | $100,000 | $62 | 38 |
Match score weights: distance 35% · size 25% · config 20% · recency 20%. Top-matched comps best support the ARV.
Projected returns pro-forma
-3.0% appreciation · 3.0% rent growth · sell at horizon
- IRR
- -16.5%
- Equity multiple
- 0.41×
- Total profit
- $-39,161
- Equity at exit
- $35,636
- IRR
- -8.3%
- Equity multiple
- 0.48×
- Total profit
- $-34,864
- Equity at exit
- $20,664
Cash invested: $66,920 (down + closing). Projections, not guarantees.
Landlord ↔ Tenant lean methodology
- Overall (STATE)
- 87 Strongly Landlord-Friendly
- State Florida
- 87 Strongly Landlord-Friendly · R+3
- County
- — inherits STATE
- City
- — inherits STATE
ZIP-level market 32110
- Home prices YoY
- -22.4%
- Active inventory
- 281
- Price-to-rent
- 10.6×
Monthly cashflow live
- Estimated rent
- $1,871 medium interval (Pro) →
- Mortgage (P&I)
- −$1,253
- Tax from tax record
- −$131 /mo · $1,574/yr
- Insurance
- −$100
- HOA
- −$0
- Vacancy / Maint / Mgmt
- −$393
- Net cashflow
- $-6
Break-even live
Sensitivity live
| Price | -10% $130 | -5% $62 | +0% $-6 | +5% $-73 | +10% $-141 |
|---|---|---|---|---|---|
| Rent | -10% $-153 | -5% $-80 | +0% $-6 | +5% $68 | +10% $142 |
| Rate | -1.0pp $115 | -0.5pp $55 | base $-6 | +0.5pp $-68 | +1.0pp $-131 |
UW: 25.0% down · 7.5% · 30yr · 1.5% tax · 5.0% vac · 8.0% maint · 8.0% mgmt
Financing live
Cash to close
- Down payment
- $59,750
- Closing costs
- $7,170
- Reserves months
- —
- Total cash needed
- —
Loan-product check · same deal, 3 products live
Conventional
25% down · 7.5% · 30yr
- Down + closing
- —
- Monthly P&I
- —
- Monthly cashflow
- —
- DSCR
- —
- Eligible?
- —
Personal DTI + credit; lowest rate.
DSCR
20% down · 8.5% · 30yr
- Down + closing
- —
- Monthly P&I
- —
- Monthly cashflow
- —
- DSCR
- —
- Eligible?
- —
No personal income docs; deal must DSCR.
Hard money
10% down · 12.0% · 12mo
- Down + closing
- —
- Monthly P&I
- —
- Monthly cashflow
- —
- DSCR
- —
- Eligible?
- —
Short-term bridge; refi at stabilization.
Listing history 32 events
-
2026-06-21days on market $239,000 Active 353 DOM
-
2026-06-18days on market $239,000 Active 350 DOM
-
2026-06-17days on market $239,000 Active 349 DOM
-
2026-06-16days on market $239,000 Active 348 DOM
-
2026-06-15days on market $239,000 Active 347 DOM
-
2026-06-14days on market $239,000 Active 345 DOM
-
2026-06-13pricedays on market $239,000 Active 344 DOM
-
2026-06-10days on market $255,000 Active 342 DOM
-
2026-06-09days on market $255,000 Active 341 DOM
-
2026-06-08days on market $255,000 Active 340 DOM
-
2026-06-07days on market $255,000 Active 339 DOM
-
2026-06-03days on market $255,000 Active 335 DOM
-
2026-06-02days on market $255,000 Active 334 DOM
-
2026-06-01days on market $255,000 Active 333 DOM
-
2026-05-31days on market $255,000 Active 332 DOM
-
2026-01-22price $265,000
-
2025-09-24price $274,990
-
2025-08-11price $284,990
-
2025-07-03$289,990 Active
-
2022-09-22soldstatus $170,000
-
2021-06-28soldstatus $120,000
-
2020-08-17soldstatus $90,000
-
2020-08-12soldstatus $90,000 284-char remark
Show marketing remark (284 chars)
3 Bedroom, 2 bathroom home located on corner lot with almost an acre of land. The home features a wooden ramp to the front deck, high ceilings, open living room with fireplace, New laminate floors, recently painted, walk in closets and a large tub in master bath with separate shower.
-
2020-06-18$115,000 284-char remark
Show marketing remark (284 chars)
3 Bedroom, 2 bathroom home located on corner lot with almost an acre of land. The home features a wooden ramp to the front deck, high ceilings, open living room with fireplace, New laminate floors, recently painted, walk in closets and a large tub in master bath with separate shower.
-
2019-08-29historical
-
2019-08-19$58,000
-
2019-07-26historical
-
2019-07-26historical
-
2019-07-26historical
-
2019-05-15$115,000
-
2019-05-15$115,000
-
2019-05-14$115,000
ⓘ Source: listings_history table (triggers on properties + properties_extension) + one-shot
backfill from property_details.listing_events for pre-trigger history.
Tax reassessment forecast FL · Resets to sale price
- Current annual tax
- $1,574 · $131/mo
- Projected year-2 tax
- $1,984 · $165/mo
- Expected delta
- +$410/yr (+$34/mo · 26.0%)
ⓘ Screening estimate from a state-policy table — verify with the county assessor before closing.
Climate risk First Street
- Flood 1/10 Low FEMA zone X (unshaded) · 0% chance over 30 yrs
- Wildfire 5/10 Major
- Heat 9/10 Extreme 7 d/yr ≥108°F today · 20 d/yr by 30 yrs out
- Wind 10/10 Extreme 99% chance of damaging wind over 30 yrs
- Air quality 2/10 Low 2 unhealthy d/yr today · 2 by 30 yrs out
Nearby sold comps map
Loading sold comps map…
Walkable amenities ~0.75 mi
Loading nearby amenities…
Taxation est. · year 1
- Rental income
- $22,458
- − Mortgage interest
- −$13,388
- − Property taxes
- −$1,574
- − Insurance
- −$1,195
- − Repairs & maintenance
- −$1,797
- − Management
- −$1,797
- − Depreciation
- −$6,953
- Taxable loss
- −$4,245
- Est. tax savings @ 24.0%
- +$1,019
- After-tax cash flow
- $951/yr
For passive investors: Depreciation is non-cash, so a rental often shows a tax loss while cash-flowing — sheltering income. Rental losses are passive: they offset passive income freely, and up to $25,000/yr can offset ordinary (W-2) income if you actively participate and your MAGI is under $100k (phasing out to $0 by $150k); unused losses carry forward. On sale, claimed depreciation is recaptured at up to 25%, and gains may owe capital-gains tax (a 1031 exchange can defer both). Figures are a year-1 estimate at your 24.0% rate — not tax advice; consult a CPA.
Schools (NCES district)
- District
- Flagler
- NCES district ID
- 1200540
- Math proficiency
- 53% ▼ -9.00%
- Reading proficiency
- 56% ▼ -4.00%
- Median HH income
- $48,354
- Composite
- 46.35/100
- National rank
- #2464
- State rank
- #20 of 73 in FL
Livability — Bunnell
- Score
- 71/100
- State rank
- #378
- US rank
- #6714
Category grades
Schools grade is shown separately in the Schools card above.
Census & demographics
- Population (ZIP)
- 9,877
Population outlook (Flagler County) Hauer SSP2
- Today (2025)
- 123,474 people
- By 2030
- 131,864 · +6.8%
- By 2040
- 146,176 · +18.4%
- By 2050
- 157,398 · +27.5%
- By 2075
- 177,990 · +44.2%
- By 2100
- 183,381 · +48.5%
Race, ethnicity, and origin ACS 2023
- Neighborhood character
- Predominantly White (81%)
- Race & ethnicity
- White 81% Black 11% Two or more races 6% Hispanic / Latino 3%
- Common ancestry
- Romanian 6% Lithuanian 2% Slovak 2%
- Foreign-born
- 2% · Canada
- Languages at home
- 97% English-only · Spanish 2%
Political lean MEDSL · Flagler
- 2024 margin
- Strong R (+28.2) · D 35.6% · R 63.8%
- 2008→2024 swing
- -29.8pp toward R · 2008: 1.6pp · 2024: -28.2pp
- All cycles
- 2024: R+28.2 2020: R+20.8 2016: R+20.6 2012: R+7.4 2008: D+1.6
Not yet ingested
- Civics
- —
Market trends
- HPI YoY
- ▼ -78.28%
- Current HPI
- 271.446
- Rent YoY
- —
- Metro
- —
- State GDP YoY
- ▲ 3.28%
- F500 in state
- 36
Industry mix (Fortune 500 HQ in FL)
| Industry | F500 HQs | Revenue |
|---|---|---|
| Industrial Technology | 2 | $29B |
|
||
| Insurance | 2 | $17B |
|
||
| Retail | 1 | $60B |
|
||
| Technology Distribution | 1 | $58B |
|
||
| Homebuilding | 1 | $35B |
|
||
| Technology Manufacturing | 1 | $35B |
|
||
Price history
+130.4% since first listed17 events — show timeline
- 2026-01-22 Price Changed $265,000 Stellar MLS as Distributed by MLS Grid
- 2025-09-24 Price Changed $274,990 Stellar MLS as Distributed by MLS Grid
- 2025-08-11 Price Changed $284,990 Stellar MLS as Distributed by MLS Grid
- 2025-07-03 Listed $289,990 Stellar MLS as Distributed by MLS Grid
- 2022-09-22 Sold (Public Records) $170,000 Public Records
- 2021-06-28 Sold (Public Records) $120,000 Public Records
- 2020-08-17 Sold (Public Records) $90,000 Public Records
- 2020-08-12 Sold (MLS) $90,000 Stellar MLS as Distributed by MLS Grid
- 2020-06-18 Listed $115,000 Stellar MLS as Distributed by MLS Grid
- 2019-08-29 Listing Removed — Stellar MLS as Distributed by MLS Grid
- 2019-08-19 Listed $58,000 Stellar MLS as Distributed by MLS Grid
- 2019-07-26 Listing Removed — Stellar MLS as Distributed by MLS Grid
- 2019-07-26 Listing Removed — Daytona MLS
- 2019-07-26 Listing Removed — Stellar MLS as Distributed by MLS Grid
- 2019-05-15 Listed $115,000 Stellar MLS as Distributed by MLS Grid
- 2019-05-15 Listed $115,000 Stellar MLS as Distributed by MLS Grid
- 2019-05-14 Listed $115,000 Daytona MLS
Property tax history
+9.7%/yrLatest (2025): $1,574 · -0.5% YoY. Source: county tax records.
Cash-flow waterfall
monthlySold comps — $/sqft
last 12 mo · ≤1 miLoading sold comps…