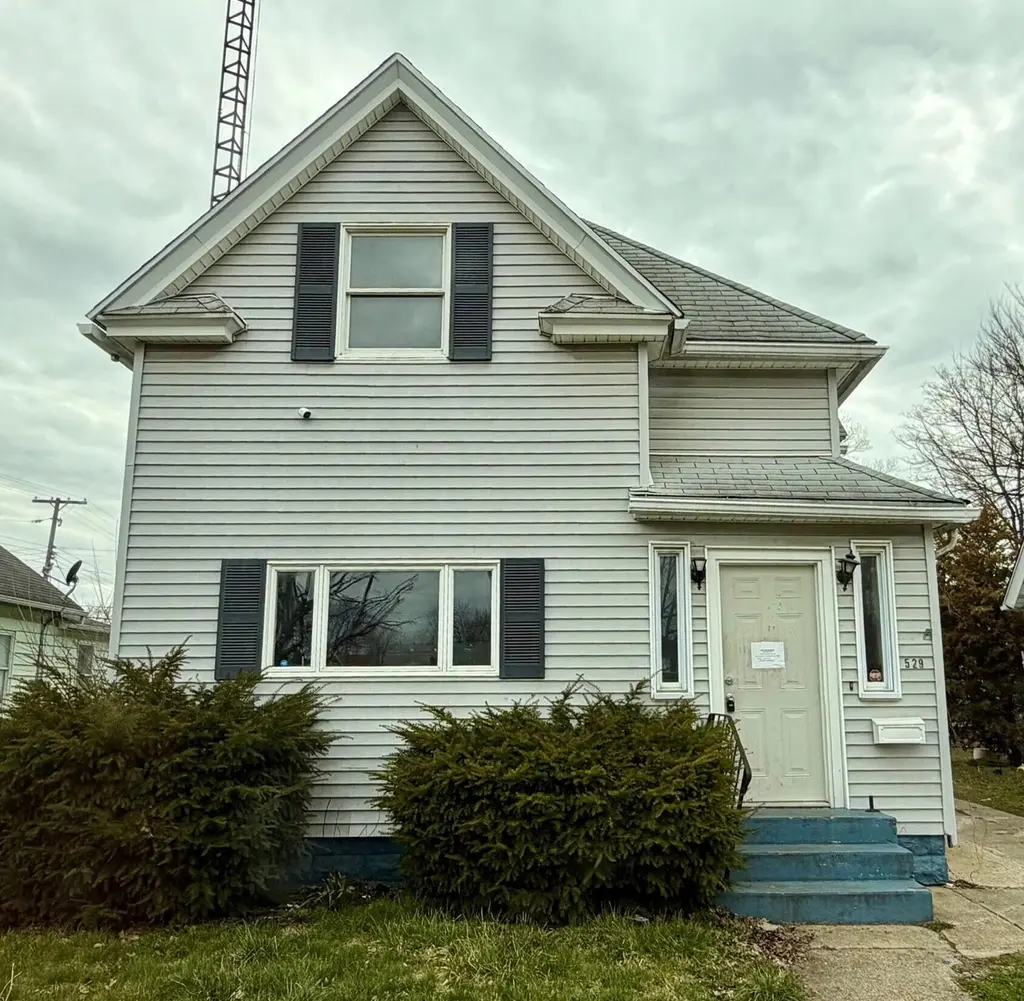
529 S Brookfield St · South Bend, IN
Flood risk 1/10 · Minimal
- FEMA flood zone
- X (unshaded)
- Chance of flooding over 30 yrs
- 0.0%
- Est. flood insurance / yr
- $473 – $860
Fire risk 1/10 · Minimal
- Est. fire insurance / yr
- $717 – $1,331
Heat risk 3/10 · Minor
- Hot days now (above 99°F)
- 7 days/yr
- Hot days in 30 yrs
- 16 days/yr
Wind risk 2/10 · Minimal
- Chance of severe wind over 30 yrs
- —
Air-quality risk 3/10 · Minor
- Unhealthy air days now
- 3 days/yr
- Unhealthy air days in 30 yrs
- 3 days/yr
Risk factors via First Street. Map © Google.
Why this score? — see what drove the D+ grade
The composite is a weighted blend of 9 inputs, each scored 0–100. Each bar is that input's sub-score; the figure is the points it added to the 100-point composite (weight × sub-score).
- Cash flow +25.3/30.0
- DSCR +8.3/10.0
- 1% rule +6.1/10.0
- Livability +3.2/5.0
- Rent growth +2.5/5.0
- Condition / age +2.5/5.0
- Schools +1.4/10.0
- ARV discount +0.0/15.0
- Appreciation +0.0/10.0
$130,500
🖨 Deal sheet 📄 Offer letter ✓ Due diligence
Listing remarks MLS
Property located in the Westside of South Bend close to restaurants, Grocery Stores, Schools, Churches, Gas Stations and much more! Do not miss this opportunity and scheduled your appointment today!
Key facts
- 4,791 sq ft lot
- 2 garage spots
- Built 1905
Property features AI
Exterior
- Parking: Detached garage; 2 garage spaces
- Utilities: Public water service; Public sewer
- Home design: One and one-half story home; Built in 1905
- Construction: Has basement (unfinished)
- Exterior features: Neighborhood view; Public water; Public sewer
Interior
- Kitchen: Electric range
- Bedrooms: Primary bedroom; Four additional bedrooms (total 5 bedrooms listed across levels)
- Bathrooms: 1 full bathroom
- Heating & cooling: Heating: Other; Cooling: Other
- Interior features: No notable built-in interior features listed; Unfinished basement
Neighborhood map
What this means for you Summary
Snapshot
- This is a 3-bed/1.0-bath single-family listed at $130k.
Deal economics
- At list price, monthly cash flow is $296 ($4k/yr) — positive.
- The deal already cash-flows at list — no discount required.
- Meets the 1% rule at list price ($1k rent vs $130k).
- Recommended offer: $129k (1.5% below list) — sets the bar for market timing.
- Cap rate 9.0% vs local median 4.4% in South Bend — top-decile yield for the area; either an underpriced asset or a hidden risk that comps aren't pricing in. Stress-test before assuming the spread holds.
Location & tenants
- Location reads 64/100 on livability (#365 in IN) — a middle-class / working-renter tenant base. Strengths: cost of living A+, housing A+, health & safety A+; Watch: amenities D, employment D, schools F.
- South Bend Community School Corporation (urban): math 12% / reading 21% proficiency, ranked #284 of 301 in IN (top 94%) — low school quality limits family demand, transient renter base, plan for 1-2y turnover; 66% free/reduced lunch — lower-income household profile, screen leases tightly.
- Market conditions: 52 active listings in the ZIP; 7 comparable units currently listed for rent nearby; rentals at typical pace (median 21d on market — plan ~3-4 weeks tenant-placement turnaround); 754 units permitted in St. Joseph County in 2024 (460 in 5+ unit buildings).
Forward outlook
- Local home prices are declining (-3.0%/yr); year-one equity from $902 of loan paydown is wiped out by about $4k of value loss. Plan a longer hold.
Negotiation context
- It's been on market 18 days — a 2% lower offer ($129k) is reasonable based on typical stale-listing flexibility.
- 3 sale attempts since 10y ago with the ask held roughly flat each time — persistent listings suggest the price (not the market) is what's stuck; bring a comps-based counter.
Risks & watch-outs
- Watch-outs: built in 1905 — expect roof / HVAC / electrical / plumbing capex.
Questions for the listing agent
- Built in 1905 — when were the roof, HVAC, electrical panel, plumbing, and water heater last replaced?
- Is there a deadline driving the sale (1031 exchange, divorce, estate, relocation)? That informs how much negotiation room exists.
- Schools are F-rated, which usually means shorter tenancies and higher turnover. Who's the typical renter profile here, and what's been the actual vacancy rate?
- Crime grade is F in this area — have there been break-ins, vandalism, or insurance claims at this property in the last 3 years? What carrier currently insures it and at what premium?
- The area grade is low — what's the realistic commute time and amenity access for the typical tenant pool here? Any planned neighborhood developments (good or bad) we should know about?
- What's the average days-on-market for RENTAL listings here right now (not sales)? A rising rental-DOM trend means longer vacancies and softer asking-rent achievability than the comps imply.
- What's the recent tenant-quality profile in this submarket — average credit score on applications, eviction rate, late-payment / NSF rate, and stable-employment percentage? A property-management company in the area should have these aggregated.
- How much new for-sale + rental construction is in the pipeline within 1–3 miles? Heavy new supply typically softens prices + rents 12–24 months out; constrained supply supports both.
Investment metrics
- 1% rule
- 1.11% ✓
- Cap rate
- 9.01%
- Cash-on-cash
- 9.71%
- DSCR
- 1.43
- GRM
- 7.5
CMA / ARV
- ARV (median comp)
- $98,833
- List price
- $130,500
- Delta
- 32.04%
- Verdict
- OVERPRICED
- Comps
- 20 within 1.0 mi
Show comp detail 11 sales within ~0.75 mi
| Address | Dist | Beds/Ba | Sqft | Sold | Price | $/sf | Match |
|---|---|---|---|---|---|---|---|
| 420 S Olive St | 0.30mi | 4/1.5 (+1) | 2,034 (-2%) | 5mo | $118,000 | $58 | 72 |
| 2417 Poland St | 0.33mi | 3/2.0 | 1,900 (-8%) | 1mo | $170,000 | $89 | 66 |
| 426 Kosciuszko St | 0.25mi | 3/2.0 | 1,930 (-6%) | 18mo | $95,000 | $49 | 59 |
| 618 S Olive St | 0.27mi | 4/1.0 (+1) | 1,928 (-7%) | 21mo | $160,000 | $83 | 54 |
| 828 Harris St | 0.42mi | 4/1.5 (+1) | 1,994 (-3%) | 23mo | $155,000 | $78 | 49 |
| 726 S Meade St | 0.41mi | 4/1.0 (+1) | 1,848 (-10%) | 12mo | $68,000 | $37 | 48 |
| 1229 W Western Ave | 0.51mi | 4/1.0 (+1) | 1,872 (-9%) | 10mo | $98,500 | $53 | 47 |
| 721 S Arnold St | 0.54mi | 4/2.0 (+1) | 1,829 (-11%) | 1mo | $118,000 | $65 | 46 |
| 606 S Bendix St | 0.55mi | 4/3.0 (+1) | 1,890 (-8%) | 3mo | $165,000 | $87 | 45 |
| 510 S Kaley St | 0.49mi | 3/1.5 | 1,920 (-7%) | 23mo | $72,500 | $38 | 44 |
| 2633 Dunham St | 0.51mi | 4/2.0 (+1) | 2,304 (+12%) | 8mo | $37,500 | $16 | 42 |
Match score weights: distance 35% · size 25% · config 20% · recency 20%. Top-matched comps best support the ARV.
Projected returns pro-forma
-3.0% appreciation · 3.0% rent growth · sell at horizon
- IRR
- -1.7%
- Equity multiple
- 0.94×
- Total profit
- $-2,328
- Equity at exit
- $19,458
- IRR
- 8.0%
- Equity multiple
- 1.61×
- Total profit
- $22,175
- Equity at exit
- $11,283
Cash invested: $36,540 (down + closing). Projections, not guarantees.
Landlord ↔ Tenant lean methodology
- Overall (STATE)
- 90 Strongly Landlord-Friendly
- State Indiana
- 90 Strongly Landlord-Friendly · R+11
- County
- — inherits STATE
- City
- — inherits STATE
ZIP-level market 46619
- Home prices YoY
- -29.9%
- Active inventory
- 52
- Price-to-rent
- 7.5×
Monthly cashflow live
- Estimated rent
- $1,448 high interval (Pro) →
- Mortgage (P&I)
- −$684
- Tax from tax record
- −$110 /mo · $1,315/yr
- Insurance
- −$54
- HOA
- −$0
- Vacancy / Maint / Mgmt
- −$304
- Net cashflow
- $296
Break-even live
UW: 25.0% down · 7.5% · 30yr · 1.5% tax · 5.0% vac · 8.0% maint · 8.0% mgmt
Financing live
Cash to close
- Down payment
- $32,625
- Closing costs
- $3,915
- Reserves months
- —
- Total cash needed
- —
Loan-product check · same deal, 3 products live
Conventional
25% down · 7.5% · 30yr
- Down + closing
- —
- Monthly P&I
- —
- Monthly cashflow
- —
- DSCR
- —
- Eligible?
- —
Personal DTI + credit; lowest rate.
DSCR
20% down · 8.5% · 30yr
- Down + closing
- —
- Monthly P&I
- —
- Monthly cashflow
- —
- DSCR
- —
- Eligible?
- —
No personal income docs; deal must DSCR.
Hard money
10% down · 12.0% · 12mo
- Down + closing
- —
- Monthly P&I
- —
- Monthly cashflow
- —
- DSCR
- —
- Eligible?
- —
Short-term bridge; refi at stabilization.
Rent comps 7 comps
| Address | Beds | Baths | Sqft | Rent | $/sqft | DOM | Units | Dist |
|---|---|---|---|---|---|---|---|---|
| 721 S Arnold St South Bend, IN | 4.0 | 2.0 | 2568 | $1,800 | $0.70 | 13d | 1 | 0.54mi |
| 1008 O Brien St Unit O South Bend, IN | 3.0 | 1.0 | 1634 | $800 | $0.49 | 21d | 1 | 1.30mi |
| 2205 Lincoln Way W South Bend, IN | 4.0 | 2.0 | 1440 | $1,565 | $1.09 | 13d | 1 | 1.32mi |
| 2002 Catalpa Ave South Bend, IN | 3.0 | 1.0 | 1424 | $1,250 | $0.88 | 21d | 1 | 1.37mi |
| 211 W Washington St South Bend, IN | 3.0 | 1.0–2.5 | 1162 | $7,491 | $6.44 | 21d | 19 | 1.42mi |
| 504 W Navarre St South Bend, IN | 3.0 | 1.5 | 1520 | $1,350 | $0.89 | 13d | 1 | 1.42mi |
| 164 S Gladstone Ave South Bend, IN | 4.0 | 1.0 | 1440 | $1,365 | $0.95 | 44d | 1 | 1.48mi |
Listing history 11 events
-
2026-05-08$130,500 Active 295-char remark
-
2024-02-16soldstatus $145,500 Closed 199-char remark
Show marketing remark (199 chars)
Property located in the Westside of South Bend close to restaurants, Grocery Stores, Schools, Churches, Gas Stations and much more! Do not miss this opportunity and scheduled your appointment today!
-
2024-02-10status Pending 199-char remark
Show marketing remark (199 chars)
Property located in the Westside of South Bend close to restaurants, Grocery Stores, Schools, Churches, Gas Stations and much more! Do not miss this opportunity and scheduled your appointment today!
-
2024-01-22historical Active Under Contract 199-char remark
Show marketing remark (199 chars)
Property located in the Westside of South Bend close to restaurants, Grocery Stores, Schools, Churches, Gas Stations and much more! Do not miss this opportunity and scheduled your appointment today!
-
2024-01-22price $142,900 199-char remark
Show marketing remark (199 chars)
Property located in the Westside of South Bend close to restaurants, Grocery Stores, Schools, Churches, Gas Stations and much more! Do not miss this opportunity and scheduled your appointment today!
-
2024-01-11status Pending 199-char remark
Show marketing remark (199 chars)
Property located in the Westside of South Bend close to restaurants, Grocery Stores, Schools, Churches, Gas Stations and much more! Do not miss this opportunity and scheduled your appointment today!
-
2023-12-16historical Active Under Contract 199-char remark
Show marketing remark (199 chars)
Property located in the Westside of South Bend close to restaurants, Grocery Stores, Schools, Churches, Gas Stations and much more! Do not miss this opportunity and scheduled your appointment today!
-
2023-12-08price $137,900 199-char remark
Show marketing remark (199 chars)
Property located in the Westside of South Bend close to restaurants, Grocery Stores, Schools, Churches, Gas Stations and much more! Do not miss this opportunity and scheduled your appointment today!
-
2023-11-07$142,900 Active 199-char remark
Show marketing remark (199 chars)
Property located in the Westside of South Bend close to restaurants, Grocery Stores, Schools, Churches, Gas Stations and much more! Do not miss this opportunity and scheduled your appointment today!
-
2016-10-14soldstatus $22,000
Show marketing remark (152 chars)
This 2 story 3 bedroom home has a large eat-in-kitchen, formal dining room, enclosed front porch, enclosed back porch and a newer 2 car detached garage.
-
2016-08-31$24,900
Show marketing remark (152 chars)
This 2 story 3 bedroom home has a large eat-in-kitchen, formal dining room, enclosed front porch, enclosed back porch and a newer 2 car detached garage.
ⓘ Source: listings_history table (triggers on properties + properties_extension) + one-shot
backfill from property_details.listing_events for pre-trigger history.
Tax reassessment forecast IN · Partial reset (capped growth)
- Current annual tax
- $1,315 · $110/mo
- Projected year-2 tax
- $1,315 · $110/mo
- Expected delta
- $0/yr ($0/mo · 0.0%)
ⓘ Screening estimate from a state-policy table — verify with the county assessor before closing.
Climate risk First Street
- Flood 1/10 Low FEMA zone X (unshaded) · 0% chance over 30 yrs
- Wildfire 1/10 Low
- Heat 3/10 Moderate 7 d/yr ≥99°F today · 16 d/yr by 30 yrs out
- Wind 2/10 Low
- Air quality 3/10 Moderate 3 unhealthy d/yr today · 3 by 30 yrs out
Nearby sold comps map
Loading sold comps map…
Walkable amenities ~0.75 mi
Loading nearby amenities…
Taxation est. · year 1
- Rental income
- $17,376
- − Mortgage interest
- −$7,310
- − Property taxes
- −$1,315
- − Insurance
- −$652
- − Repairs & maintenance
- −$1,390
- − Management
- −$1,390
- − Depreciation
- −$3,796
- Taxable income
- $1,522
- Est. tax owed @ 24.0%
- −$365
- After-tax cash flow
- $3,182/yr
For passive investors: Depreciation is non-cash, so a rental often shows a tax loss while cash-flowing — sheltering income. Rental losses are passive: they offset passive income freely, and up to $25,000/yr can offset ordinary (W-2) income if you actively participate and your MAGI is under $100k (phasing out to $0 by $150k); unused losses carry forward. On sale, claimed depreciation is recaptured at up to 25%, and gains may owe capital-gains tax (a 1031 exchange can defer both). Figures are a year-1 estimate at your 24.0% rate — not tax advice; consult a CPA.
Schools (NCES district)
- District
- South Bend Community School Corporation
- NCES district ID
- 1810290
- Math proficiency
- 12% ▼ -10.00%
- Reading proficiency
- 21% ▼ -6.00%
- Median HH income
- $41,935
- Composite
- 14.21/100
- National rank
- #9452
- State rank
- #284 of 301 in IN
Livability — South Bend
- Score
- 64/100
- State rank
- #365
- US rank
- #13730
Category grades
Schools grade is shown separately in the Schools card above.
Census & demographics
- Census place
- South Bend, IN
- City population
- 99,767
- Population (ZIP)
- 21,179
Population outlook (St. Joseph County) Hauer SSP2
- Today (2025)
- 273,186 people
- By 2030
- 273,594 · +0.1%
- By 2040
- 271,641 · -0.6%
- By 2050
- 269,187 · -1.5%
- By 2075
- 263,136 · -3.7%
- By 2100
- 245,659 · -10.1%
Race, ethnicity, and origin ACS 2023
- Neighborhood character
- Diverse neighborhood (Simpson 0.67)
- Race & ethnicity
- White 40% Hispanic / Latino 37% Black 19% Two or more races 19%
- Hispanic origin (detail)
- Mexican 32% Puerto Rican 1%
- Common ancestry
- Romanian 12% English 1% Slovak 1%
- Foreign-born
- 13% · Canada, Jamaica
- Languages at home
- 69% English-only · Spanish 30% Russian/Polish/Slavic 1%
Political lean MEDSL · St. Joseph
- 2024 margin
- Toss-up / Even · D 50.0% · R 48.5% · Other 1.5%
- 2008→2024 swing
- -15.6pp toward R · 2008: 17.1pp · 2024: 1.5pp
- All cycles
- 2024: D+1.5 2020: D+5.8 2016: D+0.2 2012: D+3.5 2008: D+17.1
Not yet ingested
- Civics
- —
Market trends
- HPI YoY
- ▼ -95.16%
- Current HPI
- 223.6464
- Rent YoY
- —
- Metro
- —
- State GDP YoY
- ▲ 2.90%
- F500 in state
- 18
Industry mix (Fortune 500 HQ in IN)
| Industry | F500 HQs | Revenue |
|---|---|---|
| Industrial Machinery | 2 | $37B |
|
||
| Healthcare | 1 | $177B |
|
||
| Pharmaceuticals | 1 | $45B |
|
||
| Metals / Steel | 1 | $18B |
|
||
| Agriculture | 1 | $17B |
|
||
| Packaging | 1 | $12B |
|
||
Price history
+424.1% since first listed12 events — show timeline
- 2026-05-26 Pending — NIRA MLS as Distributed by MLS Grid
- 2026-05-08 Listed $130,500 NIRA MLS as Distributed by MLS Grid
- 2024-02-16 Sold (MLS) $145,500 IRMLS
- 2024-02-10 Pending — IRMLS
- 2024-01-22 Contingent — IRMLS
- 2024-01-22 Price Changed $142,900 IRMLS
- 2024-01-11 Pending — IRMLS
- 2023-12-16 Contingent — IRMLS
- 2023-12-08 Price Changed $137,900 IRMLS
- 2023-11-07 Listed $142,900 IRMLS
- 2016-10-14 Sold (MLS) $22,000 IRMLS
- 2016-08-31 Listed $24,900 IRMLS
Property tax history
+50.6%/yrLatest (2025): $1,315 · +13.2% YoY. Source: county tax records.
Cash-flow waterfall
monthlySold comps — $/sqft
last 12 mo · ≤1 miLoading sold comps…