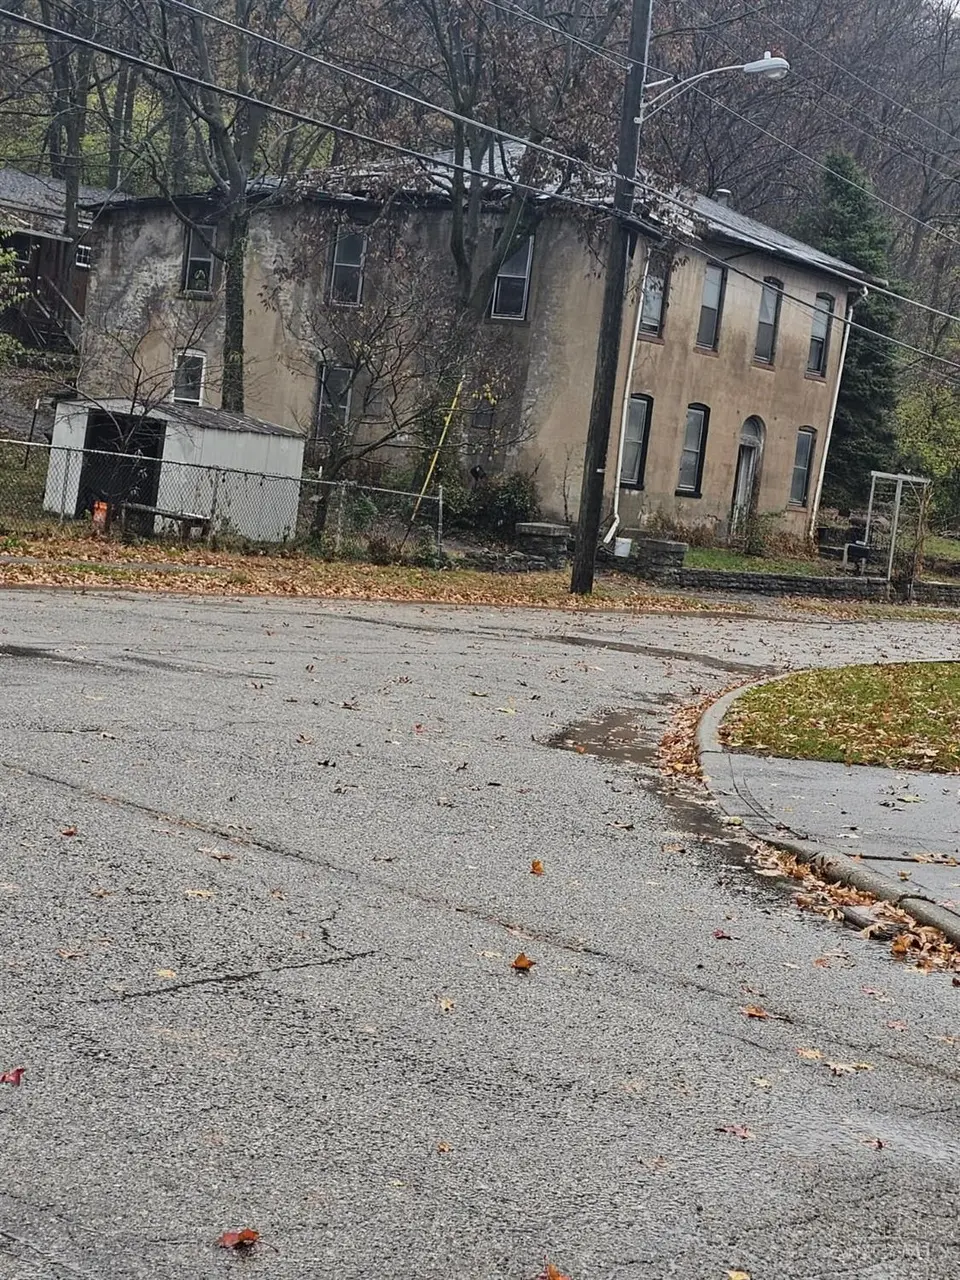
3888 River Rd · Cincinnati, OH
Flood risk 9/10 · Severe
- FEMA flood zone
- X (shaded)
- Chance of flooding over 30 yrs
- 0.98%
- Est. flood insurance / yr
- $507 – $1,088
Fire risk 1/10 · Minimal
- Est. fire insurance / yr
- $713 – $1,323
Heat risk 5/10 · Moderate
- Hot days now (above 102°F)
- 7 days/yr
- Hot days in 30 yrs
- 20 days/yr
Wind risk 2/10 · Minimal
- Chance of severe wind over 30 yrs
- 1.0%
Air-quality risk 3/10 · Minor
- Unhealthy air days now
- 3 days/yr
- Unhealthy air days in 30 yrs
- 5 days/yr
Risk factors via First Street. Map © Google.
Why this score? — see what drove the B- grade
The composite is a weighted blend of 9 inputs, each scored 0–100. Each bar is that input's sub-score; the figure is the points it added to the 100-point composite (weight × sub-score).
- Cash flow +30.0/30.0
- 1% rule +10.0/10.0
- DSCR +10.0/10.0
- ARV discount +7.5/15.0
- Livability +4.0/5.0
- Rent growth +2.5/5.0
- Schools +2.5/10.0
- Condition / age +2.5/5.0
- Appreciation +0.0/10.0
$55,000
🖨 Deal sheet 📄 Offer letter ✓ Due diligence
Listing remarks MLS
Second Dwelling on Property Included. Second Dwelling is 783 SqFt. with 2 BD 1BA. Ready for Rehab!
Key facts
- 0.39 acre lot
- Built 1880
- Listed 49 days
Property features AI
Finance
- Other: Lot is approximately 0.387 acre (about 119.4 x 124); Second floor area recorded separately
- HOA & community: No HOA
Exterior
- Utilities: Public water; Public sewer
- Home design: Single-family home; Two levels; Poured foundation
- Construction: Built with brick construction
- Exterior features: Shingle roof; Brick exterior; Windows with unspecified/other features; Residential zoning
Interior
- Kitchen: Kitchen present (details not specified)
- Bedrooms: Three bedrooms, all on the first level
- Bathrooms: Two full bathrooms and one half bathroom; Primary bathroom listed as 'Other' (unspecified features)
- Heating & cooling: Baseboard heating; Gas water heating
- Interior features: Full basement
Neighborhood map
What this means for you Summary
Snapshot
- This is a 3-bed/1.0-bath single-family listed at $55k.
Deal economics
- At list price, monthly cash flow is $537 ($6k/yr) — positive.
- The deal already cash-flows at list — no discount required.
- Meets the 1% rule at list price ($1k rent vs $55k).
- Recommended offer: $53k (3.0% below list) — sets the bar for market timing.
- Cap rate 19.5% vs local median 3.9% in Cincinnati — top-decile yield for the area; either an underpriced asset or a hidden risk that comps aren't pricing in. Stress-test before assuming the spread holds.
Location & tenants
- Location reads 80/100 on livability (#130 in OH, #1,856 nationally) — a professional / high-income tenant draw. Strengths: amenities A+, commute A+, cost of living A+; Watch: employment D, crime F.
- Cincinnati Public Schools (urban): math 25% / reading 36% proficiency, ranked #581 of 656 in OH (top 89%) — families likely to look elsewhere, expect single-tenant / working-renter base with shorter leases; 70% free/reduced lunch — lower-income household profile, screen leases tightly.
- Market conditions: 33 active listings in the ZIP; 3 comparable units currently listed for rent nearby; rentals at typical pace (median 24d on market — plan ~3-4 weeks tenant-placement turnaround); lower-income renter base — watch delinquency; 801 units permitted in Hamilton County in 2024 (190 in 5+ unit buildings).
- At $1,398/mo this rent would consume 54% of the median local household income ($31k/yr) (locally 487% of renters already pay >50% of income on rent) — very limited rent-growth headroom before tenants either downsize or default.
Forward outlook
- Local home prices are declining (-3.0%/yr); year-one equity from $380 of loan paydown is wiped out by about $2k of value loss. Plan a longer hold.
- At projected returns (-3.0% appreciation + 3.0% rent growth), your $15k cash investment doubles in ~3 years — after that, you're playing with house money.
Negotiation context
- It's been on market 49 days — a 3% lower offer ($53k) is reasonable based on typical stale-listing flexibility.
- 2 sale attempts since 10y ago; this cycle's ask has dropped $10k (15%) from the opening price — seller is motivated, your offer sets the floor, not the list.
- Current owner paid $22k; list at $55k implies a 150% gain — meaningful room to come down on a strong offer.
Risks & watch-outs
- Watch-outs: property tax is 4.1% of price; flood insurance adds $66/mo; built in 1880 — expect roof / HVAC / electrical / plumbing capex.
- Climate carrying-cost: severe flood risk; extreme-heat days projected 7→20/yr by 2055 (HVAC capex compounding) — expect insurance premiums to compound above CPI over the hold.
Questions for the listing agent
- It's been on market 49 days. Have you received any prior offers? Is the seller open to a 3% concession, seller financing, or rate buy-down credit?
- Built in 1880 — when were the roof, HVAC, electrical panel, plumbing, and water heater last replaced?
- Property tax is high relative to price — has the assessment been appealed recently, and will the sale trigger a re-assessment?
- What's the actual annual flood-insurance premium (NFIP or private), and is the property in a SFHA with mandatory coverage?
- Is there a deadline driving the sale (1031 exchange, divorce, estate, relocation)? That informs how much negotiation room exists.
- Schools are B-rated — typically a magnet for longer-tenancy family renters. What's the average tenant stay here, and is there a school-zone premium baked into asking?
- Crime grade is F in this area — have there been break-ins, vandalism, or insurance claims at this property in the last 3 years? What carrier currently insures it and at what premium?
- What's the average days-on-market for RENTAL listings here right now (not sales)? A rising rental-DOM trend means longer vacancies and softer asking-rent achievability than the comps imply.
- What's the recent tenant-quality profile in this submarket — average credit score on applications, eviction rate, late-payment / NSF rate, and stable-employment percentage? A property-management company in the area should have these aggregated.
- How much new for-sale + rental construction is in the pipeline within 1–3 miles? Heavy new supply typically softens prices + rents 12–24 months out; constrained supply supports both.
Investment metrics
- 1% rule
- 2.54% ✓
- Cap rate
- 19.46%
- Cash-on-cash
- 47.01%
- DSCR
- 3.09
- GRM
- 3.3
CMA / ARV
No comps found within radius.
Projected returns pro-forma
-3.0% appreciation · 3.0% rent growth · sell at horizon
- IRR
- 38.6%
- Equity multiple
- 2.65×
- Total profit
- $25,416
- Equity at exit
- $8,201
- IRR
- 45.1%
- Equity multiple
- 5.33×
- Total profit
- $66,714
- Equity at exit
- $4,755
Cash invested: $15,400 (down + closing). Projections, not guarantees.
Landlord ↔ Tenant lean methodology
- Overall (STATE)
- 73 Landlord-Friendly
- State Ohio
- 73 Landlord-Friendly · R+6
- County
- — inherits STATE
- City
- — inherits STATE
ZIP-level market 45204
- Home prices YoY
- -21.2%
- Active inventory
- 33
- Price-to-rent
- 3.3×
Monthly cashflow live
- Estimated rent
- $1,398 medium interval (Pro) →
- Mortgage (P&I)
- −$288
- Tax from tax record
- −$190 /mo · $2,276/yr
- Insurance
- −$23
- Flood insurance flood zone
- −$66 /mo · $798/yr
- HOA
- −$0
- Vacancy / Maint / Mgmt
- −$294
- Net cashflow
- $537
Break-even live
UW: 25.0% down · 7.5% · 30yr · 1.5% tax · 5.0% vac · 8.0% maint · 8.0% mgmt
Financing live
Cash to close
- Down payment
- $13,750
- Closing costs
- $1,650
- Reserves months
- —
- Total cash needed
- —
Loan-product check · same deal, 3 products live
Conventional
25% down · 7.5% · 30yr
- Down + closing
- —
- Monthly P&I
- —
- Monthly cashflow
- —
- DSCR
- —
- Eligible?
- —
Personal DTI + credit; lowest rate.
DSCR
20% down · 8.5% · 30yr
- Down + closing
- —
- Monthly P&I
- —
- Monthly cashflow
- —
- DSCR
- —
- Eligible?
- —
No personal income docs; deal must DSCR.
Hard money
10% down · 12.0% · 12mo
- Down + closing
- —
- Monthly P&I
- —
- Monthly cashflow
- —
- DSCR
- —
- Eligible?
- —
Short-term bridge; refi at stabilization.
Rent comps 3 comps
| Address | Beds | Baths | Sqft | Rent | $/sqft | DOM | Units | Dist |
|---|---|---|---|---|---|---|---|---|
| 5039 Delhi Rd Cincinnati, OH | 1.0–2.0 | 1.0–2.0 | 952 | $1,895 | $1.99 | 1d | 10 | 1.25mi |
| 3338 Hillside Ave Cincinnati, OH | 1.0–2.0 | 1.0 | 725 | $995 | $1.37 | 23d | 1 | 1.28mi |
| 466 Pedretti Ave Unit 472-10 Cincinnati, OH | 2.0 | 1.0 | 750 | $1,100 | $1.47 | 23d | 1 | 1.49mi |
Listing history 17 events
-
2026-06-18days on market $55,000 Active 49 DOM
-
2026-06-17days on market $55,000 Active 48 DOM
-
2026-06-16days on market $55,000 Active 47 DOM
-
2026-06-15days on market $55,000 Active 46 DOM
-
2026-06-13days on market $55,000 Active 44 DOM
-
2026-06-13days on market $55,000 Active 43 DOM
-
2026-06-09days on market $55,000 Active 40 DOM
-
2026-06-08days on market $55,000 Active 39 DOM
-
2026-06-07days on market $55,000 Active 38 DOM
-
2026-06-03days on market $55,000 Active 34 DOM
-
2026-06-02days on market $55,000 Active 33 DOM
-
2026-06-01days on market $55,000 Active 32 DOM
-
2026-05-31days on market $55,000 Active 31 DOM
-
2026-04-30$65,000 Active
-
2016-04-28soldstatus $22,000 Sold 98-char remark
Show marketing remark (98 chars)
Second Dwelling on Property Included. Second Dwelling is 783 SqFt. with 2 BD 1BA. Ready for Rehab!
-
2016-04-27historical Accept Backup Offers 98-char remark
Show marketing remark (98 chars)
Second Dwelling on Property Included. Second Dwelling is 783 SqFt. with 2 BD 1BA. Ready for Rehab!
-
2016-03-04$29,900 Active 98-char remark
Show marketing remark (98 chars)
Second Dwelling on Property Included. Second Dwelling is 783 SqFt. with 2 BD 1BA. Ready for Rehab!
ⓘ Source: listings_history table (triggers on properties + properties_extension) + one-shot
backfill from property_details.listing_events for pre-trigger history.
Tax reassessment forecast OH · Partial reset (capped growth)
- Current annual tax
- $2,276 · $190/mo
- Projected year-2 tax
- $2,276 · $190/mo
- Expected delta
- $0/yr ($0/mo · 0.0%)
ⓘ Screening estimate from a state-policy table — verify with the county assessor before closing.
Climate risk First Street
- Flood 9/10 Extreme FEMA zone X (shaded) · 98% chance over 30 yrs
- Wildfire 1/10 Low
- Heat 5/10 Major 7 d/yr ≥102°F today · 20 d/yr by 30 yrs out
- Wind 2/10 Low 100% chance of damaging wind over 30 yrs
- Air quality 3/10 Moderate 3 unhealthy d/yr today · 5 by 30 yrs out
Nearby sold comps map
Loading sold comps map…
Walkable amenities ~0.75 mi
Loading nearby amenities…
Taxation est. · year 1
- Rental income
- $16,775
- − Mortgage interest
- −$3,081
- − Property taxes
- −$2,276
- − Insurance
- −$1,072
- − Repairs & maintenance
- −$1,342
- − Management
- −$1,342
- − Depreciation
- −$1,600
- Taxable income
- $6,061
- Est. tax owed @ 24.0%
- −$1,455
- After-tax cash flow
- $4,988/yr
For passive investors: Depreciation is non-cash, so a rental often shows a tax loss while cash-flowing — sheltering income. Rental losses are passive: they offset passive income freely, and up to $25,000/yr can offset ordinary (W-2) income if you actively participate and your MAGI is under $100k (phasing out to $0 by $150k); unused losses carry forward. On sale, claimed depreciation is recaptured at up to 25%, and gains may owe capital-gains tax (a 1031 exchange can defer both). Figures are a year-1 estimate at your 24.0% rate — not tax advice; consult a CPA.
Schools (NCES district)
- District
- Cincinnati Public Schools
- NCES district ID
- 3904375
- Math proficiency
- 25% ▼ -19.00%
- Reading proficiency
- 36% ▼ -14.00%
- Median HH income
- $35,743
- Composite
- 25.21/100
- National rank
- #7508
- State rank
- #581 of 656 in OH
Livability — Cincinnati
- Score
- 80/100
- State rank
- #130
- US rank
- #1856
Category grades
Schools grade is shown separately in the Schools card above.
Census & demographics
- Census place
- Cincinnati, OH
- County
- Hamilton County · 701,295 people
- City population
- 505,555
- Metro
- Cincinnati, OH-KY-IN
- Population (ZIP)
- 8,412
- Household income
- $31,236
- Rent vs Own
- Severe rent burden
- 487.0
Population outlook (Hamilton County) Hauer SSP2
- Today (2025)
- 826,054 people
- By 2030
- 830,947 · +0.6%
- By 2040
- 832,319 · +0.8%
- By 2050
- 822,428 · -0.4%
- By 2075
- 788,688 · -4.5%
- By 2100
- 710,674 · -14.0%
Race, ethnicity, and origin ACS 2023
- Neighborhood character
- Diverse neighborhood (Simpson 0.64)
- Race & ethnicity
- White 44% Black 41% Two or more races 13% Hispanic / Latino 2%
- Common ancestry
- Slovak 1% Lithuanian 1% Italian 1%
- Foreign-born
- 3% · Canada
- Languages at home
- 94% English-only · Spanish 3% Other Indo-European 2% Other Asian/Pacific 1%
Political lean MEDSL · Hamilton
- 2024 margin
- D (+14.9) · D 57.0% · R 42.1%
- 2008→2024 swing
- +7.9pp toward D · 2008: 7.0pp · 2024: 14.9pp
- All cycles
- 2024: D+14.9 2020: D+15.9 2016: D+9.5 2012: D+4.9 2008: D+7.0
Not yet ingested
- Civics
- —
Market trends
- HPI YoY
- ▼ -43.12%
- Current HPI
- 160.5953
- Rent YoY
- —
- Metro
- Cincinnati, OH-KY-IN
- State GDP YoY
- ▲ 1.98%
- F500 in state
- 48
Industry mix (Fortune 500 HQ in OH)
| Industry | F500 HQs | Revenue |
|---|---|---|
| Insurance | 3 | $145B |
|
||
| Industrial Machinery | 3 | $49B |
|
||
| Financial Services | 3 | $24B |
|
||
| Consumer Goods | 2 | $93B |
|
||
| Aerospace / Defense | 2 | $47B |
|
||
| Utilities | 2 | $33B |
|
||
Price history
+117.4% since first listed4 events — show timeline
- 2026-04-30 Listed $65,000 Cincy MLS
- 2016-04-28 Sold (MLS) $22,000 Cincy MLS
- 2016-04-27 Contingent — Cincy MLS
- 2016-03-04 Listed $29,900 Cincy MLS
Property tax history
+1.3%/yrLatest (2025): $2,276 · -1.7% YoY. Source: county tax records.
Cash-flow waterfall
monthlySold comps — $/sqft
last 12 mo · ≤1 miLoading sold comps…