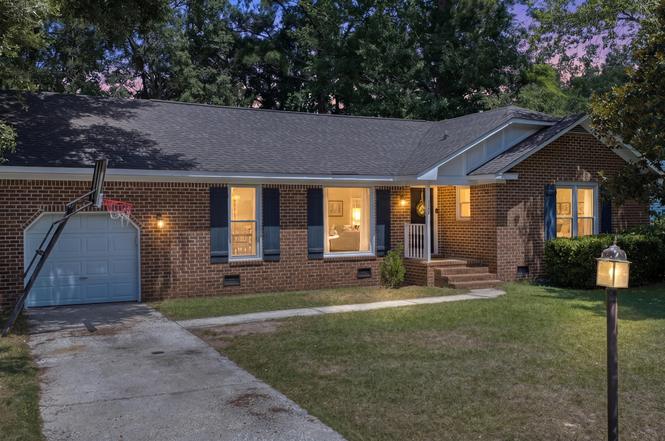
132 Mohican Cir · Summerville, SC
Flood risk 1/10 · Minimal
- FEMA flood zone
- X (unshaded)
- Chance of flooding over 30 yrs
- 0.0%
- Est. flood insurance / yr
- $507 – $1,088
Fire risk 3/10 · Minor
- Est. fire insurance / yr
- $783 – $1,453
Heat risk 9/10 · Severe
- Hot days now (above 107°F)
- 7 days/yr
- Hot days in 30 yrs
- 17 days/yr
Wind risk 8/10 · Major
- Chance of severe wind over 30 yrs
- 97.0%
Air-quality risk 3/10 · Minor
- Unhealthy air days now
- 3 days/yr
- Unhealthy air days in 30 yrs
- 3 days/yr
Risk factors via First Street. Map © Google.
Why this score? — see what drove the D grade
The composite is a weighted blend of 9 inputs, each scored 0–100. Each bar is that input's sub-score; the figure is the points it added to the 100-point composite (weight × sub-score).
- Cash flow +13.3/30.0
- ARV discount +11.4/15.0
- Schools +4.1/10.0
- DSCR +4.0/10.0
- Livability +3.2/5.0
- Rent growth +2.9/5.0
- 1% rule +2.6/10.0
- Condition / age +2.5/5.0
- Appreciation +0.0/10.0
$285,000
🖨 Deal sheet (PDF) 📄 Offer letter ✓ Due diligence
Listing remarks MLS
GREAT DEAL ON THIS PROPERTY!!! FORMAL ROOMS, DEN W/FP/,GARAGE, PRIVACY FENCE.VERY WELL MAINTAINED, LOTS OF CURB APPEAL!! QUIET NEIGHBORHOOD. EXCELLENT NEIGHBORS. SUPER SCHOOLS. LOTS OF HOUSE FOR THE MONEY. SKYLIGHTS MAKE DEN LIGHT & AIRY. NEW roof 2013 and NEW HVAC INCLUDING DUCTWORK 2013!!!AGE, SQFT, & LTZ APPROX. GREAT AREA FOR THE FAMILY!!!
Key facts
- Attached frog
- No hoa
- 0.23 acre lot
Tags
Property features AI
Exterior
- Parking: Attached 1-car garage; Off-street parking
- Utilities: Public sewer
- Home design: Single-family detached home; One and one-half stories
- Construction: Architectural asphalt roof; Fee simple ownership
- Exterior features: Wooden enclosed fence; Level lot (0 - 0.5 acre)
Interior
- Kitchen: Dishwasher; Garbage disposal
- Bedrooms: 3 bedrooms
- Flooring: Carpet; Ceramic tile; Luxury vinyl
- Bathrooms: 2 bathrooms
- Heating & cooling: Electric heating; Heat pump
- Interior features: Cathedral/vaulted ceilings; Walk-in closet(s); Ceiling fan(s); Eat-in kitchen; Family room; Formal living room; Attached finished room (FROG); Separate dining room
- Laundry & utility: Laundry room with washer and electric dryer hookups
Neighborhood map
What this means for you Summary
Snapshot
- This is a 3-bed/2.0-bath single-family listed at $285k.
Deal economics
- At list price, monthly cash flow is $2 ($28/yr) — positive.
- The deal already cash-flows at list — no discount required.
- To meet the 1% rule (rent ≥ 1% of price), the offer needs to be $216k (24.1% below list).
- Recommended offer: $216k (24.1% below list) — sets the bar for 1% rule.
- Cap rate 6.3% vs local median 4.0% in Summerville — top-decile yield for the area; either an underpriced asset or a hidden risk that comps aren't pricing in. Stress-test before assuming the spread holds.
Location & tenants
- Location reads 63/100 on livability (#167 in SC) — a middle-class / working-renter tenant base. Strengths: housing A+, cost of living B+; Watch: amenities F, commute F, health & safety F.
- Dorchester 02 (suburban): math 40% / reading 55% proficiency, ranked #12 of 80 in SC (top 15%) — families likely to look elsewhere, expect single-tenant / working-renter base with shorter leases.
- Zoned schools: Newington Elementary (math 42% / reading 48%, grade D-, #224 of 597 statewide, top 38%, 758 students, 81% FRL); Gregg Middle (math 28% / reading 45%, grade F, #98 of 229 statewide, top 43%, 850 students, 76% FRL); Summerville High (math 60% / reading 92%, grade A-, #34 of 196 statewide, top 17%, 3,308 students, 59% FRL) — zoned schools average 72% FRL vs 36% district-wide (36 pts higher); higher-poverty schools than district average — tighter screening recommended.
- Market conditions: Rents rising (+1.4%/yr); 741 active listings in the ZIP; 8 comparable units currently listed for rent nearby; rentals at typical pace (median 25d on market — plan ~3-4 weeks tenant-placement turnaround); solid renter incomes; 1,199 units permitted in Dorchester County in 2024 (0 in 5+ unit buildings).
- This rent runs 30% of the median local income ($86k/yr) — at the standard rent-burdened threshold; future hikes will face affordability resistance.
Forward outlook
- Local home prices are declining (-3.0%/yr); year-one equity from $2k of loan paydown is wiped out by about $9k of value loss. Plan a longer hold.
- Dorchester County population projected at +43% by 2050 — long-run rental-demand tailwind backs the buy-and-hold thesis.
Negotiation context
- Only 3 days on market — expect competitive offers; lowballing is unlikely to land.
- 3 sale attempts since 23y ago with the ask held roughly flat each time — persistent listings suggest the price (not the market) is what's stuck; bring a comps-based counter.
- Current owner paid $125k; list at $285k implies a 128% gain — meaningful room to come down on a strong offer.
Risks & watch-outs
- Climate carrying-cost: severe wind risk, 97% chance of damaging wind over 30y; extreme-heat days projected 7→17/yr by 2055 (HVAC capex compounding) — expect insurance premiums to compound above CPI over the hold.
Questions for the listing agent
- Is there a deadline driving the sale (1031 exchange, divorce, estate, relocation)? That informs how much negotiation room exists.
- Schools are B-rated — typically a magnet for longer-tenancy family renters. What's the average tenant stay here, and is there a school-zone premium baked into asking?
- The area grade is low — what's the realistic commute time and amenity access for the typical tenant pool here? Any planned neighborhood developments (good or bad) we should know about?
- What's the average days-on-market for RENTAL listings here right now (not sales)? A rising rental-DOM trend means longer vacancies and softer asking-rent achievability than the comps imply.
- What's the recent tenant-quality profile in this submarket — average credit score on applications, eviction rate, late-payment / NSF rate, and stable-employment percentage? A property-management company in the area should have these aggregated.
- How much new for-sale + rental construction is in the pipeline within 1–3 miles? Heavy new supply typically softens prices + rents 12–24 months out; constrained supply supports both.
Investment metrics
- 1% rule
- 0.76% ✗
- Cap rate
- 6.30%
- Cash-on-cash
- 0.04%
- DSCR
- 1.00
- GRM
- 11.0
CMA / ARV
- ARV (on-the-fly)
- $311,904
- Comps found
- 12
Show comp detail 12 sales within ~0.75 mi
| Address | Dist | Beds/Ba | Sqft | Sold | Price | $/sf | Match |
|---|---|---|---|---|---|---|---|
| 108 Apache Dr | 0.05mi | 3/2.0 | 1,445 (+0%) | 2mo | $325,000 | $225 | 95 |
| 121 Apache Dr | 0.13mi | 3/2.0 | 1,462 (+1%) | 1mo | $310,000 | $212 | 91 |
| 114 Froman Dr | 0.51mi | 3/1.5 | 1,456 (+1%) | 1mo | $202,000 | $139 | 72 |
| 120 Apache Dr | 0.13mi | 4/2.5 (+1) | 1,608 (+11%) | 8mo | $310,000 | $193 | 61 |
| 207 Apache Dr | 0.25mi | 3/2.0 | 1,237 (-14%) | 4mo | $299,000 | $242 | 61 |
| 322 Damascus Dr | 0.51mi | 3/2.0 | 1,342 (-7%) | 4mo | $312,000 | $232 | 61 |
| 170 Danzid Dr | 0.41mi | 3/2.0 | 1,572 (+9%) | 11mo | $334,000 | $212 | 57 |
| 122 Cannonsmill Ln | 0.74mi | 3/2.0 | 1,378 (-5%) | 2mo | $326,000 | $237 | 56 |
| 329 Damascus Dr | 0.48mi | 3/2.0 | 1,298 (-10%) | 6mo | $280,000 | $216 | 55 |
| 115 Cannonsmill Ln | 0.74mi | 3/2.0 | 1,353 (-6%) | 3mo | $288,000 | $213 | 53 |
| 115 Barshay Dr | 0.67mi | 3/1.5 | 1,378 (-5%) | 8mo | $217,000 | $157 | 52 |
| 113 Osprey Ridge Ln | 0.65mi | 3/2.5 | 1,600 (+11%) | 10mo | $350,000 | $219 | 41 |
Match score weights: distance 35% · size 25% · config 20% · recency 20%. Top-matched comps best support the ARV.
Projected returns pro-forma
-3.0% appreciation · 1.45% rent growth · sell at horizon
- IRR
- -17.8%
- Equity multiple
- 0.38×
- Total profit
- $-49,486
- Equity at exit
- $42,494
- IRR
- -12.9%
- Equity multiple
- 0.29×
- Total profit
- $-56,643
- Equity at exit
- $24,642
Cash invested: $79,800 (down + closing). Projections, not guarantees.
Landlord ↔ Tenant lean methodology
- Overall (STATE)
- 90 Strongly Landlord-Friendly
- State South Carolina
- 90 Strongly Landlord-Friendly · R+6
- County
- — inherits STATE
- City
- — inherits STATE
ZIP-level market 29483
- Home prices YoY
- -34.6%
- Rents YoY
- 1.4%
- Active inventory
- 741
- Price-to-rent
- 11.0×
Monthly cashflow live
- Estimated rent
- $2,164 high interval (Pro) →
- Mortgage (P&I)
- −$1,495
- Tax from tax record
- −$94 /mo · $1,129/yr
- Insurance
- −$119
- HOA
- −$0
- Vacancy / Maint / Mgmt
- −$454
- Net cashflow
- $2
Break-even live
Sensitivity live
| Price | -10% $164 | -5% $83 | +0% $2 | +5% $-78 | +10% $-159 |
|---|---|---|---|---|---|
| Rent | -10% $-169 | -5% $-83 | +0% $2 | +5% $88 | +10% $173 |
| Rate | -1.0pp $146 | -0.5pp $75 | base $2 | +0.5pp $-72 | +1.0pp $-147 |
UW: 25.0% down · 7.5% · 30yr · 1.5% tax · 5.0% vac · 8.0% maint · 8.0% mgmt
Financing live
Cash to close
- Down payment
- $71,250
- Closing costs
- $8,550
- Reserves months
- —
- Total cash needed
- —
Loan-product check · same deal, 3 products live
Conventional
25% down · 7.5% · 30yr
- Down + closing
- —
- Monthly P&I
- —
- Monthly cashflow
- —
- DSCR
- —
- Eligible?
- —
Personal DTI + credit; lowest rate.
DSCR
20% down · 8.5% · 30yr
- Down + closing
- —
- Monthly P&I
- —
- Monthly cashflow
- —
- DSCR
- —
- Eligible?
- —
No personal income docs; deal must DSCR.
Hard money
10% down · 12.0% · 12mo
- Down + closing
- —
- Monthly P&I
- —
- Monthly cashflow
- —
- DSCR
- —
- Eligible?
- —
Short-term bridge; refi at stabilization.
Rent comps 8 comps
| Address | Beds | Baths | Sqft | Rent | $/sqft | DOM | Units | Dist |
|---|---|---|---|---|---|---|---|---|
| 153 Omalley Dr Summerville, SC | 3.0 | 3.0 | 1760 | $2,290 | $1.30 | 24d | 1 | 0.87mi |
| 133 Cableswynd Way Summerville, SC | 3.0 | 2.0 | 1405 | $2,200 | $1.57 | 24d | 1 | 0.89mi |
| 207 Ruth Anne Dr Summerville, SC | 3.0 | 1.0 | 1000 | $1,600 | $1.60 | 20d | 1 | 1.05mi |
| 409 Verbena Ave Summerville, SC | 3.0 | 2.5 | 1301 | $1,950 | $1.50 | 24d | 1 | 1.18mi |
| 1005 Sonoran Cir Summerville, SC | 1.0–3.0 | 1.0–2.0 | 989 | $2,087 | $2.11 | 3d | 19 | 1.24mi |
| 10825 Dorchester Rd Summerville, SC | 1.0–3.0 | 1.0–2.0 | 1068 | $1,832 | $1.72 | 3d | 14 | 1.28mi |
| 157 Cantona Dr Summerville, SC | 3.0 | 2.5 | 1737 | $2,300 | $1.32 | 24d | 1 | 1.29mi |
| 319 Pimpernel St Summerville, SC | 3.0 | 2.5 | 1660 | $2,400 | $1.45 | 3d | 1 | 1.47mi |
Listing history 4 events
-
2026-06-18days on market $285,000 Active 3 DOM
-
2026-06-17days on market $285,000 Active 2 DOM
-
2026-06-15remarks 699-char remark
-
2026-06-15$285,000 Active 1 DOM
ⓘ Source: listings_history table (triggers on properties + properties_extension) + one-shot
backfill from property_details.listing_events for pre-trigger history.
Tax reassessment forecast SC · Resets to sale price
- Current annual tax
- $1,129 · $94/mo
- Projected year-2 tax
- $1,624 · $135/mo
- Expected delta
- +$496/yr (+$41/mo · 43.9%)
ⓘ Screening estimate from a state-policy table — verify with the county assessor before closing.
Climate risk First Street
- Flood 1/10 Low FEMA zone X (unshaded) · 0% chance over 30 yrs
- Wildfire 3/10 Moderate
- Heat 9/10 Extreme 7 d/yr ≥107°F today · 17 d/yr by 30 yrs out
- Wind 8/10 Severe 97% chance of damaging wind over 30 yrs
- Air quality 3/10 Moderate 3 unhealthy d/yr today · 3 by 30 yrs out
Nearby sold comps map
Loading sold comps map…
Walkable amenities ~0.75 mi
Loading nearby amenities…
Taxation est. · year 1
- Rental income
- $25,970
- − Mortgage interest
- −$15,964
- − Property taxes
- −$1,129
- − Insurance
- −$1,425
- − Repairs & maintenance
- −$2,078
- − Management
- −$2,078
- − Depreciation
- −$8,291
- Taxable loss
- −$4,994
- Est. tax savings @ 24.0%
- +$1,199
- After-tax cash flow
- $1,227/yr
For passive investors: Depreciation is non-cash, so a rental often shows a tax loss while cash-flowing — sheltering income. Rental losses are passive: they offset passive income freely, and up to $25,000/yr can offset ordinary (W-2) income if you actively participate and your MAGI is under $100k (phasing out to $0 by $150k); unused losses carry forward. On sale, claimed depreciation is recaptured at up to 25%, and gains may owe capital-gains tax (a 1031 exchange can defer both). Figures are a year-1 estimate at your 24.0% rate — not tax advice; consult a CPA.
Schools (NCES district)
- District
- Dorchester 02
- NCES district ID
- 4502010
- Math proficiency
- 40% ▼ -13.00%
- Reading proficiency
- 55% ▼ -4.00%
- Median HH income
- $57,937
- Composite
- 41.41/100
- National rank
- #3475
- State rank
- #12 of 80 in SC
Livability — Summerville
- Score
- 63/100
- State rank
- #167
- US rank
- #15058
Category grades
Schools grade is shown separately in the Schools card above.
Census & demographics
- County
- Dorchester County · 182,866 people
- City population
- 171,668
- Metro
- Charleston-North Charleston, SC
- Population (ZIP)
- 59,186
- Household income
- $85,750
- Rent vs Own
- Severe rent burden
- 1309.0
Population outlook (Dorchester County) Hauer SSP2
- Today (2025)
- 186,982 people
- By 2030
- 203,967 · +9.1%
- By 2040
- 237,160 · +26.8%
- By 2050
- 267,479 · +43.1%
- By 2075
- 333,025 · +78.1%
- By 2100
- 366,560 · +96.0%
Race, ethnicity, and origin ACS 2023
- Neighborhood character
- Predominantly White (68%)
- Race & ethnicity
- White 68% Black 19% Hispanic / Latino 7% Two or more races 6% Asian 1%
- Hispanic origin (detail)
- Mexican 3% Puerto Rican 1%
- Common ancestry
- Slovak 3% Lithuanian 3% Romanian 3%
- Foreign-born
- 5% · Canada
- Languages at home
- 93% English-only · Spanish 4%
Political lean MEDSL · Dorchester
- 2024 margin
- R (+14.6) · D 41.8% · R 56.4% · Other 1.9%
- 2008→2024 swing
- +0.9pp no change · 2008: -15.5pp · 2024: -14.6pp
- All cycles
- 2024: R+14.6 2020: R+10.5 2016: R+17.5 2012: R+16.0 2008: R+15.5
Not yet ingested
- Civics
- —
Market trends
- HPI YoY
- ▼ -131.42%
- Current HPI
- 248.8406
- Rent YoY
- ▲ 1.45%
- Metro
- Charleston-North Charleston, SC
- State GDP YoY
- ▲ 4.51%
- F500 in state
- 2
Industry mix (Fortune 500 HQ in SC)
| Industry | F500 HQs | Revenue |
|---|---|---|
| Packaging | 1 | $7B |
|
||
Price history
+258.5% since first listed10 events — show timeline
- 2026-06-15 Listed $285,000 Charleston Trident MLS
- 2015-08-28 Sold (Public Records) $125,000 Public Records
- 2015-08-25 Sold (MLS) $125,000 Charleston Trident MLS
- 2015-06-28 Contingent — Charleston Trident MLS
- 2015-06-16 Price Changed $125,000 Charleston Trident MLS
- 2015-06-02 Price Changed $128,900 Charleston Trident MLS
- 2015-05-14 Listed $129,900 Charleston Trident MLS
- 2004-06-02 Sold (MLS) $123,000 Charleston Trident MLS
- 2003-08-27 Listed $119,900 Charleston Trident MLS
- 1992-09-21 Sold (Public Records) $79,492 Public Records
Property tax history
+2.3%/yrLatest (2025): $1,129 · -0.0% YoY. Source: county tax records.
Cash-flow waterfall
monthlySold comps — $/sqft
last 12 mo · ≤1 miLoading sold comps…