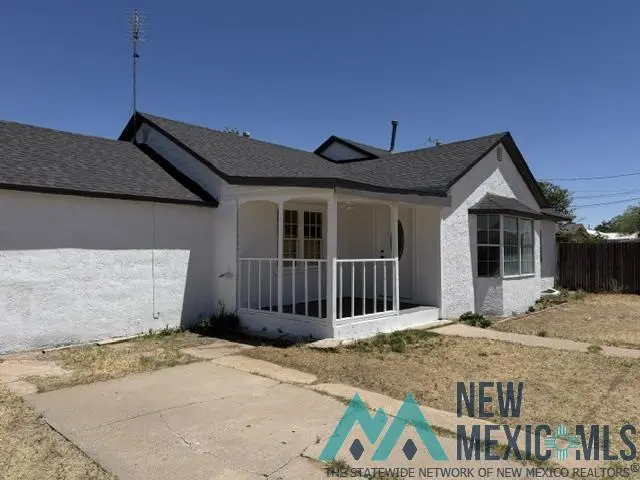
724 W 14th St · Portales, NM
Flood risk 1/10 · Minimal
- FEMA flood zone
- AH
- Chance of flooding over 30 yrs
- 0.0%
- Est. flood insurance / yr
- $1,142 – $2,507
Fire risk 8/10 · Major
- Est. fire insurance / yr
- $706 – $1,312
Heat risk 5/10 · Moderate
- Hot days now (above 98°F)
- 7 days/yr
- Hot days in 30 yrs
- 19 days/yr
Wind risk 2/10 · Minimal
- Chance of severe wind over 30 yrs
- —
Air-quality risk 1/10 · Minimal
- Unhealthy air days now
- 0 days/yr
- Unhealthy air days in 30 yrs
- 0 days/yr
Risk factors via First Street. Map © Google.
Why this score? — see what drove the C+ grade
The composite is a weighted blend of 9 inputs, each scored 0–100. Each bar is that input's sub-score; the figure is the points it added to the 100-point composite (weight × sub-score).
- Cash flow +24.0/30.0
- DSCR +7.7/10.0
- ARV discount +7.5/15.0
- 1% rule +5.5/10.0
- Appreciation +5.0/10.0
- Livability +3.2/5.0
- Schools +3.1/10.0
- Rent growth +2.5/5.0
- Condition / age +2.5/5.0
$124,900
🖨 Deal sheet 📄 Offer letter ✓ Due diligence
Listing remarks MLS
Large 1700+sq ft home on corner lot, updated bathrooms, newer flooring, and lots of light!
Key facts
- 7,500 sq ft lot
- Garage
- Built 1982
Property features AI
Finance
- Other: Lot size about 7,500 sq ft
- Financial info: Details not provided
- HOA & community: Details not provided
Exterior
- Parking: Detached garage (1 covered garage space, 1 total parking space)
- Security: Details not provided
- Utilities: Public water; Natural gas available and connected; Electricity connected; Sewer connected
- Home design: Single-family residence; One level / single story
- Construction: Stucco and wood siding construction; Built details not provided
- Exterior features: Fenced yard; Shingle roof
Interior
- Kitchen: Dishwasher; Microwave; Free-standing range; Refrigerator
- Bedrooms: Details not provided
- Flooring: Carpet; Wood
- Bathrooms: 2 full bathrooms
- Heating & cooling: Forced air heating; Central air conditioning; Ceiling fan(s)
- Interior features: Ceiling fan(s)
- Laundry & utility: Details not provided
Neighborhood map
What this means for you Summary
Snapshot
- This is a 3-bed/2.0-bath other listed at $125k.
Deal economics
- At list price, monthly cash flow is $93 ($1k/yr) — positive.
- The deal already cash-flows at list — no discount required.
- Meets the 1% rule at list price ($1k rent vs $125k).
Location & tenants
- Location reads 64/100 on livability (#63 in NM) — a middle-class / working-renter tenant base. Strengths: cost of living A+, health & safety A+, housing A-; Watch: crime F, amenities F, commute F.
- Portales Municipal Schools (town): math 17% / reading 57% proficiency, ranked #15 of 29 in NM (top 52%) — families likely to look elsewhere, expect single-tenant / working-renter base with shorter leases; 62% free/reduced lunch — lower-income household profile, screen leases tightly.
- Zoned schools: Portales Jr High (math 11% / reading 56%, grade F, #9 of 27 statewide, top 31%, 408 students, 60% FRL); Portales High (math 22% / reading 37%, grade F, #78 of 110 statewide, top 74%, 807 students, 59% FRL) — zoned schools at 59% FRL track the district average.
- Market conditions: 8 active listings in the ZIP; 4 comparable units currently listed for rent nearby; rentals lingering (median 44d on market — plan ~5-8 weeks vacancy on turnover, expect pricing pressure); 100% of comp listings sitting > 30 days — soft ceiling on asking rent; 31 units permitted in Roosevelt County in 2024 (0 in 5+ unit buildings).
Forward outlook
- In year one you build about $5k of equity ($864 loan paydown + $4k appreciation (3.0% local appreciation)).
- Roosevelt County population projected at -28% by 2050 — secular population decline; favor cash flow + early exit over multi-decade hold.
- At projected returns (3.0% appreciation + 3.0% rent growth), your $35k cash investment doubles in ~6 years — after that, you're playing with house money.
- By year 8, paydown + projected appreciation supports a ~$34k cash-out refi (75% LTV) — recoverable capital for the next deal without selling this one.
Negotiation context
- Only 14 days on market — expect competitive offers; lowballing is unlikely to land.
- 3 sale attempts; this cycle's ask has dropped $10k (7%) from the opening price — seller is motivated, your offer sets the floor, not the list.
Risks & watch-outs
- Watch-outs: flood insurance adds $152/mo.
- Climate carrying-cost: in FEMA flood zone AH (mandatory federal flood insurance); severe wildfire risk; extreme-heat days projected 7→19/yr by 2055 (HVAC capex compounding) — expect insurance premiums to compound above CPI over the hold.
Questions for the listing agent
- What's the actual annual flood-insurance premium (NFIP or private), and is the property in a SFHA with mandatory coverage?
- Is there a deadline driving the sale (1031 exchange, divorce, estate, relocation)? That informs how much negotiation room exists.
- Schools are F-rated, which usually means shorter tenancies and higher turnover. Who's the typical renter profile here, and what's been the actual vacancy rate?
- Crime grade is F in this area — have there been break-ins, vandalism, or insurance claims at this property in the last 3 years? What carrier currently insures it and at what premium?
- What's the average days-on-market for RENTAL listings here right now (not sales)? A rising rental-DOM trend means longer vacancies and softer asking-rent achievability than the comps imply.
- What's the recent tenant-quality profile in this submarket — average credit score on applications, eviction rate, late-payment / NSF rate, and stable-employment percentage? A property-management company in the area should have these aggregated.
- How much new for-sale + rental construction is in the pipeline within 1–3 miles? Heavy new supply typically softens prices + rents 12–24 months out; constrained supply supports both.
Investment metrics
- 1% rule
- 1.05% ✓
- Cap rate
- 8.65%
- Cash-on-cash
- 8.41%
- DSCR
- 1.37
- GRM
- 7.9
CMA / ARV
No comps found within radius.
Projected returns pro-forma
3.0% appreciation · 3.0% rent growth · sell at horizon
- IRR
- 10.5%
- Equity multiple
- 1.60×
- Total profit
- $21,039
- Equity at exit
- $56,160
- IRR
- 12.8%
- Equity multiple
- 2.91×
- Total profit
- $66,713
- Equity at exit
- $86,550
Cash invested: $34,972 (down + closing). Projections, not guarantees.
Landlord ↔ Tenant lean methodology
- Overall (STATE)
- 55 Moderately Landlord-Leaning
- State New Mexico
- 55 Moderately Landlord-Leaning · D+3
- County
- — inherits STATE
- City
- — inherits STATE
ZIP-level market 88135
- Active inventory
- 8
- Price-to-rent
- 7.9×
Monthly cashflow live
- Estimated rent
- $1,314 medium interval (Pro) →
- Mortgage (P&I)
- −$655
- Tax from tax record
- −$86 /mo · $1,037/yr
- Insurance
- −$52
- Flood insurance flood zone
- −$152 /mo · $1,824/yr
- HOA
- −$0
- Vacancy / Maint / Mgmt
- −$276
- Net cashflow
- $93
Break-even live
UW: 25.0% down · 7.5% · 30yr · 1.5% tax · 5.0% vac · 8.0% maint · 8.0% mgmt
Financing live
Cash to close
- Down payment
- $31,225
- Closing costs
- $3,747
- Reserves months
- —
- Total cash needed
- —
Loan-product check · same deal, 3 products live
Conventional
25% down · 7.5% · 30yr
- Down + closing
- —
- Monthly P&I
- —
- Monthly cashflow
- —
- DSCR
- —
- Eligible?
- —
Personal DTI + credit; lowest rate.
DSCR
20% down · 8.5% · 30yr
- Down + closing
- —
- Monthly P&I
- —
- Monthly cashflow
- —
- DSCR
- —
- Eligible?
- —
No personal income docs; deal must DSCR.
Hard money
10% down · 12.0% · 12mo
- Down + closing
- —
- Monthly P&I
- —
- Monthly cashflow
- —
- DSCR
- —
- Eligible?
- —
Short-term bridge; refi at stabilization.
Rent comps 4 comps
| Address | Beds | Baths | Sqft | Rent | $/sqft | DOM | Units | Dist |
|---|---|---|---|---|---|---|---|---|
| 1700 South Avenue B Unit B Portales, NM | 3.0 | 2.0 | 1706 | $1,800 | $1.06 | 43d | 1 | 0.57mi |
| 312 North Avenue B Portales, NM | 3.0 | 3.0 | 1500 | $1,250 | $0.83 | 43d | 1 | 0.63mi |
| 1802 South Avenue A Unit A Portales, NM | 3.0 | 2.0 | 1570 | $1,150 | $0.73 | 43d | 1 | 0.69mi |
| 506 E 1st St Portales, NM | 3.0 | 1.0 | 1100 | $675 | $0.61 | 44d | 1 | 0.76mi |
Listing history 11 events
-
2026-06-19days on market $124,900 Active 14 DOM
-
2026-06-18days on market $124,900 Active 13 DOM
-
2026-06-17days on market $124,900 Active 12 DOM
-
2026-06-16days on market $124,900 Active 11 DOM
-
2026-06-15days on market $124,900 Active 10 DOM
-
2026-06-14days on market $124,900 Active 8 DOM
-
2026-06-12days on market $124,900 Active 7 DOM
-
2026-06-09days on market $124,900 Active 4 DOM
-
2026-06-08days on market $124,900 Active 3 DOM
-
2026-06-07remarks 184-char remark
-
2026-06-07$124,900 Active 2 DOM
ⓘ Source: listings_history table (triggers on properties + properties_extension) + one-shot
backfill from property_details.listing_events for pre-trigger history.
Tax reassessment forecast NM · Resets to sale price
- Current annual tax
- $1,037 · $86/mo
- Projected year-2 tax
- $1,037 · $86/mo
- Expected delta
- $0/yr ($0/mo · 0.0%)
ⓘ Screening estimate from a state-policy table — verify with the county assessor before closing.
Climate risk First Street
- Flood 1/10 Low FEMA zone AH · 0% chance over 30 yrs
- Wildfire 8/10 Severe
- Heat 5/10 Major 7 d/yr ≥98°F today · 19 d/yr by 30 yrs out
- Wind 2/10 Low
- Air quality 1/10 Low 0 unhealthy d/yr today · 0 by 30 yrs out
Nearby sold comps map
Loading sold comps map…
Walkable amenities ~0.75 mi
Loading nearby amenities…
Taxation est. · year 1
- Rental income
- $15,774
- − Mortgage interest
- −$6,996
- − Property taxes
- −$1,037
- − Insurance
- −$2,449
- − Repairs & maintenance
- −$1,262
- − Management
- −$1,262
- − Depreciation
- −$3,633
- Taxable loss
- −$865
- Est. tax savings @ 24.0%
- +$208
- After-tax cash flow
- $1,324/yr
For passive investors: Depreciation is non-cash, so a rental often shows a tax loss while cash-flowing — sheltering income. Rental losses are passive: they offset passive income freely, and up to $25,000/yr can offset ordinary (W-2) income if you actively participate and your MAGI is under $100k (phasing out to $0 by $150k); unused losses carry forward. On sale, claimed depreciation is recaptured at up to 25%, and gains may owe capital-gains tax (a 1031 exchange can defer both). Figures are a year-1 estimate at your 24.0% rate — not tax advice; consult a CPA.
Schools (NCES district)
- District
- Portales Municipal Schools
- NCES district ID
- 3502100
- Math proficiency
- 17% ▼ -5.00%
- Reading proficiency
- 57% ▲ 20.00%
- Median HH income
- $36,151
- Composite
- 30.52/100
- National rank
- #6209
- State rank
- #15 of 29 in NM
Livability — Portales
- Score
- 64/100
- State rank
- #63
- US rank
- #13640
Category grades
Schools grade is shown separately in the Schools card above.
Census & demographics
- Census place
- Portales, NM
- City population
- 17,842
- Population (ZIP)
- 1,393
Population outlook (Roosevelt County) Hauer SSP2
- Today (2025)
- 16,821 people
- By 2030
- 15,818 · -6.0%
- By 2040
- 13,766 · -18.2%
- By 2050
- 12,152 · -27.8%
- By 2075
- 9,601 · -42.9%
- By 2100
- 8,241 · -51.0%
Race, ethnicity, and origin ACS 2023
- Neighborhood character
- Majority White (59%)
- Race & ethnicity
- White 59% Hispanic / Latino 34% Two or more races 14% Black 4%
- Hispanic origin (detail)
- Mexican 18%
- Common ancestry
- Lithuanian 6% Romanian 3% Serbian 2%
- Foreign-born
- 18% · Canada
- Languages at home
- 70% English-only · Spanish 30%
Political lean MEDSL · Roosevelt
- 2024 margin
- Solid R (+43.2) · D 27.4% · R 70.6% · Other 2.0%
- 2008→2024 swing
- -13.3pp toward R · 2008: -29.9pp · 2024: -43.2pp
- All cycles
- 2024: R+43.2 2020: R+42.9 2016: R+41.3 2012: R+38.9 2008: R+29.9
Not yet ingested
- Civics
- —
Market trends
- HPI YoY
- —
- Current HPI
- —
- Rent YoY
- —
- Metro
- —
- State GDP YoY
- —
- F500 in state
- 0
Price history
-7.5% since first listed16 events — show timeline
- 2026-06-06 Price Changed $124,900 NMMLS
- 2026-06-04 Listed $134,500 NMMLS
- 2025-08-29 Sold (Public Records) — Public Records
- 2025-08-29 Sold (MLS) — NMMLS
- 2025-07-25 Pending — NMMLS
- 2025-07-03 Price Changed $82,620 NMMLS
- 2025-06-19 Price Changed $91,800 NMMLS
- 2025-05-03 Price Changed $114,750 NMMLS
- 2025-05-02 Relisted — NMMLS
- 2025-04-24 Delisted — NMMLS
- 2025-02-19 Pending — NMMLS
- 2025-01-15 Listed $135,000 NMMLS
- 2024-12-10 Sold (Public Records) — Public Records
- 2024-08-14 Sold (Public Records) — Public Records
- 2017-11-30 Sold (Public Records) — Public Records
- 2012-11-01 Sold (Public Records) — Public Records
Property tax history
+6.6%/yrLatest (2025): $1,037 · +30.1% YoY. Source: county tax records.
Cash-flow waterfall
monthlySold comps — $/sqft
last 12 mo · ≤1 miLoading sold comps…