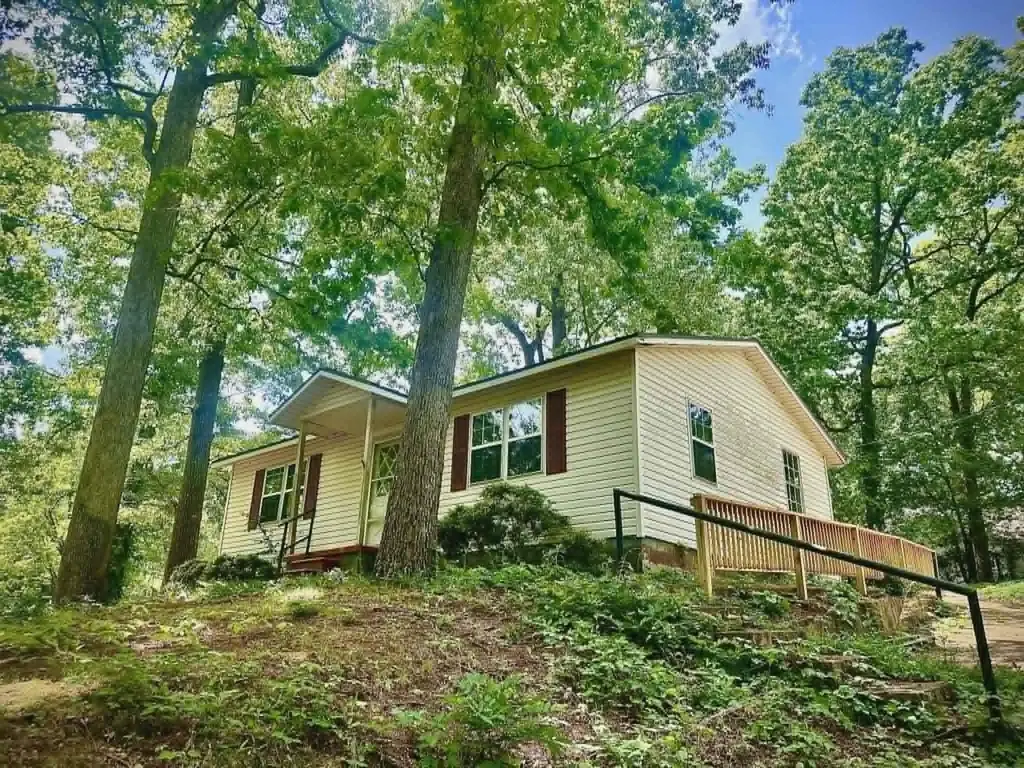
2121 Old Cloverdale Rd · Florence, AL
Flood risk 1/10 · Minimal
- FEMA flood zone
- X (unshaded)
- Chance of flooding over 30 yrs
- 0.0%
- Est. flood insurance / yr
- $507 – $1,088
Fire risk 3/10 · Minor
- Est. fire insurance / yr
- $916 – $1,700
Heat risk 6/10 · Moderate
- Hot days now (above 107°F)
- 7 days/yr
- Hot days in 30 yrs
- 20 days/yr
Wind risk 4/10 · Minor
- Chance of severe wind over 30 yrs
- 22.0%
Air-quality risk 2/10 · Minimal
- Unhealthy air days now
- 0 days/yr
- Unhealthy air days in 30 yrs
- 1 days/yr
Risk factors via First Street. Map © Google.
Why this score? — see what drove the D grade
The composite is a weighted blend of 9 inputs, each scored 0–100. Each bar is that input's sub-score; the figure is the points it added to the 100-point composite (weight × sub-score).
- Cash flow +12.6/30.0
- ARV discount +11.0/15.0
- Livability +4.1/5.0
- Rent growth +4.0/5.0
- DSCR +3.8/10.0
- Schools +3.0/10.0
- 1% rule +2.5/10.0
- Condition / age +2.5/5.0
- Appreciation +0.0/10.0
$129,999
🖨 Deal sheet 📄 Offer letter ✓ Due diligence
Listing remarks
Look at this great move-in-ready, updated two-bed, one-bath home! Minutes away from the University and anything in town!
Key facts
- 0.34 acre lot
- Built 1970
- Listed 56 days
Property features AI
Finance
- Financial info: Annual property tax approximately $653.74
Exterior
- Utilities: Public sewer
- Home design: Single-family residential property
- Construction: Approximately 900 above-grade finished area
- Exterior features: Frontage 115'; Lot dimensions approximately 115 x 159.7; 0.34-acre lot; Zoned R1
Interior
- Bedrooms: 2 bedrooms on the main level
- Bathrooms: 1 full bathroom
- Interior features: 5 total rooms
Neighborhood map
What this means for you Summary
Snapshot
- This is a 2-bed/1.0-bath single-family listed at $130k.
Deal economics
- At list price, monthly cash flow is $-16 ($-187/yr) — negative.
- To cash-flow at today's rent, offer at most $127k (2.1% below list).
- To meet the 1% rule (rent ≥ 1% of price), the offer needs to be $98k (24.7% below list).
- Recommended offer: $98k (24.7% below list) — sets the bar for 1% rule.
- Cap rate 6.1% vs local median 3.6% in Florence — top-decile yield for the area; either an underpriced asset or a hidden risk that comps aren't pricing in. Stress-test before assuming the spread holds.
Location & tenants
- Location reads 82/100 on livability (#4 in AL, #1,140 nationally) — a professional / high-income tenant draw. Strengths: amenities A+, commute A+, cost of living A+; Watch: crime F, employment F.
- Florence City (urban): math 28% / reading 44% proficiency, ranked #44 of 129 in AL (top 34%) — families likely to look elsewhere, expect single-tenant / working-renter base with shorter leases.
- Zoned schools: Florence Middle School (math 22% / reading 44%, grade F, #101 of 257 statewide, top 40%, 689 students, 51% FRL); Florence High School (math 28% / reading 34%, grade F, #66 of 305 statewide, top 21%, 1,034 students, 36% FRL).
- Market conditions: Rents rising fast (+6.2%/yr); 268 active listings in the ZIP; 9 comparable units currently listed for rent nearby; rentals lingering (median 44d on market — plan ~5-8 weeks vacancy on turnover, expect pricing pressure); 100% of comp listings sitting > 30 days — soft ceiling on asking rent; 164 units permitted in Lauderdale County in 2024 (72 in 5+ unit buildings).
Forward outlook
- Local home prices are declining (-3.0%/yr); year-one equity from $899 of loan paydown is wiped out by about $4k of value loss. Plan a longer hold.
Negotiation context
- It's been on market 57 days — a 3% lower offer ($126k) is reasonable based on typical stale-listing flexibility.
- 5 sale attempts since 17y ago; this cycle's ask has dropped $10k (7%) from the opening price — seller is motivated, your offer sets the floor, not the list.
Risks & watch-outs
- Climate carrying-cost: extreme-heat days projected 7→20/yr by 2055 (HVAC capex compounding) — expect insurance premiums to compound above CPI over the hold.
Questions for the listing agent
- What do current leases actually rent for vs. the listed asking? Can we see a recent rent roll and the last 12 months of T-12 income?
- It's been on market 57 days. Have you received any prior offers? Is the seller open to a 25% concession, seller financing, or rate buy-down credit?
- Built in 1970 — when were the roof, HVAC, electrical panel, plumbing, and water heater last replaced?
- Is there a deadline driving the sale (1031 exchange, divorce, estate, relocation)? That informs how much negotiation room exists.
- Crime grade is F in this area — have there been break-ins, vandalism, or insurance claims at this property in the last 3 years? What carrier currently insures it and at what premium?
- The area grade is low — what's the realistic commute time and amenity access for the typical tenant pool here? Any planned neighborhood developments (good or bad) we should know about?
- What's the average days-on-market for RENTAL listings here right now (not sales)? A rising rental-DOM trend means longer vacancies and softer asking-rent achievability than the comps imply.
- What's the recent tenant-quality profile in this submarket — average credit score on applications, eviction rate, late-payment / NSF rate, and stable-employment percentage? A property-management company in the area should have these aggregated.
- How much new for-sale + rental construction is in the pipeline within 1–3 miles? Heavy new supply typically softens prices + rents 12–24 months out; constrained supply supports both.
Investment metrics
- 1% rule
- 0.75% ✗
- Cap rate
- 6.15%
- Cash-on-cash
- -0.51%
- DSCR
- 0.98
- GRM
- 11.1
CMA / ARV
- ARV (median comp)
- $141,042
- List price
- $129,999
- Delta
- -7.83%
- Verdict
- FAIR
- Comps
- 20 within 1.0 mi
Show comp detail 6 sales within ~0.75 mi
| Address | Dist | Beds/Ba | Sqft | Sold | Price | $/sf | Match |
|---|---|---|---|---|---|---|---|
| 304 Elder St | 0.51mi | 3/1.0 (+1) | 950 (+10%) | 7mo | $145,500 | $153 | 49 |
| 1614 Sherrod Ave | 0.59mi | 2/1.0 | 888 (+3%) | 23mo | $80,500 | $91 | 48 |
| 113 Button Ave | 0.57mi | 2/1.0 | 952 (+10%) | 12mo | $65,000 | $68 | 47 |
| 222 Garfield Ave | 0.60mi | 2/1.0 | 980 (+13%) | 6mo | $105,000 | $107 | 44 |
| 204 Button Ave | 0.65mi | 3/1.0 (+1) | 905 (+5%) | 23mo | $105,000 | $116 | 38 |
| 603 Marion Ave | 0.71mi | 3/1.0 (+1) | 970 (+12%) | 10mo | $77,250 | $80 | 33 |
Match score weights: distance 35% · size 25% · config 20% · recency 20%. Top-matched comps best support the ARV.
Projected returns pro-forma
-3.0% appreciation · 6.18% rent growth · sell at horizon
- IRR
- -14.1%
- Equity multiple
- 0.48×
- Total profit
- $-18,879
- Equity at exit
- $19,383
- IRR
- -1.3%
- Equity multiple
- 0.90×
- Total profit
- $-3,769
- Equity at exit
- $11,240
Cash invested: $36,400 (down + closing). Projections, not guarantees.
Landlord ↔ Tenant lean methodology
- Overall (STATE)
- 90 Strongly Landlord-Friendly
- State Alabama
- 90 Strongly Landlord-Friendly · R+15
- County
- — inherits STATE
- City
- — inherits STATE
ZIP-level market 35630
- Home prices YoY
- -33.7%
- Rents YoY
- 6.2%
- Active inventory
- 268
- Price-to-rent
- 11.1×
Monthly cashflow live
- Estimated rent
- $979 high interval (Pro) →
- Mortgage (P&I)
- −$682
- Tax from tax record
- −$53 /mo · $641/yr
- Insurance
- −$54
- HOA
- −$0
- Vacancy / Maint / Mgmt
- −$206
- Net cashflow
- $-16
Break-even live
UW: 25.0% down · 7.5% · 30yr · 1.5% tax · 5.0% vac · 8.0% maint · 8.0% mgmt
Financing live
Cash to close
- Down payment
- $32,500
- Closing costs
- $3,900
- Reserves months
- —
- Total cash needed
- —
Loan-product check · same deal, 3 products live
Conventional
25% down · 7.5% · 30yr
- Down + closing
- —
- Monthly P&I
- —
- Monthly cashflow
- —
- DSCR
- —
- Eligible?
- —
Personal DTI + credit; lowest rate.
DSCR
20% down · 8.5% · 30yr
- Down + closing
- —
- Monthly P&I
- —
- Monthly cashflow
- —
- DSCR
- —
- Eligible?
- —
No personal income docs; deal must DSCR.
Hard money
10% down · 12.0% · 12mo
- Down + closing
- —
- Monthly P&I
- —
- Monthly cashflow
- —
- DSCR
- —
- Eligible?
- —
Short-term bridge; refi at stabilization.
Rent comps 9 comps
| Address | Beds | Baths | Sqft | Rent | $/sqft | DOM | Units | Dist |
|---|---|---|---|---|---|---|---|---|
| 2424 Roberts Ln Florence, AL | 2.0 | 2.0 | 1100 | $1,095 | $1.00 | 43d | 1 | 0.48mi |
| 1246 Graham Ave Unit 30 Florence, AL | 2.0 | 1.0 | 650 | $695 | $1.07 | 43d | 1 | 1.02mi |
| 611 Cypress Mill Rd Florence, AL | 1.0 | 1.0 | 750 | $750 | $1.00 | 43d | 4 | 1.03mi |
| 1202 Graham Ave Florence, AL | 1.0 | 1.0 | 800 | $675 | $0.84 | 43d | 1 | 1.06mi |
| 1034 N Royal Ave Unit 2 Florence, AL | 2.0 | 1.0 | 900 | $850 | $0.94 | 43d | 1 | 1.14mi |
| 939 N Royal Ave Florence, AL | 2.0 | 1.0 | 900 | $850 | $0.94 | 43d | 1 | 1.31mi |
| Cypress Dr Florence, AL | 2.0 | 1.0 | 782 | $695 | $0.89 | 43d | 1 | 1.41mi |
| 724 Kendrick St Apt 1 Florence, AL | 1.0 | 1.0 | 600 | $675 | $1.12 | 43d | 1 | 1.45mi |
| 3410 Chisholm Rd Florence, AL | 2.0 | 1.0–2.0 | 1008 | $872 | $0.87 | 43d | 3 | 1.49mi |
Listing history 21 events
-
2026-06-19days on market $129,999 Active 57 DOM
-
2026-06-18days on market $129,999 Active 56 DOM
-
2026-06-17days on market $129,999 Active 55 DOM
-
2026-06-16days on market $129,999 Active 54 DOM
-
2026-06-15days on market $129,999 Active 53 DOM
-
2026-06-14days on market $129,999 Active 51 DOM
-
2026-06-13pricedays on market $129,999 Active 50 DOM
-
2026-06-10days on market $139,999 Active 48 DOM
-
2026-06-09days on market $139,999 Active 47 DOM
-
2026-06-08days on market $139,999 Active 46 DOM
-
2026-06-05days on market $139,999 Active 42 DOM
-
2026-06-02days on market $139,999 Active 40 DOM
-
2026-06-01days on market $139,999 Active 39 DOM
-
2026-05-31days on market $139,999 Active 38 DOM
-
2026-05-30days on market $139,999 Active 37 DOM
-
2026-04-25historical $1,100
-
2026-04-23$139,999 Active 120-char remark
-
2026-03-24$1,100
-
2022-01-25$63,500
-
2021-07-10$59,850
-
2009-11-13$49,900
ⓘ Source: listings_history table (triggers on properties + properties_extension) + one-shot
backfill from property_details.listing_events for pre-trigger history.
Tax reassessment forecast AL · Resets to sale price
- Current annual tax
- $641 · $53/mo
- Projected year-2 tax
- $641 · $53/mo
- Expected delta
- $0/yr ($0/mo · 0.0%)
ⓘ Screening estimate from a state-policy table — verify with the county assessor before closing.
Climate risk First Street
- Flood 1/10 Low FEMA zone X (unshaded) · 0% chance over 30 yrs
- Wildfire 3/10 Moderate
- Heat 6/10 Major 7 d/yr ≥107°F today · 20 d/yr by 30 yrs out
- Wind 4/10 Moderate 22% chance of damaging wind over 30 yrs
- Air quality 2/10 Low 0 unhealthy d/yr today · 1 by 30 yrs out
Nearby sold comps map
Loading sold comps map…
Walkable amenities ~0.75 mi
Loading nearby amenities…
Taxation est. · year 1
- Rental income
- $11,752
- − Mortgage interest
- −$7,282
- − Property taxes
- −$641
- − Insurance
- −$650
- − Repairs & maintenance
- −$940
- − Management
- −$940
- − Depreciation
- −$3,782
- Taxable loss
- −$2,483
- Est. tax savings @ 24.0%
- +$596
- After-tax cash flow
- $408/yr
For passive investors: Depreciation is non-cash, so a rental often shows a tax loss while cash-flowing — sheltering income. Rental losses are passive: they offset passive income freely, and up to $25,000/yr can offset ordinary (W-2) income if you actively participate and your MAGI is under $100k (phasing out to $0 by $150k); unused losses carry forward. On sale, claimed depreciation is recaptured at up to 25%, and gains may owe capital-gains tax (a 1031 exchange can defer both). Figures are a year-1 estimate at your 24.0% rate — not tax advice; consult a CPA.
Schools (NCES district)
- District
- Florence City
- NCES district ID
- 0101530
- Math proficiency
- 28% ▼ -28.00%
- Reading proficiency
- 44% ▼ -4.00%
- Median HH income
- $34,997
- Composite
- 29.69/100
- National rank
- #6456
- State rank
- #44 of 129 in AL
Livability — Florence
- Score
- 82/100
- State rank
- #4
- US rank
- #1140
Category grades
Schools grade is shown separately in the Schools card above.
Census & demographics
- Census place
- Florence, AL
- County
- Lauderdale County · 47,988 people
- City population
- 34,028
- Metro
- Florence-Muscle Shoals, AL
- Population (ZIP)
- 34,028
- Household income
- $46,304
- Rent vs Own
- Severe rent burden
- 1516.0
Population outlook (Lauderdale County) Hauer SSP2
- Today (2025)
- 93,386 people
- By 2030
- 93,634 · +0.3%
- By 2040
- 93,114 · -0.3%
- By 2050
- 91,586 · -1.9%
- By 2075
- 88,667 · -5.1%
- By 2100
- 81,098 · -13.2%
Race, ethnicity, and origin ACS 2023
- Neighborhood character
- Predominantly White (70%)
- Race & ethnicity
- White 70% Black 18% Two or more races 6% Hispanic / Latino 6%
- Hispanic origin (detail)
- Mexican 5%
- Common ancestry
- Slovak 3% Serbian 2% Romanian 1%
- Foreign-born
- 4% · Canada, Vietnam, Guatemala
- Languages at home
- 92% English-only · Spanish 6% Vietnamese 1%
Political lean MEDSL · Lauderdale
- 2024 margin
- Solid R (+51.5) · D 23.8% · R 75.3%
- 2008→2024 swing
- -23.3pp toward R · 2008: -28.2pp · 2024: -51.5pp
- All cycles
- 2024: R+51.5 2020: R+44.7 2016: R+46.0 2012: R+30.9 2008: R+28.2
Not yet ingested
- Civics
- —
Market trends
- HPI YoY
- ▼ -104.78%
- Current HPI
- 206.1364
- Rent YoY
- ▲ 6.18%
- Metro
- Florence-Muscle Shoals, AL
- State GDP YoY
- ▲ 2.94%
- F500 in state
- 4
Industry mix (Fortune 500 HQ in AL)
| Industry | F500 HQs | Revenue |
|---|---|---|
| Financial Services | 1 | $8B |
|
||
| Healthcare | 1 | $5B |
|
||
Price history
+160.5% since first listed7 events — show timeline
- 2026-06-12 Price Changed $129,999 SAARMLS
- 2026-04-25 Rental Removed $1,100 RENTEC
- 2026-04-23 Listed $139,999 SAARMLS
- 2026-03-24 Listed for Rent $1,100 RENTEC
- 2022-01-25 Listed $63,500 SAARMLS
- 2021-07-10 Listed $59,850 SAARMLS
- 2009-11-13 Listed $49,900 SAARMLS
Property tax history
+3.9%/yrLatest (2025): $641 · +6.9% YoY. Source: county tax records.
Cash-flow waterfall
monthlySold comps — $/sqft
last 12 mo · ≤1 miLoading sold comps…