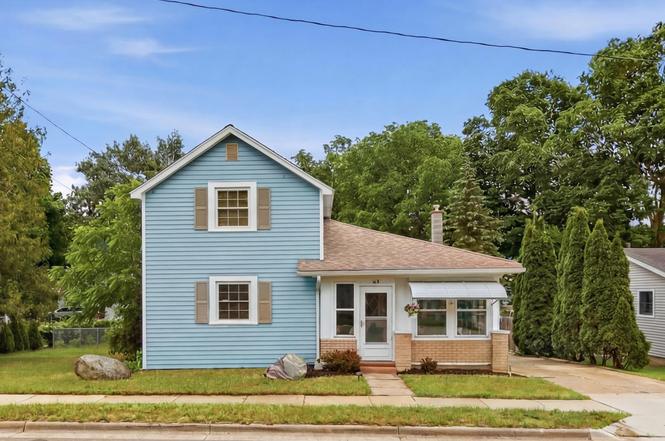
419 N Monroe St SE · Lowell, MI
Flood risk 6/10 · Moderate
- FEMA flood zone
- X (shaded)
- Chance of flooding over 30 yrs
- 0.67%
- Est. flood insurance / yr
- $473 – $860
Fire risk 1/10 · Minimal
- Est. fire insurance / yr
- $784 – $1,456
Heat risk 3/10 · Minor
- Hot days now (above 97°F)
- 7 days/yr
- Hot days in 30 yrs
- 15 days/yr
Wind risk 2/10 · Minimal
- Chance of severe wind over 30 yrs
- —
Air-quality risk 2/10 · Minimal
- Unhealthy air days now
- 1 days/yr
- Unhealthy air days in 30 yrs
- 1 days/yr
Risk factors via First Street. Map © Google.
Why this score? — see what drove the D- grade
The composite is a weighted blend of 9 inputs, each scored 0–100. Each bar is that input's sub-score; the figure is the points it added to the 100-point composite (weight × sub-score).
- Cash flow +13.2/30.0
- Schools +5.0/10.0
- ARV discount +4.8/15.0
- DSCR +4.0/10.0
- Livability +4.0/5.0
- 1% rule +3.8/10.0
- Rent growth +2.5/5.0
- Condition / age +2.5/5.0
- Appreciation +0.0/10.0
$285,000
🖨 Deal sheet (PDF) 📄 Offer letter ✓ Due diligence
Listing remarks MLS
Dreaming of a walkable small-town lifestyle just 20 minutes from Grand Rapids? Make Lowell your hometown and 419 N. Monroe your new address. This charming 3-bedroom, 1-bath home blends character with thoughtful updates, including a beautifully renovated bathroom, a sun-filled back bedroom, and a versatile flex room completed in 2026. A spacious main-floor laundry room and attached garage add everyday convenience. Outside, enjoy a fully fenced . 24-acre backyard with plenty of room to relax, entertain, and play, complete with a gazebo and storage shed. Live the Downtown Lowell lifestyle--grab coffee at Sweet Seasons Bakery & Cafe, spend afternoons along the Flat River, and enjoy summer concerts and social district cocktails just steps from your front door. Charm, updates, location, and a walkable downtown lifestyle--all for under $300,000.Schedule your tour today!
Key facts
- Renovated bathroom
- Gazebo
- Storage shed
Tags
Property features AI
Exterior
- Parking: Attached 1-car garage
- Utilities: Public water; Electricity available; Natural gas connected; Natural gas water heater
- Home design: Traditional style; Single family residence; Residential property
- Construction: Built in 1900; Brick and vinyl siding construction; Composition roof; Foundation with partial Michigan basement
- Exterior features: Shed(s); Paved road access
Interior
- Kitchen: Oven; Range; Refrigerator
- Bedrooms: Primary bedroom; Bedroom 2; Bedroom 3
- Bathrooms: 1 full bathroom
- Heating & cooling: Forced air heating; Central cooling
- Interior features: Garage door opener; Window treatments; Michigan partial basement; Bonus room
- Laundry & utility: Washer; Dryer; Laundry room
Neighborhood map
What this means for you Summary
Snapshot
- This is a 3-bed/1.0-bath single-family listed at $285k.
Deal economics
- At list price, monthly cash flow is $-3 ($-31/yr) — negative.
- To cash-flow at today's rent, offer at most $285k (0.2% below list).
- To meet the 1% rule (rent ≥ 1% of price), the offer needs to be $250k (12.3% below list).
- Recommended offer: $250k (12.3% below list) — sets the bar for 1% rule.
- Cap rate 6.3% vs local median 2.9% in Lowell — top-decile yield for the area; either an underpriced asset or a hidden risk that comps aren't pricing in. Stress-test before assuming the spread holds.
Location & tenants
- Location reads 80/100 on livability (#76 in MI, #1,669 nationally) — a professional / high-income tenant draw. Strengths: cost of living A+, housing A+, health & safety A+; Watch: amenities F, commute F.
- Lowell Area Schools (rural): math 51% / reading 64% proficiency, ranked #51 of 540 in MI (top 9%) — acceptable for families but not a draw, mixed tenant base, ~2y average lease.
- Zoned schools: Cherry Creek Elementary School (math 49% / reading 61%, grade C, #271 of 1,397 statewide, top 20%, 468 students, 43% FRL); Lowell Middle School (math 47% / reading 62%, grade B-, #80 of 493 statewide, top 17%, 771 students, 30% FRL); Lowell Senior High School (math 44% / reading 64%, grade C-, #123 of 713 statewide, top 17%, 1,099 students, 29% FRL).
- Market conditions: 116 active listings in the ZIP; 1 comparable units currently listed for rent nearby; 2,253 units permitted in Kent County in 2024 (969 in 5+ unit buildings).
Forward outlook
- Local home prices are declining (-3.0%/yr); year-one equity from $2k of loan paydown is wiped out by about $9k of value loss. Plan a longer hold.
- Kent County population projected at +22% by 2050 — long-run rental-demand tailwind backs the buy-and-hold thesis.
Negotiation context
- Only 4 days on market — expect competitive offers; lowballing is unlikely to land.
- 17 sale attempts since 26y ago with the ask held roughly flat each time — persistent listings suggest the price (not the market) is what's stuck; bring a comps-based counter.
- Current owner paid $220k; 30% above their basis — modest negotiation headroom, anchor on the comps not their cost.
Risks & watch-outs
- Watch-outs: built in 1900 — expect roof / HVAC / electrical / plumbing capex.
- Climate carrying-cost: major flood risk — expect insurance premiums to compound above CPI over the hold.
Questions for the listing agent
- What do current leases actually rent for vs. the listed asking? Can we see a recent rent roll and the last 12 months of T-12 income?
- Built in 1900 — when were the roof, HVAC, electrical panel, plumbing, and water heater last replaced?
- Is there a deadline driving the sale (1031 exchange, divorce, estate, relocation)? That informs how much negotiation room exists.
- Schools are B-rated — typically a magnet for longer-tenancy family renters. What's the average tenant stay here, and is there a school-zone premium baked into asking?
- The area grade is low — what's the realistic commute time and amenity access for the typical tenant pool here? Any planned neighborhood developments (good or bad) we should know about?
- What's the average days-on-market for RENTAL listings here right now (not sales)? A rising rental-DOM trend means longer vacancies and softer asking-rent achievability than the comps imply.
- What's the recent tenant-quality profile in this submarket — average credit score on applications, eviction rate, late-payment / NSF rate, and stable-employment percentage? A property-management company in the area should have these aggregated.
- How much new for-sale + rental construction is in the pipeline within 1–3 miles? Heavy new supply typically softens prices + rents 12–24 months out; constrained supply supports both.
Investment metrics
- 1% rule
- 0.88% ✗
- Cap rate
- 6.28%
- Cash-on-cash
- -0.04%
- DSCR
- 1.00
- GRM
- 9.5
CMA / ARV
- ARV (on-the-fly)
- $268,800
- Comps found
- 12
Show comp detail 12 sales within ~0.75 mi
| Address | Dist | Beds/Ba | Sqft | Sold | Price | $/sf | Match |
|---|---|---|---|---|---|---|---|
| 622 N Washington St | 0.13mi | 3/1.0 | 1,438 (+7%) | 2mo | $246,000 | $171 | 80 |
| 607 N Washington St SE | 0.12mi | 3/2.0 | 1,248 (-7%) | 3mo | $260,000 | $208 | 76 |
| 500 N Washington St | 0.06mi | 2/1.5 (-1) | 1,400 (+4%) | 9mo | $330,000 | $236 | 76 |
| 829 N Jefferson St | 0.28mi | 3/1.5 | 1,272 (-5%) | 2mo | $326,000 | $256 | 74 |
| 517 Front St | 0.40mi | 3/1.0 | 1,274 (-5%) | 2mo | $255,000 | $200 | 72 |
| 414 N Jefferson St | 0.12mi | 3/2.0 | 1,500 (+12%) | 5mo | $269,500 | $180 | 67 |
| 125 S Grove St SE | 0.50mi | 2/2.0 (-1) | 1,342 (-0%) | 3mo | $302,000 | $225 | 65 |
| 164 S Pleasant Ave | 0.69mi | 2/1.0 (-1) | 1,392 (+4%) | 1mo | $220,000 | $158 | 56 |
| 416 Kent St | 0.33mi | 3/2.0 | 1,506 (+12%) | 10mo | $275,000 | $183 | 52 |
| 727 Chatham St SE | 0.53mi | 2/1.0 (-1) | 1,158 (-14%) | 7mo | $242,000 | $209 | 41 |
| 152 S Pleasant Ave SE | 0.68mi | 3/2.0 | 1,489 (+11%) | 11mo | $286,000 | $192 | 38 |
| 1212 Highland Hill Dr SE | 0.66mi | 3/2.0 | 1,540 (+15%) | 6mo | $294,000 | $191 | 36 |
Match score weights: distance 35% · size 25% · config 20% · recency 20%. Top-matched comps best support the ARV.
Projected returns pro-forma
-3.0% appreciation · 3.0% rent growth · sell at horizon
- IRR
- -16.4%
- Equity multiple
- 0.42×
- Total profit
- $-46,305
- Equity at exit
- $42,494
- IRR
- -8.0%
- Equity multiple
- 0.49×
- Total profit
- $-40,362
- Equity at exit
- $24,642
Cash invested: $79,800 (down + closing). Projections, not guarantees.
Landlord ↔ Tenant lean methodology
- Overall (STATE)
- 62 Landlord-Friendly
- State Michigan
- 62 Landlord-Friendly · EVEN
- County
- — inherits STATE
- City
- — inherits STATE
ZIP-level market 49331
- Home prices YoY
- -31.2%
- Active inventory
- 116
- Price-to-rent
- 9.5×
Monthly cashflow live
- Estimated rent
- $2,500 medium interval (Pro) →
- Mortgage (P&I)
- −$1,495
- Tax from tax record
- −$364 /mo · $4,371/yr
- Insurance
- −$119
- HOA
- −$0
- Lot rent
- −$0
- Vacancy / Maint / Mgmt
- −$525
- Net cashflow
- $-3
Break-even live
Sensitivity live
| Price | -10% $159 | -5% $78 | +0% $-3 | +5% $-83 | +10% $-164 |
|---|---|---|---|---|---|
| Rent | -10% $-200 | -5% $-101 | +0% $-3 | +5% $96 | +10% $195 |
| Rate | -1.0pp $141 | -0.5pp $70 | base $-3 | +0.5pp $-76 | +1.0pp $-152 |
UW: 25.0% down · 7.5% · 30yr · 1.5% tax · 5.0% vac · 8.0% maint · 8.0% mgmt
Financing live
Cash to close
- Down payment
- $71,250
- Closing costs
- $8,550
- Reserves months
- —
- Total cash needed
- —
Loan-product check · same deal, 3 products live
Conventional
25% down · 7.5% · 30yr
- Down + closing
- —
- Monthly P&I
- —
- Monthly cashflow
- —
- DSCR
- —
- Eligible?
- —
Personal DTI + credit; lowest rate.
DSCR
20% down · 8.5% · 30yr
- Down + closing
- —
- Monthly P&I
- —
- Monthly cashflow
- —
- DSCR
- —
- Eligible?
- —
No personal income docs; deal must DSCR.
Hard money
10% down · 12.0% · 12mo
- Down + closing
- —
- Monthly P&I
- —
- Monthly cashflow
- —
- DSCR
- —
- Eligible?
- —
Short-term bridge; refi at stabilization.
Rent comps 1 comps
| Address | Beds | Baths | Sqft | Rent | $/sqft | DOM | Units | Dist |
|---|---|---|---|---|---|---|---|---|
| 220 King St #9 Lowell, MI | 2.0 | 2.0 | 1150 | $2,500 | $2.17 | 16d | 1 | 0.09mi |
Listing history 3 events
-
2026-06-21days on market $285,000 Active 4 DOM
-
2026-06-17remarks 688-char remark
-
2026-06-17$285,000 Active 1 DOM
ⓘ Source: listings_history table (triggers on properties + properties_extension) + one-shot
backfill from property_details.listing_events for pre-trigger history.
Tax reassessment forecast MI · Partial reset (capped growth)
- Current annual tax
- $4,371 · $364/mo
- Projected year-2 tax
- $4,380 · $365/mo
- Expected delta
- +$9/yr (+$1/mo · 0.2%)
ⓘ Screening estimate from a state-policy table — verify with the county assessor before closing.
Climate risk First Street
- Flood 6/10 Major FEMA zone X (shaded) · 67% chance over 30 yrs
- Wildfire 1/10 Low
- Heat 3/10 Moderate 7 d/yr ≥97°F today · 15 d/yr by 30 yrs out
- Wind 2/10 Low
- Air quality 2/10 Low 1 unhealthy d/yr today · 1 by 30 yrs out
Nearby sold comps map
Loading sold comps map…
Walkable amenities ~0.75 mi
Loading nearby amenities…
Taxation est. · year 1
- Rental income
- $30,000
- − Mortgage interest
- −$15,964
- − Property taxes
- −$4,371
- − Insurance
- −$1,425
- − Repairs & maintenance
- −$2,400
- − Management
- −$2,400
- − Depreciation
- −$8,291
- Taxable loss
- −$4,852
- Est. tax savings @ 24.0%
- +$1,164
- After-tax cash flow
- $1,133/yr
For passive investors: Depreciation is non-cash, so a rental often shows a tax loss while cash-flowing — sheltering income. Rental losses are passive: they offset passive income freely, and up to $25,000/yr can offset ordinary (W-2) income if you actively participate and your MAGI is under $100k (phasing out to $0 by $150k); unused losses carry forward. On sale, claimed depreciation is recaptured at up to 25%, and gains may owe capital-gains tax (a 1031 exchange can defer both). Figures are a year-1 estimate at your 24.0% rate — not tax advice; consult a CPA.
Schools (NCES district)
- District
- Lowell Area Schools
- NCES district ID
- 2622050
- Math proficiency
- 51% ▼ -6.00%
- Reading proficiency
- 64% ▼ -3.00%
- Median HH income
- $64,828
- Composite
- 50.37/100
- National rank
- #1873
- State rank
- #51 of 540 in MI
Livability — Lowell
- Score
- 80/100
- State rank
- #76
- US rank
- #1669
Category grades
Schools grade is shown separately in the Schools card above.
Census & demographics
- Census place
- Lowell, MI
- Population (ZIP)
- 17,419
Population outlook (Kent County) Hauer SSP2
- Today (2025)
- 712,484 people
- By 2030
- 748,618 · +5.1%
- By 2040
- 814,777 · +14.4%
- By 2050
- 868,556 · +21.9%
- By 2075
- 966,487 · +35.7%
- By 2100
- 967,975 · +35.9%
Race, ethnicity, and origin ACS 2023
- Neighborhood character
- Predominantly White (88%)
- Race & ethnicity
- White 88% Two or more races 7% Hispanic / Latino 4% Black 1%
- Common ancestry
- Iranian 16% Romanian 8% Italian 3%
- Foreign-born
- 1%
- Languages at home
- 98% English-only · French/Haitian/Cajun 1% Spanish 1% Other Asian/Pacific 1%
Political lean MEDSL · Kent
- 2024 margin
- Lean D (+5.4) · D 51.8% · R 46.5% · Other 1.7%
- 2008→2024 swing
- +4.8pp toward D · 2008: 0.5pp · 2024: 5.4pp
- All cycles
- 2024: D+5.4 2020: D+6.1 2016: R+3.1 2012: R+7.9 2008: D+0.5
Not yet ingested
- Civics
- —
Market trends
- HPI YoY
- ▼ -120.98%
- Current HPI
- 266.8058
- Rent YoY
- —
- Metro
- —
- State GDP YoY
- ▲ 1.37%
- F500 in state
- 28
Industry mix (Fortune 500 HQ in MI)
| Industry | F500 HQs | Revenue |
|---|---|---|
| Automotive Parts | 3 | $48B |
|
||
| Automotive | 2 | $372B |
|
||
| Chemicals | 1 | $45B |
|
||
| Automotive Retail | 1 | $29B |
|
||
| Healthcare / Medical Devices | 1 | $23B |
|
||
| Automotive Technology | 1 | $20B |
|
||
Price history
+208.1% since first listed38 events — show timeline
- 2026-06-14 Listed $285,000 REALCOMP
- 2026-06-14 Listed $285,000 MiRealSource-MiMLS
- 2026-06-14 Listed $285,000 SW Michigan MLS
- 2021-07-13 Sold (Public Records) $220,000 Public Records
- 2021-06-28 Sold (MLS) $220,000 SW Michigan MLS
- 2021-06-28 Sold (MLS) $220,000 REALCOMP
- 2021-05-05 Pending — REALCOMP
- 2021-05-05 Pending — SW Michigan MLS
- 2021-04-29 Listed $195,000 MiRealSource-MiMLS
- 2021-04-29 Listed $195,000 SW Michigan MLS
- 2021-04-29 Listed $195,000 REALCOMP
- 2019-06-28 Sold (Public Records) $163,000 Public Records
- 2019-06-25 Sold (MLS) $163,000 SW Michigan MLS
- 2019-06-25 Sold (MLS) $163,000 REALCOMP
- 2019-05-01 Pending — SW Michigan MLS
- 2019-04-25 Listed $159,900 MiRealSource-MiMLS
- 2019-04-25 Listed $159,900 SW Michigan MLS
- 2019-04-25 Listed $159,900 REALCOMP
- 2015-09-29 Sold (Public Records) $105,000 Public Records
- 2015-09-16 Sold (MLS) $105,000 SW Michigan MLS
- 2015-09-16 Sold (MLS) $105,000 REALCOMP
- 2015-08-03 Listing Removed — SW Michigan MLS
- 2015-05-29 Listed $109,900 SW Michigan MLS
- 2015-05-29 Listed $109,900 REALCOMP
- 2014-09-15 Listing Removed — SW Michigan MLS
- 2008-02-27 Listing Removed — REALCOMP
- 2008-01-04 Listed $49,900 REALCOMP
- 2008-01-04 Listed $49,900 SW Michigan MLS
- 2004-12-15 Sold (Public Records) $100,000 Public Records
- 2004-11-22 Sold (MLS) $100,000 REALCOMP
- 2004-11-22 Sold (MLS) $100,000 SW Michigan MLS
- 2004-08-25 Listed $104,900 REALCOMP
- 2004-08-25 Listed $104,900 SW Michigan MLS
- 2000-12-11 Sold (Public Records) $88,000 Public Records
- 2000-11-27 Sold (MLS) $88,000 REALCOMP
- 2000-11-27 Sold (MLS) $88,000 SW Michigan MLS
- 2000-09-21 Listed $92,500 REALCOMP
- 2000-09-21 Listed $92,500 SW Michigan MLS
Property tax history
+3.6%/yrLatest (2025): $4,371 · +2.8% YoY. Source: county tax records.
Cash-flow waterfall
monthlySold comps — $/sqft
last 12 mo · ≤1 miLoading sold comps…