4561 Homestead Dr · North Whitehall, PA
Flood risk 1/10 · Minimal
- FEMA flood zone
- X (unshaded)
- Chance of flooding over 30 yrs
- 0.0%
- Est. flood insurance / yr
- $473 – $860
Fire risk 1/10 · Minimal
- Est. fire insurance / yr
- $511 – $949
Heat risk 4/10 · Minor
- Hot days now (above 100°F)
- 7 days/yr
- Hot days in 30 yrs
- 15 days/yr
Wind risk 4/10 · Minor
- Chance of severe wind over 30 yrs
- 15.0%
Air-quality risk 2/10 · Minimal
- Unhealthy air days now
- 1 days/yr
- Unhealthy air days in 30 yrs
- 3 days/yr
Risk factors via First Street. Map © Google.
Why this score? — see what drove the B+ grade
The composite is a weighted blend of 9 inputs, each scored 0–100. Each bar is that input's sub-score; the figure is the points it added to the 100-point composite (weight × sub-score).
- Cash flow +30.0/30.0
- ARV discount +13.4/15.0
- 1% rule +10.0/10.0
- DSCR +10.0/10.0
- Schools +5.7/10.0
- Condition / age +3.8/5.0
- Rent growth +2.5/5.0
- Livability +2.5/5.0
- Appreciation +0.0/10.0
$65,900
🖨 Deal sheet 📄 Offer letter ✓ Due diligence
Listing remarks
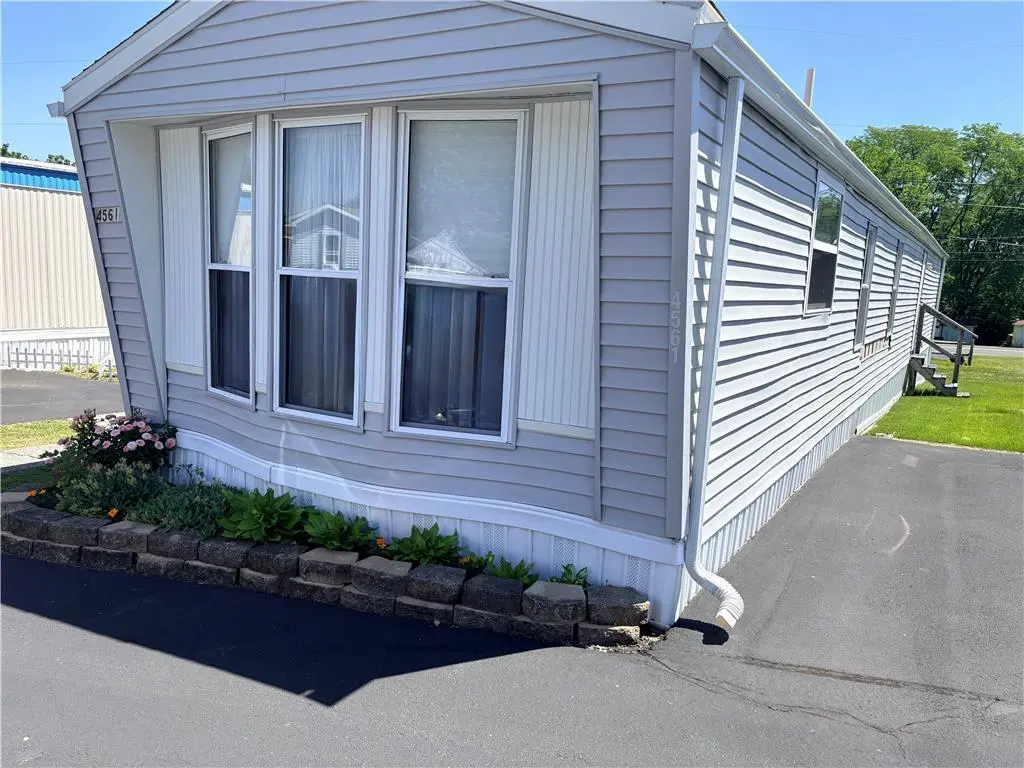
Welcome home tho this updated home in sought after Parkland School District. Featuring two bedrooms, 1 bath afresh paint, new flooring and a renovated kitchen. This move in ready home offers comfort an charm throughout. Recent upgrades include insulated windows, vinyl siding, central air: mini split, hot water heater and under belly insulation, with reinforced roof and and new shingles in 2022. Along with a side deck to enjoy the outdoors.
Key facts
- Insulated windows
- Hot water heater
- Renovated kitchen
Tags
Property features AI
Finance
- Other: Zoned AR
- HOA & community: Association fee of $650 per month
Exterior
- Parking: 1-car garage; Driveway; Off-street parking
- Utilities: Public water; Community/Coop sewer; Electric water heater; Electric power (implied by electric appliances)
- Home design: Single-story; Wood siding construction; Asphalt/fiberglass roof; Facing direction not specified; Entry level not specified; Property type not specified
- Construction: Built with wood siding; Asphalt/fiberglass roof
- Exterior features: Deck; Mobile home on property
Interior
- Kitchen: Dishwasher; Electric oven; Microwave
- Flooring: Carpet; Hardwood; Luxury vinyl / luxury vinyl plank; Tile
- Bathrooms: 1 full bathroom
- Heating & cooling: Forced air heating; Ductless cooling
- Interior features: Eat-in kitchen; Kitchen island
- Laundry & utility: Washer hookup; Dryer hookup; Electric dryer hookup; Washer; Electric dryer; Electric water heater
Neighborhood map
What this means for you Summary
Snapshot
- This is a 2-bed/1.0-bath manufactured listed at $66k. Condition is rated good.
Deal economics
- At list price, monthly cash flow is $352 ($4k/yr) — positive.
- The deal already cash-flows at list — no discount required.
- Meets the 1% rule at list price ($2k rent vs $66k).
Location & tenants
- Location reads: area grade B — affects rentability + tenant quality, not the cash-flow math above.
- Parkland SD (suburban): math 59% / reading 70% proficiency, ranked #40 of 539 in PA (top 7%) — acceptable for families but not a draw, mixed tenant base, ~2y average lease; only 15% free/reduced lunch — higher-income household profile.
- Market conditions: 30 active listings in the ZIP; 765 units permitted in Lehigh County in 2024 (286 in 5+ unit buildings).
Forward outlook
- Local home prices are declining (-3.0%/yr); year-one equity from $456 of loan paydown is wiped out by about $2k of value loss. Plan a longer hold.
- Lehigh County population projected at +21% by 2050 — long-run rental-demand tailwind backs the buy-and-hold thesis.
- At projected returns (-3.0% appreciation + 3.0% rent growth), your $18k cash investment doubles in ~6 years — after that, you're playing with house money.
Negotiation context
- Only 13 days on market — expect competitive offers; lowballing is unlikely to land.
- 7 sale attempts since 4y ago with the ask held roughly flat each time — persistent listings suggest the price (not the market) is what's stuck; bring a comps-based counter.
Risks & watch-outs
- Watch-outs: HOA is 35% of rent.
Questions for the listing agent
- What does the HOA fee cover, when was the last increase, and are there any pending special assessments or reserve-fund shortfalls?
- Is there a deadline driving the sale (1031 exchange, divorce, estate, relocation)? That informs how much negotiation room exists.
- What's the average days-on-market for RENTAL listings here right now (not sales)? A rising rental-DOM trend means longer vacancies and softer asking-rent achievability than the comps imply.
- What's the recent tenant-quality profile in this submarket — average credit score on applications, eviction rate, late-payment / NSF rate, and stable-employment percentage? A property-management company in the area should have these aggregated.
- How much new for-sale + rental construction is in the pipeline within 1–3 miles? Heavy new supply typically softens prices + rents 12–24 months out; constrained supply supports both.
Investment metrics
- 1% rule
- 2.80% ✓
- Cap rate
- 12.70%
- Cash-on-cash
- 22.89%
- DSCR
- 2.02
- GRM
- 3.0
CMA / ARV
- ARV (on-the-fly)
- $75,768
- Comps found
- 4
Show comp detail 4 sales within ~0.75 mi
| Address | Dist | Beds/Ba | Sqft | Sold | Price | $/sf | Match |
|---|---|---|---|---|---|---|---|
| 4578 Homestead Dr | 0.00mi | 2/2.0 | 980 (+6%) | 11mo | $79,900 | $82 | 76 |
| 4593 Homestead Dr | 0.00mi | 2/2.0 | 1,008 (+9%) | 15mo | $94,500 | $94 | 68 |
| 3077 Gayle Ln | 0.69mi | 2/2.0 | 980 (+6%) | 6mo | $72,500 | $74 | 49 |
| 3082 Audrey Dr | 0.67mi | 3/1.0 (+1) | 952 (+3%) | 17mo | $73,000 | $77 | 45 |
Match score weights: distance 35% · size 25% · config 20% · recency 20%. Top-matched comps best support the ARV.
Projected returns pro-forma
-3.0% appreciation · 3.0% rent growth · sell at horizon
- IRR
- 16.3%
- Equity multiple
- 1.66×
- Total profit
- $12,167
- Equity at exit
- $9,826
- IRR
- 25.2%
- Equity multiple
- 3.23×
- Total profit
- $41,198
- Equity at exit
- $5,698
Cash invested: $18,452 (down + closing). Projections, not guarantees.
Landlord ↔ Tenant lean methodology
- Overall (STATE)
- 62 Landlord-Friendly
- State Pennsylvania
- 62 Landlord-Friendly · EVEN
- County
- — inherits STATE
- City
- — inherits STATE
ZIP-level market 18037
- Home prices YoY
- -24.1%
- Active inventory
- 30
- Price-to-rent
- 3.0×
Monthly cashflow live
- Estimated rent
- $1,845 medium interval (Pro) →
- Mortgage (P&I)
- −$346
- Tax est. 1.5%
- −$82 /mo · $988/yr
- Insurance
- −$27
- HOA
- −$650
- Vacancy / Maint / Mgmt
- −$387
- Net cashflow
- $352
Break-even live
UW: 25.0% down · 7.5% · 30yr · 1.5% tax · 5.0% vac · 8.0% maint · 8.0% mgmt
Financing live
Cash to close
- Down payment
- $16,475
- Closing costs
- $1,977
- Reserves months
- —
- Total cash needed
- —
Loan-product check · same deal, 3 products live
Conventional
25% down · 7.5% · 30yr
- Down + closing
- —
- Monthly P&I
- —
- Monthly cashflow
- —
- DSCR
- —
- Eligible?
- —
Personal DTI + credit; lowest rate.
DSCR
20% down · 8.5% · 30yr
- Down + closing
- —
- Monthly P&I
- —
- Monthly cashflow
- —
- DSCR
- —
- Eligible?
- —
No personal income docs; deal must DSCR.
Hard money
10% down · 12.0% · 12mo
- Down + closing
- —
- Monthly P&I
- —
- Monthly cashflow
- —
- DSCR
- —
- Eligible?
- —
Short-term bridge; refi at stabilization.
HOA detail
- Monthly dues
- $650 · $7,800/yr
- Likely covers
- water
Listing history 11 events
-
2026-06-17status $65,900 Pending 13 DOM
-
2026-06-17days on market $65,900 Active 13 DOM
-
2026-06-16days on market $65,900 Active 12 DOM
-
2026-06-15days on market $65,900 Active 11 DOM
-
2026-06-14days on market $65,900 Active 9 DOM
-
2026-06-13days on market $65,900 Active 8 DOM
-
2026-06-10days on market $65,900 Active 6 DOM
-
2026-06-09days on market $65,900 Active 5 DOM
-
2026-06-08days on market $65,900 Active 4 DOM
-
2026-06-07remarks 443-char remark
-
2026-06-07$65,900 Active 3 DOM
ⓘ Source: listings_history table (triggers on properties + properties_extension) + one-shot
backfill from property_details.listing_events for pre-trigger history.
Climate risk First Street
- Flood 1/10 Low FEMA zone X (unshaded) · 0% chance over 30 yrs
- Wildfire 1/10 Low
- Heat 4/10 Moderate 7 d/yr ≥100°F today · 15 d/yr by 30 yrs out
- Wind 4/10 Moderate 15% chance of damaging wind over 30 yrs
- Air quality 2/10 Low 1 unhealthy d/yr today · 3 by 30 yrs out
Nearby sold comps map
Loading sold comps map…
Walkable amenities ~0.75 mi
Loading nearby amenities…
Taxation est. · year 1
- Rental income
- $22,138
- − Mortgage interest
- −$3,691
- − Property taxes
- −$988
- − Insurance
- −$330
- − Repairs & maintenance
- −$1,771
- − Management
- −$1,771
- − HOA
- −$7,800
- − Depreciation
- −$1,917
- Taxable income
- $3,869
- Est. tax owed @ 24.0%
- −$929
- After-tax cash flow
- $3,295/yr
For passive investors: Depreciation is non-cash, so a rental often shows a tax loss while cash-flowing — sheltering income. Rental losses are passive: they offset passive income freely, and up to $25,000/yr can offset ordinary (W-2) income if you actively participate and your MAGI is under $100k (phasing out to $0 by $150k); unused losses carry forward. On sale, claimed depreciation is recaptured at up to 25%, and gains may owe capital-gains tax (a 1031 exchange can defer both). Figures are a year-1 estimate at your 24.0% rate — not tax advice; consult a CPA.
Condition & rehab AI · 13 photos
This updated mobile home is move-in ready with recent upgrades and a good condition score, but a fresh kitchen and updated flooring would significantly enhance its value.
Repairs flagged
- Minor kitchen cabinets — slightly worn
- Minor kitchen countertops — dated and worn
- Minor kitchen appliances — dated and worn
Value-add opportunities
- Resale update kitchen cabinets and countertops — modernizing the kitchen
- Both install new flooring — improves both resale and rental value
- Both paint interior walls — enhances curb appeal and interior aesthetics
Renovation cost estimate screening
| Repair item | Severity | Est. cost |
|---|---|---|
| kitchen cabinets · slightly worn | Minor | $500–3,000 |
| kitchen countertops · dated and worn | Minor | $500–3,000 |
| kitchen appliances · dated and worn | Minor | $500–3,000 |
| Total estimated repair cost · 3 items | $1,500–9,000 |
Value-add ROI direction
- Resale update kitchen cabinets and countertops — modernizing the kitchen ↑
- Both install new flooring — improves both resale and rental value ↑
- Both paint interior walls — enhances curb appeal and interior aesthetics ↑
ⓘ Cost ranges are severity-bucket heuristics (US national rule-of-thumb). Get contractor quotes + a written scope before underwriting a rehab budget.
Schools (NCES district)
- District
- Parkland SD
- NCES district ID
- 4218510
- Math proficiency
- 59% ▼ -11.00%
- Reading proficiency
- 70% ▼ -12.00%
- Median HH income
- $77,976
- Composite
- 57.44/100
- National rank
- #1074
- State rank
- #40 of 539 in PA
Livability — North Whitehall
No livability data for this city. (Only ~50 U.S. cities are tracked.)
Census & demographics
- Population (ZIP)
- 7,459
Population outlook (Lehigh County) Hauer SSP2
- Today (2025)
- 392,957 people
- By 2030
- 408,319 · +3.9%
- By 2040
- 440,007 · +12.0%
- By 2050
- 475,940 · +21.1%
- By 2075
- 590,448 · +50.3%
- By 2100
- 690,314 · +75.7%
Race, ethnicity, and origin ACS 2023
- Neighborhood character
- Predominantly White (84%)
- Race & ethnicity
- White 84% Hispanic / Latino 13% Two or more races 11%
- Hispanic origin (detail)
- Puerto Rican 8%
- Common ancestry
- Romanian 7% Danish 4% Polish 3%
- Foreign-born
- 3% · Canada
- Languages at home
- 94% English-only · Spanish 4% Arabic 1% Other Indo-European 1%
Political lean MEDSL · Lehigh
- 2024 margin
- Toss-up / Even · D 50.7% · R 48.0% · Other 1.2%
- 2008→2024 swing
- -12.9pp toward R · 2008: 15.6pp · 2024: 2.7pp
- All cycles
- 2024: D+2.7 2020: D+7.6 2016: D+4.4 2012: D+7.5 2008: D+15.6
Not yet ingested
- Civics
- —
Market trends
- HPI YoY
- ▼ -92.12%
- Current HPI
- 289.8882
- Rent YoY
- —
- Metro
- —
- State GDP YoY
- ▲ 1.68%
- F500 in state
- 34
Industry mix (Fortune 500 HQ in PA)
| Industry | F500 HQs | Revenue |
|---|---|---|
| Healthcare | 2 | $309B |
|
||
| Insurance | 2 | $27B |
|
||
| Telecommunications / Media | 1 | $124B |
|
||
| Industrial Distribution | 1 | $22B |
|
||
| Financial Services | 1 | $20B |
|
||
| Chemicals / Materials | 1 | $18B |
|
||
Price history
-12.1% since first listed19 events — show timeline
- 2026-05-29 Listed $65,900 GLVRMLS
- 2025-12-01 Pending — BRIGHT MLS
- 2025-12-01 Pending — GLVRMLS
- 2025-12-01 Listing Removed — BRIGHT MLS
- 2025-11-07 Listing Removed — GLVRMLS
- 2025-10-07 Listed $69,900 BRIGHT MLS
- 2025-10-07 Listed $69,900 GLVRMLS
- 2025-04-03 Listing Removed — BRIGHT MLS
- 2025-04-03 Listing Removed — GLVRMLS
- 2025-03-29 Listed $69,900 BRIGHT MLS
- 2025-03-27 Coming Soon — BRIGHT MLS
- 2025-03-26 Listed $69,900 GLVRMLS
- 2023-02-06 Sold (MLS) $60,000 PMAR
- 2023-02-06 Sold (MLS) $60,000 GLVRMLS
- 2023-01-13 Pending — GLVRMLS
- 2022-11-21 Price Changed $69,000 GLVRMLS
- 2022-11-20 Price Changed $69,000 PMAR
- 2022-10-30 Listed $75,000 PMAR
- 2022-10-30 Listed $75,000 GLVRMLS
Cash-flow waterfall
monthlySold comps — $/sqft
last 12 mo · ≤1 miLoading sold comps…