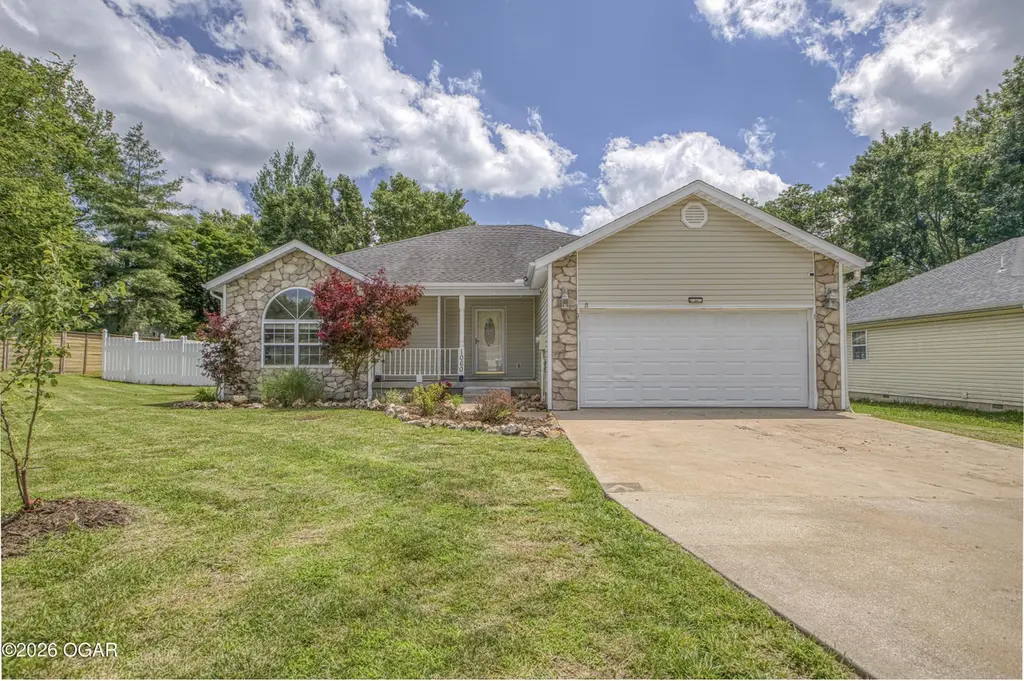
1060 Millruss Pl · Oronogo, MO
Flood risk 4/10 · Minor
- FEMA flood zone
- X (unshaded)
- Chance of flooding over 30 yrs
- 0.2%
- Est. flood insurance / yr
- $507 – $1,088
Fire risk 4/10 · Minor
- Est. fire insurance / yr
- $1,054 – $1,958
Heat risk 5/10 · Moderate
- Hot days now (above 107°F)
- 7 days/yr
- Hot days in 30 yrs
- 20 days/yr
Wind risk 2/10 · Minimal
- Chance of severe wind over 30 yrs
- 2.0%
Air-quality risk 2/10 · Minimal
- Unhealthy air days now
- 1 days/yr
- Unhealthy air days in 30 yrs
- 1 days/yr
Risk factors via First Street. Map © Google.
Why this score? — see what drove the D grade
The composite is a weighted blend of 9 inputs, each scored 0–100. Each bar is that input's sub-score; the figure is the points it added to the 100-point composite (weight × sub-score).
- Appreciation +10.0/10.0
- ARV discount +7.5/15.0
- Cash flow +7.3/30.0
- Schools +4.8/10.0
- Livability +3.5/5.0
- Rent growth +2.5/5.0
- Condition / age +2.5/5.0
- DSCR +1.4/10.0
- 1% rule +0.9/10.0
$268,000
🖨 Deal sheet 📄 Offer letter ✓ Due diligence
Listing remarks
Welcome home to Greenwood Estates! This charming 3 bedroom, 2 bath home features a desirable split floor plan designed for comfort and privacy. The spacious living areas are filled with natural light, creating a warm and inviting atmosphere throughout. Situated on a quiet cul-de-sac, enjoy reduced traffic and a peaceful setting. With a storm shelter in the attached 2-car garage, a large privacy-fenced backyard, and convenient location, this home combines comfort, functionality and accessibility. Don't miss a chance to see all this home has to offer and schedule a private tour today!
Key facts
- Quiet cul-de-sac
- Split floor plan
- Natural light
Tags
Property features AI
Exterior
- Parking: Attached 2-car garage; Garage door opener
- Security: Smoke detectors
- Utilities: Public sewer
- Home design: Single family residence (freestanding)
- Construction: Vinyl siding; Block foundation; Built as residential single-family
- Exterior features: Covered porch; Privacy fencing; Shingle roof; Level topography; Lot located on a cul-de-sac; Landscaped yard
Interior
- Kitchen: Electric range; Dishwasher
- Bedrooms: Total rooms: 8
- Flooring: Carpet; Vinyl
- Bathrooms: 2 full bathrooms
- Heating & cooling: Central heating; Ceiling fan(s) for cooling
- Interior features: Ceiling fans; Kitchen island; Walk-in closets
Neighborhood map
What this means for you Summary
Snapshot
- This is a 3-bed/2.0-bath other listed at $268k.
Deal economics
- At list price, monthly cash flow is $-362 ($-4k/yr) — negative.
- To cash-flow at today's rent, offer at most $204k (23.9% below list).
- To meet the 1% rule (rent ≥ 1% of price), the offer needs to be $159k (40.5% below list).
- Recommended offer: $159k (40.5% below list) — sets the bar for 1% rule.
Location & tenants
- Location reads 69/100 on livability (#156 in MO) — a middle-class / working-renter tenant base. Strengths: crime A+, cost of living A+, housing A+; Watch: amenities F, commute F, health & safety D-.
- Webb City R-VII (suburban): math 53% / reading 60% proficiency, ranked #21 of 324 in MO (top 6%) — acceptable for families but not a draw, mixed tenant base, ~2y average lease.
- Zoned schools: Webb City Middle (math 53% / reading 55%, grade B-, #46 of 391 statewide, top 12%, 696 students, 47% FRL).
- Market conditions: 20 active listings in the ZIP; 5 comparable units currently listed for rent nearby; rentals at typical pace (median 21d on market — plan ~3-4 weeks tenant-placement turnaround); 602 units permitted in Jasper County in 2024 (0 in 5+ unit buildings).
Forward outlook
- In year one you build about $29k of equity ($2k loan paydown + $27k appreciation (10.0% local appreciation)).
- By year 2, paydown + projected appreciation supports a ~$46k cash-out refi (75% LTV) — recoverable capital for the next deal without selling this one.
Negotiation context
- Only 7 days on market — expect competitive offers; lowballing is unlikely to land.
Risks & watch-outs
- Climate carrying-cost: extreme-heat days projected 7→20/yr by 2055 (HVAC capex compounding) — expect insurance premiums to compound above CPI over the hold.
Questions for the listing agent
- What do current leases actually rent for vs. the listed asking? Can we see a recent rent roll and the last 12 months of T-12 income?
- Is there a deadline driving the sale (1031 exchange, divorce, estate, relocation)? That informs how much negotiation room exists.
- Schools are F-rated, which usually means shorter tenancies and higher turnover. Who's the typical renter profile here, and what's been the actual vacancy rate?
- The area grade is low — what's the realistic commute time and amenity access for the typical tenant pool here? Any planned neighborhood developments (good or bad) we should know about?
- What's the average days-on-market for RENTAL listings here right now (not sales)? A rising rental-DOM trend means longer vacancies and softer asking-rent achievability than the comps imply.
- What's the recent tenant-quality profile in this submarket — average credit score on applications, eviction rate, late-payment / NSF rate, and stable-employment percentage? A property-management company in the area should have these aggregated.
- How much new for-sale + rental construction is in the pipeline within 1–3 miles? Heavy new supply typically softens prices + rents 12–24 months out; constrained supply supports both.
Investment metrics
- 1% rule
- 0.59% ✗
- Cap rate
- 4.67%
- Cash-on-cash
- -5.79%
- DSCR
- 0.74
- GRM
- 14.0
CMA / ARV
No comps found within radius.
Projected returns pro-forma
10.0% appreciation · 3.0% rent growth · sell at horizon
- IRR
- 20.2%
- Equity multiple
- 2.64×
- Total profit
- $122,762
- Equity at exit
- $241,436
- IRR
- 18.4%
- Equity multiple
- 6.06×
- Total profit
- $379,430
- Equity at exit
- $520,665
Cash invested: $75,040 (down + closing). Projections, not guarantees.
Landlord ↔ Tenant lean methodology
- Overall (STATE)
- 81 Strongly Landlord-Friendly
- State Missouri
- 81 Strongly Landlord-Friendly · R+10
- County
- — inherits STATE
- City
- — inherits STATE
ZIP-level market 64855
- Home prices YoY
- 4.7%
- Active inventory
- 20
- Price-to-rent
- 14.0×
Monthly cashflow live
- Estimated rent
- $1,593 high interval (Pro) →
- Mortgage (P&I)
- −$1,405
- Tax from tax record
- −$104 /mo · $1,248/yr
- Insurance
- −$112
- HOA
- −$0
- Vacancy / Maint / Mgmt
- −$335
- Net cashflow
- $-362
Break-even live
UW: 25.0% down · 7.5% · 30yr · 1.5% tax · 5.0% vac · 8.0% maint · 8.0% mgmt
Financing live
Cash to close
- Down payment
- $67,000
- Closing costs
- $8,040
- Reserves months
- —
- Total cash needed
- —
Loan-product check · same deal, 3 products live
Conventional
25% down · 7.5% · 30yr
- Down + closing
- —
- Monthly P&I
- —
- Monthly cashflow
- —
- DSCR
- —
- Eligible?
- —
Personal DTI + credit; lowest rate.
DSCR
20% down · 8.5% · 30yr
- Down + closing
- —
- Monthly P&I
- —
- Monthly cashflow
- —
- DSCR
- —
- Eligible?
- —
No personal income docs; deal must DSCR.
Hard money
10% down · 12.0% · 12mo
- Down + closing
- —
- Monthly P&I
- —
- Monthly cashflow
- —
- DSCR
- —
- Eligible?
- —
Short-term bridge; refi at stabilization.
Rent comps 5 comps
| Address | Beds | Baths | Sqft | Rent | $/sqft | DOM | Units | Dist |
|---|---|---|---|---|---|---|---|---|
| 606 Sarah Ct Oronogo, MO | 3.0 | 2.0 | 1448 | $1,700 | $1.17 | 21d | 1 | 0.86mi |
| 745 Short Leaf Ln Oronogo, MO | 3.0 | 2.0 | 1422 | $1,550 | $1.09 | 21d | 1 | 0.88mi |
| 1100 Pawpaw Oronogo, MO | 3.0 | 2.0 | 1211 | $1,550 | $1.28 | 21d | 1 | 1.00mi |
| 609 Short Leaf Ln Oronogo, MO | 3.0 | 2.0 | 1445 | $1,400 | $0.97 | 21d | 1 | 1.02mi |
| 1101 Downy Dr Oronogo, MO | 4.0 | 2.0 | 1423 | $1,749 | $1.23 | 21d | 1 | 1.02mi |
Listing history 8 events
-
2026-06-19days on market $268,000 Active 7 DOM
-
2026-06-18days on market $268,000 Active 6 DOM
-
2026-06-17days on market $268,000 Active 5 DOM
-
2026-06-16days on market $268,000 Active 4 DOM
-
2026-06-15days on market $268,000 Active 3 DOM
-
2026-06-14remarks 589-char remark
-
2026-06-13remarks 543-char remark
-
2026-06-13$268,000 Active 1 DOM
ⓘ Source: listings_history table (triggers on properties + properties_extension) + one-shot
backfill from property_details.listing_events for pre-trigger history.
Tax reassessment forecast MO · Resets to sale price
- Current annual tax
- $1,248 · $104/mo
- Projected year-2 tax
- $2,600 · $217/mo
- Expected delta
- +$1,351/yr (+$113/mo · 108.3%)
ⓘ Screening estimate from a state-policy table — verify with the county assessor before closing.
Climate risk First Street
- Flood 4/10 Moderate FEMA zone X (unshaded) · 20% chance over 30 yrs
- Wildfire 4/10 Moderate
- Heat 5/10 Major 7 d/yr ≥107°F today · 20 d/yr by 30 yrs out
- Wind 2/10 Low 2% chance of damaging wind over 30 yrs
- Air quality 2/10 Low 1 unhealthy d/yr today · 1 by 30 yrs out
Nearby sold comps map
Loading sold comps map…
Walkable amenities ~0.75 mi
Loading nearby amenities…
Taxation est. · year 1
- Rental income
- $19,120
- − Mortgage interest
- −$15,012
- − Property taxes
- −$1,248
- − Insurance
- −$1,340
- − Repairs & maintenance
- −$1,530
- − Management
- −$1,530
- − Depreciation
- −$7,796
- Taxable loss
- −$9,336
- Est. tax savings @ 24.0%
- +$2,241
- After-tax cash flow
- $-2,108/yr
For passive investors: Depreciation is non-cash, so a rental often shows a tax loss while cash-flowing — sheltering income. Rental losses are passive: they offset passive income freely, and up to $25,000/yr can offset ordinary (W-2) income if you actively participate and your MAGI is under $100k (phasing out to $0 by $150k); unused losses carry forward. On sale, claimed depreciation is recaptured at up to 25%, and gains may owe capital-gains tax (a 1031 exchange can defer both). Figures are a year-1 estimate at your 24.0% rate — not tax advice; consult a CPA.
Schools (NCES district)
- District
- Webb City R-VII
- NCES district ID
- 2931500
- Math proficiency
- 53% ▼ -1.00%
- Reading proficiency
- 60% ▼ -1.00%
- Median HH income
- $45,022
- Composite
- 47.68/100
- National rank
- #2244
- State rank
- #21 of 324 in MO
Livability — Oronogo
- Score
- 69/100
- State rank
- #156
- US rank
- #8706
Category grades
Schools grade is shown separately in the Schools card above.
Census & demographics
- Census place
- Oronogo, MO
- City population
- 16,360
- Population (ZIP)
- 2,629
Population outlook (Jasper County) Hauer SSP2
- Today (2025)
- 120,033 people
- By 2030
- 120,091 · +0.0%
- By 2040
- 119,297 · -0.6%
- By 2050
- 117,705 · -1.9%
- By 2075
- 110,402 · -8.0%
- By 2100
- 99,719 · -16.9%
Race, ethnicity, and origin ACS 2023
- Neighborhood character
- Predominantly White (92%)
- Race & ethnicity
- White 92% Two or more races 7% Hispanic / Latino 5%
- Common ancestry
- Scottish 2% Italian 1% Slovak 1%
- Foreign-born
- 0% · China
Political lean MEDSL · Jasper
- 2024 margin
- Solid R (+46.8) · D 25.9% · R 72.7% · Other 1.4%
- 2008→2024 swing
- -13.6pp toward R · 2008: -33.2pp · 2024: -46.8pp
- All cycles
- 2024: R+46.8 2020: R+46.2 2016: R+50.8 2012: R+41.0 2008: R+33.2
Not yet ingested
- Civics
- —
Market trends
- HPI YoY
- ▲ 11.47%
- Current HPI
- 254.495
- Rent YoY
- —
- Metro
- —
- State GDP YoY
- ▲ 1.84%
- F500 in state
- 20
Industry mix (Fortune 500 HQ in MO)
| Industry | F500 HQs | Revenue |
|---|---|---|
| Healthcare | 1 | $163B |
|
||
| Insurance | 1 | $21B |
|
||
| Industrial Technology | 1 | $17B |
|
||
| Retail | 1 | $16B |
|
||
| Industrial Distribution | 1 | $10B |
|
||
| Utilities | 1 | $9B |
|
||
Price history
2 events — show timeline
- 2026-06-12 Listed $268,000 OGAR
- 2004-09-14 Sold (Public Records) — Public Records
Property tax history
+2.0%/yrLatest (2025): $1,248 · +4.8% YoY. Source: county tax records.
Cash-flow waterfall
monthlySold comps — $/sqft
last 12 mo · ≤1 miLoading sold comps…