 Duplex
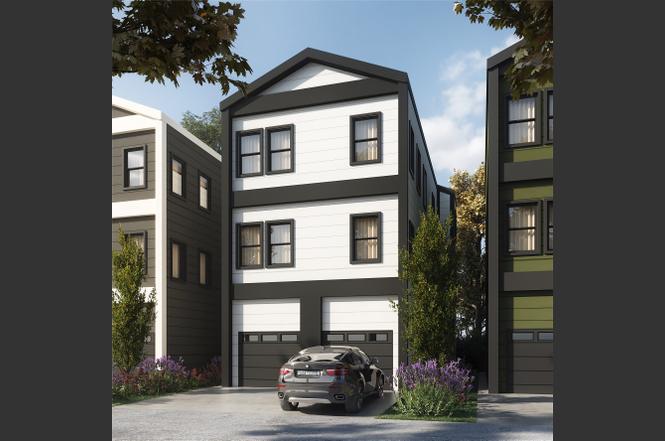
3326 Stassen St Unit AB · Houston, TX
Flood risk No data
- FEMA flood zone
- —
- Chance of flooding over 30 yrs
- —
- Est. flood insurance / yr
- —
Fire risk No data
- Est. fire insurance / yr
- —
Heat risk No data
- Hot days now (above threshold)
- —
- Hot days in 30 yrs
- —
Wind risk No data
- Chance of severe wind over 30 yrs
- —
Air-quality risk No data
- Unhealthy air days now
- —
- Unhealthy air days in 30 yrs
- —
Risk factors via First Street. Map © Google.
Why this score? — see what drove the F grade
The composite is a weighted blend of 9 inputs, each scored 0–100. Each bar is that input's sub-score; the figure is the points it added to the 100-point composite (weight × sub-score).
- Appreciation +10.0/10.0
- Cash flow +6.1/30.0
- Rent growth +3.7/5.0
- Livability +3.7/5.0
- Schools +2.7/10.0
- Condition / age +2.5/5.0
- 1% rule +1.4/10.0
- DSCR +0.5/10.0
- ARV discount +0.0/15.0
$699,000
🖨 Deal sheet 📄 Offer letter ✓ Due diligence
Multi-family units
County records classify this as Multi-Family (2-4 Unit). Listing-text estimate: 2 units. confirmed
Listing remarks
Discover the perfect blend of comfort, convenience, and community in this charming home at 3326 Stassen St. Located just minutes from Downtown Houston and major shopping destinations, this home offers easy access to dining, entertainment, and business hubs. Enjoy the privacy and quiet of a well-maintained neighborhood while staying connected to everything Houston has to offer. With quick access to Highway 288 and 610, commuting or weekend getaways are simple and convenient. Ideal for families or roommates, this duplex is close to excellent schools, parks, and recreational areas—offering the perfect balance of suburban tranquility and urban accessibility.
Key facts
- Close to parks
- Quick access to 610
- Built 2023
Tags
Neighborhood map
What this means for you Summary
Snapshot
- This is a 2 × 3-bed/2.0-bath units multifamily listed at $699k.
Deal economics
- At list price, monthly cash flow is $-1k ($-15k/yr) — negative. Per door: $-645/mo.
- To cash-flow at today's rent, offer at most $512k (26.7% below list).
- To meet the 1% rule (rent ≥ 1% of price), the offer needs to be $448k (35.9% below list).
- Recommended offer: $448k (35.9% below list) — sets the bar for 1% rule.
- Cap rate 4.1% vs local median 3.2% in Houston — meaningfully above typical; check what's discounted (condition, days-on-market, listing class) to confirm the premium yield is real.
Location & tenants
- Location reads 74/100 on livability (#184 in TX, #4,771 nationally) — a middle-class / working-renter tenant base. Strengths: amenities A+, cost of living A+, housing A+; Watch: crime F.
- Houston ISD (urban): math 27% / reading 35% proficiency, ranked #593 of 826 in TX (top 72%) — families likely to look elsewhere, expect single-tenant / working-renter base with shorter leases; 71% free/reduced lunch — lower-income household profile, screen leases tightly.
- Zoned schools: Lawson Middle (math 21% / reading 27%, grade F, #1,301 of 1,662 statewide, top 79%, 1,274 students, 96% FRL); Worthing H S (math 22% / reading 21%, grade F, #1,377 of 1,632 statewide, top 85%, 827 students, 96% FRL) — zoned schools average 96% FRL vs 71% district-wide (25 pts higher); higher-poverty schools than district average — tighter screening recommended.
- Market conditions: Rents rising fast (+4.8%/yr); 312 active listings in the ZIP; lower-income renter base — watch delinquency; 29,883 units permitted in Harris County in 2024 (8,621 in 5+ unit buildings).
- At $4,483/mo this rent would consume 144% of the median local household income ($37k/yr) (locally 1446% of renters already pay >50% of income on rent) — very limited rent-growth headroom before tenants either downsize or default.
Forward outlook
- In year one you build about $75k of equity ($5k loan paydown + $70k appreciation (10.0% local appreciation)).
- Harris County population projected at +47% by 2050 — long-run rental-demand tailwind backs the buy-and-hold thesis.
- By year 2, paydown + projected appreciation supports a ~$120k cash-out refi (75% LTV) — recoverable capital for the next deal without selling this one.
Negotiation context
- Only 1 days on market — expect competitive offers; lowballing is unlikely to land.
Questions for the listing agent
- What do current leases actually rent for vs. the listed asking? Can we see a recent rent roll and the last 12 months of T-12 income?
- Can we see the unit-by-unit rent roll, current vacancy, and any below-market leases? What's the average tenancy length?
- What capital expenditures (roof, boiler, parking lot, exteriors) have been made in the last 5 years, and what's planned in the next 2?
- Is there a deadline driving the sale (1031 exchange, divorce, estate, relocation)? That informs how much negotiation room exists.
- Schools are D-rated, which usually means shorter tenancies and higher turnover. Who's the typical renter profile here, and what's been the actual vacancy rate?
- Crime grade is F in this area — have there been break-ins, vandalism, or insurance claims at this property in the last 3 years? What carrier currently insures it and at what premium?
- The area grade is low — what's the realistic commute time and amenity access for the typical tenant pool here? Any planned neighborhood developments (good or bad) we should know about?
- What's the average days-on-market for RENTAL listings here right now (not sales)? A rising rental-DOM trend means longer vacancies and softer asking-rent achievability than the comps imply.
- What's the recent tenant-quality profile in this submarket — average credit score on applications, eviction rate, late-payment / NSF rate, and stable-employment percentage? A property-management company in the area should have these aggregated.
- How much new apartment / multifamily construction is in the pipeline within 1–3 miles? Heavy new supply (>2% of stock underway) typically softens rents 12–24 months out; light construction supports rent growth.
Investment metrics
- 1% rule
- 0.64% ✗
- Cap rate
- 4.08%
- Cash-on-cash
- -7.90%
- DSCR
- 0.65
- GRM
- 13.0
CMA / ARV
- ARV (on-the-fly)
- $507,338
- Comps found
- 6
Show comp detail 6 sales within ~0.75 mi
| Address | Dist | Beds/Ba | Sqft | Sold | Price | $/sf | Match |
|---|---|---|---|---|---|---|---|
| 3833 Mckinley St | 0.52mi | 6/4.0 | 3,240 (+1%) | 17mo | $479,500 | $148 | 60 |
| 8206 Bassett St Unit A | 0.28mi | 6/4.0 | 2,746 (-14%) | 8mo | $409,000 | $149 | 56 |
| 4019 Stassen St Unit A B | 0.63mi | 6/4.0 | 3,356 (+4%) | 12mo | $589,900 | $176 | 52 |
| 8328 Mariah St | 0.26mi | 6/2.0 | 3,519 (+10%) | 17mo | $555,000 | $158 | 50 |
| 8326 Mariah St | 0.25mi | 6/2.0 | 3,519 (+10%) | 18mo | $555,000 | $158 | 50 |
| 8718 Scott St Unit A B | 0.67mi | 6/4.0 | 3,440 (+7%) | 10mo | $399,000 | $116 | 49 |
Match score weights: distance 35% · size 25% · config 20% · recency 20%. Top-matched comps best support the ARV.
Projected returns pro-forma
10.0% appreciation · 4.77% rent growth · sell at horizon
- IRR
- 19.2%
- Equity multiple
- 2.57×
- Total profit
- $306,785
- Equity at exit
- $629,715
- IRR
- 18.0%
- Equity multiple
- 6.04×
- Total profit
- $985,845
- Equity at exit
- $1,358,003
Cash invested: $195,720 (down + closing). Projections, not guarantees.
Landlord ↔ Tenant lean methodology
- Overall (STATE)
- 87 Strongly Landlord-Friendly
- State Texas
- 87 Strongly Landlord-Friendly · R+5
- County
- — inherits STATE
- City
- — inherits STATE
ZIP-level market 77051
- Home prices YoY
- 9.7%
- Rents YoY
- 4.8%
- Active inventory
- 312
- Price-to-rent
- 26.0×
Monthly cashflow live
- Estimated rent
- $4,483 high interval (Pro) →
- Mortgage (P&I)
- −$3,666
- Tax est. 1.5%
- −$874 /mo · $10,485/yr
- Insurance
- −$291
- HOA
- −$0
- Vacancy / Maint / Mgmt
- −$941
- Net cashflow
- $-1,289
Break-even live
2-unit breakdown (identical units grouped — click to expand)
| Units | Beds | Baths | Est. rent |
|---|---|---|---|
| 2× units | 3 | 2 | $4,484 |
| #1 | 3 | 2 | $2,242 |
| #2 | 3 | 2 | $2,242 |
| Total (2 units) | $4,483 | ||
UW: 25.0% down · 7.5% · 30yr · 1.5% tax · 5.0% vac · 8.0% maint · 8.0% mgmt
Financing live
Cash to close
- Down payment
- $174,750
- Closing costs
- $20,970
- Reserves months
- —
- Total cash needed
- —
Loan-product check · same deal, 3 products live
Conventional
25% down · 7.5% · 30yr
- Down + closing
- —
- Monthly P&I
- —
- Monthly cashflow
- —
- DSCR
- —
- Eligible?
- —
Personal DTI + credit; lowest rate.
DSCR
20% down · 8.5% · 30yr
- Down + closing
- —
- Monthly P&I
- —
- Monthly cashflow
- —
- DSCR
- —
- Eligible?
- —
No personal income docs; deal must DSCR.
Hard money
10% down · 12.0% · 12mo
- Down + closing
- —
- Monthly P&I
- —
- Monthly cashflow
- —
- DSCR
- —
- Eligible?
- —
Short-term bridge; refi at stabilization.
Listing history 2 events
-
2025-11-14status Pending
-
2025-11-13$699,000 Active
ⓘ Source: listings_history table (triggers on properties + properties_extension) + one-shot
backfill from property_details.listing_events for pre-trigger history.
Nearby sold comps map
Loading sold comps map…
Walkable amenities ~0.75 mi
Loading nearby amenities…
Taxation est. · year 1
- Rental income
- $53,796
- − Mortgage interest
- −$39,155
- − Property taxes
- −$10,485
- − Insurance
- −$3,495
- − Repairs & maintenance
- −$4,304
- − Management
- −$4,304
- − Depreciation
- −$20,335
- Taxable loss
- −$28,281
- Est. tax savings @ 24.0%
- +$6,787
- After-tax cash flow
- $-8,681/yr
For passive investors: Depreciation is non-cash, so a rental often shows a tax loss while cash-flowing — sheltering income. Rental losses are passive: they offset passive income freely, and up to $25,000/yr can offset ordinary (W-2) income if you actively participate and your MAGI is under $100k (phasing out to $0 by $150k); unused losses carry forward. On sale, claimed depreciation is recaptured at up to 25%, and gains may owe capital-gains tax (a 1031 exchange can defer both). Figures are a year-1 estimate at your 24.0% rate — not tax advice; consult a CPA.
Schools (NCES district)
- District
- Houston ISD
- NCES district ID
- 4823640
- Math proficiency
- 27% ▼ -18.00%
- Reading proficiency
- 35% ▼ -6.00%
- Median HH income
- $46,054
- Composite
- 26.63/100
- National rank
- #7173
- State rank
- #593 of 826 in TX
Livability — Houston
- Score
- 74/100
- State rank
- #184
- US rank
- #4771
Category grades
Schools grade is shown separately in the Schools card above.
Census & demographics
- Census place
- Houston, TX
- County
- Harris County · 4,702,590 people
- City population
- 3,226,434
- Metro
- Houston-The Woodlands-Sugar Land, TX
- Population (ZIP)
- 19,795
- Household income
- $37,415
- Rent vs Own
- Severe rent burden
- 1446.0
Population outlook (Harris County) Hauer SSP2
- Today (2025)
- 5,571,493 people
- By 2030
- 6,089,821 · +9.3%
- By 2040
- 7,142,806 · +28.2%
- By 2050
- 8,185,864 · +46.9%
- By 2075
- 10,574,329 · +89.8%
- By 2100
- 12,109,958 · +117.4%
Race, ethnicity, and origin ACS 2023
- Neighborhood character
- Predominantly Black (77%)
- Race & ethnicity
- Black 77% Hispanic / Latino 16% Two or more races 11% White 3%
- Hispanic origin (detail)
- Mexican 6% Puerto Rican 1%
- Foreign-born
- 8% · Canada, China
- Languages at home
- 88% English-only · Spanish 10%
Political lean MEDSL · Harris
- 2024 margin
- Lean D (+5.5) · D 52.0% · R 46.4% · Other 1.6%
- 2008→2024 swing
- +3.9pp toward D · 2008: 1.6pp · 2024: 5.5pp
- All cycles
- 2024: D+5.5 2020: D+13.3 2016: D+12.4 2012: D+0.1 2008: D+1.6
Not yet ingested
- Civics
- —
Market trends
- HPI YoY
- ▲ 16.02%
- Current HPI
- 180.4283
- Rent YoY
- ▲ 4.77%
- Metro
- Houston-The Woodlands-Sugar Land, TX
- State GDP YoY
- ▲ 3.95%
- F500 in state
- 110
Industry mix (Fortune 500 HQ in TX)
| Industry | F500 HQs | Revenue |
|---|---|---|
| Energy | 16 | $1,198B |
|
||
| Technology | 5 | $198B |
|
||
| Engineering / Construction | 4 | $72B |
|
||
| Energy Services | 3 | $60B |
|
||
| Utilities | 3 | $41B |
|
||
| Healthcare | 2 | $330B |
|
||
Price history
2 events — show timeline
- 2025-11-14 Pending — HARMLS
- 2025-11-13 Listed $699,000 HARMLS
Cash-flow waterfall
monthlySold comps — $/sqft
last 12 mo · ≤1 miLoading sold comps…