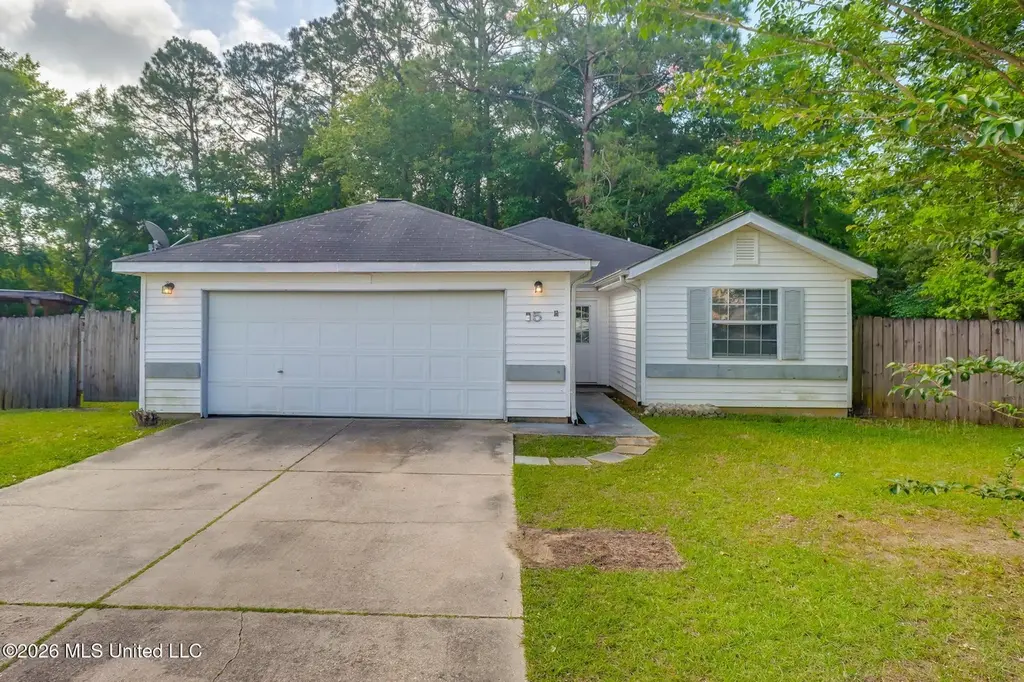
5 Michael Ct · Long Beach, MS
Flood risk 4/10 · Minor
- FEMA flood zone
- X (unshaded)
- Chance of flooding over 30 yrs
- 0.2%
- Est. flood insurance / yr
- $507 – $1,088
Fire risk 1/10 · Minimal
- Est. fire insurance / yr
- $1,241 – $2,305
Heat risk 10/10 · Severe
- Hot days now (above 106°F)
- 7 days/yr
- Hot days in 30 yrs
- 23 days/yr
Wind risk 9/10 · Severe
- Chance of severe wind over 30 yrs
- 99.0%
Air-quality risk 1/10 · Minimal
- Unhealthy air days now
- 0 days/yr
- Unhealthy air days in 30 yrs
- 0 days/yr
Risk factors via First Street. Map © Google.
Why this score? — see what drove the C+ grade
The composite is a weighted blend of 9 inputs, each scored 0–100. Each bar is that input's sub-score; the figure is the points it added to the 100-point composite (weight × sub-score).
- Cash flow +24.1/30.0
- ARV discount +12.8/15.0
- DSCR +7.8/10.0
- 1% rule +6.2/10.0
- Schools +4.4/10.0
- Livability +3.5/5.0
- Rent growth +3.0/5.0
- Condition / age +2.5/5.0
- Appreciation +0.0/10.0
$145,000
🖨 Deal sheet 📄 Offer letter ✓ Due diligence
Listing remarks MLS
Precious home in the heart of Long Beach. Freshly painted and cozy fireplace! Move in ready with new butcher block counter tops, new kitchen cabinets, new doors and new bathroom vanities. Split bedroom plan. Must see this cutie! To take the 3D virtual tour, copy/paste this link: https://my.matterport.com/show/?m=mhbgT6ESZud
Key facts
- 9,583 sq ft lot
- 2 garage spots
- Built 1996
Neighborhood map
What this means for you Summary
Snapshot
- This is a 3-bed/1.0-bath single-family listed at $145k.
Deal economics
- At list price, monthly cash flow is $287 ($3k/yr) — positive.
- The deal already cash-flows at list — no discount required.
- Meets the 1% rule at list price ($2k rent vs $145k).
- Cap rate 8.7% vs local median 4.6% in Long Beach — top-decile yield for the area; either an underpriced asset or a hidden risk that comps aren't pricing in. Stress-test before assuming the spread holds.
Location & tenants
- Location reads 69/100 on livability (#52 in MS) — a middle-class / working-renter tenant base. Strengths: crime A+, cost of living A+, housing A+; Watch: amenities F, commute F, health & safety F.
- Long Beach School District (suburban): math 52% / reading 50% proficiency, ranked #9 of 130 in MS (top 7%) — acceptable for families but not a draw, mixed tenant base, ~2y average lease.
- Market conditions: Rents rising (+1.9%/yr); 311 active listings in the ZIP; 3 comparable units currently listed for rent nearby; rentals leasing fast (median 14d on market — plan ~1-2 weeks tenant-placement turnaround); 2,194 units permitted in Harrison County in 2024 (0 in 5+ unit buildings).
Forward outlook
- Local home prices are declining (-3.0%/yr); year-one equity from $1k of loan paydown is wiped out by about $4k of value loss. Plan a longer hold.
- Harrison County population projected at +27% by 2050 — long-run rental-demand tailwind backs the buy-and-hold thesis.
Negotiation context
- Only 2 days on market — expect competitive offers; lowballing is unlikely to land.
- 3 sale attempts since 11y ago with the ask held roughly flat each time — persistent listings suggest the price (not the market) is what's stuck; bring a comps-based counter.
- Current owner paid $54k; list at $145k implies a 171% gain — meaningful room to come down on a strong offer.
Risks & watch-outs
- Climate carrying-cost: severe wind risk, 99% chance of damaging wind over 30y; extreme-heat days projected 7→23/yr by 2055 (HVAC capex compounding) — expect insurance premiums to compound above CPI over the hold.
Questions for the listing agent
- Is there a deadline driving the sale (1031 exchange, divorce, estate, relocation)? That informs how much negotiation room exists.
- Schools are B-rated — typically a magnet for longer-tenancy family renters. What's the average tenant stay here, and is there a school-zone premium baked into asking?
- What's the average days-on-market for RENTAL listings here right now (not sales)? A rising rental-DOM trend means longer vacancies and softer asking-rent achievability than the comps imply.
- What's the recent tenant-quality profile in this submarket — average credit score on applications, eviction rate, late-payment / NSF rate, and stable-employment percentage? A property-management company in the area should have these aggregated.
- How much new for-sale + rental construction is in the pipeline within 1–3 miles? Heavy new supply typically softens prices + rents 12–24 months out; constrained supply supports both.
Investment metrics
- 1% rule
- 1.12% ✓
- Cap rate
- 8.67%
- Cash-on-cash
- 8.49%
- DSCR
- 1.38
- GRM
- 7.4
CMA / ARV
- ARV (on-the-fly)
- $164,547
- Comps found
- 12
Show comp detail 12 sales within ~0.75 mi
| Address | Dist | Beds/Ba | Sqft | Sold | Price | $/sf | Match |
|---|---|---|---|---|---|---|---|
| 108 Mount Bass | 0.17mi | 3/1.5 | 1,239 (+6%) | 3mo | $175,000 | $141 | 77 |
| 267 Alexander Rd | 0.33mi | 3/1.0 | 1,107 (-5%) | 8mo | $95,000 | $86 | 70 |
| 128 Mount Bass | 0.28mi | 3/1.5 | 1,043 (-11%) | 0mo | $159,999 | $153 | 67 |
| 117 Gandy Cir | 0.27mi | 3/1.0 | 1,300 (+11%) | 7mo | $133,000 | $102 | 62 |
| 8 Linda Ln | 0.56mi | 3/1.5 | 1,200 (+3%) | 6mo | $65,000 | $54 | 62 |
| 106 Dearman Ave | 0.46mi | 2/1.0 (-1) | 1,223 (+5%) | 5mo | $125,000 | $102 | 62 |
| 305 Rita Ln | 0.58mi | 3/2.0 | 1,287 (+10%) | 3mo | $175,350 | $136 | 49 |
| 20 Oakmont Pl | 0.47mi | 3/2.0 | 1,296 (+11%) | 8mo | $170,000 | $131 | 49 |
| 225 Lynwood Cir | 0.44mi | 3/2.0 | 1,328 (+14%) | 8mo | $215,000 | $162 | 46 |
| 216 E 3rd | 0.67mi | 2/2.0 (-1) | 1,071 (-8%) | 3mo | $245,000 | $229 | 44 |
| 909 Latil St | 0.73mi | 3/2.0 | 1,290 (+10%) | 8mo | $204,900 | $159 | 38 |
| 110 Oak Gardens Ave | 0.66mi | 3/2.0 | 1,324 (+14%) | 9mo | $265,000 | $200 | 35 |
Match score weights: distance 35% · size 25% · config 20% · recency 20%. Top-matched comps best support the ARV.
Projected returns pro-forma
-3.0% appreciation · 1.93% rent growth · sell at horizon
- IRR
- -4.6%
- Equity multiple
- 0.83×
- Total profit
- $-6,913
- Equity at exit
- $21,620
- IRR
- 3.8%
- Equity multiple
- 1.26×
- Total profit
- $10,673
- Equity at exit
- $12,537
Cash invested: $40,600 (down + closing). Projections, not guarantees.
Landlord ↔ Tenant lean methodology
- Overall (STATE)
- 90 Strongly Landlord-Friendly
- State Mississippi
- 90 Strongly Landlord-Friendly · R+11
- County
- — inherits STATE
- City
- — inherits STATE
ZIP-level market 39560
- Home prices YoY
- -25.7%
- Rents YoY
- 1.9%
- Active inventory
- 311
- Price-to-rent
- 7.4×
Monthly cashflow live
- Estimated rent
- $1,623 medium interval (Pro) →
- Mortgage (P&I)
- −$760
- Tax from tax record
- −$174 /mo · $2,089/yr
- Insurance
- −$60
- HOA
- −$0
- Vacancy / Maint / Mgmt
- −$341
- Net cashflow
- $287
Break-even live
UW: 25.0% down · 7.5% · 30yr · 1.5% tax · 5.0% vac · 8.0% maint · 8.0% mgmt
Financing live
Cash to close
- Down payment
- $36,250
- Closing costs
- $4,350
- Reserves months
- —
- Total cash needed
- —
Loan-product check · same deal, 3 products live
Conventional
25% down · 7.5% · 30yr
- Down + closing
- —
- Monthly P&I
- —
- Monthly cashflow
- —
- DSCR
- —
- Eligible?
- —
Personal DTI + credit; lowest rate.
DSCR
20% down · 8.5% · 30yr
- Down + closing
- —
- Monthly P&I
- —
- Monthly cashflow
- —
- DSCR
- —
- Eligible?
- —
No personal income docs; deal must DSCR.
Hard money
10% down · 12.0% · 12mo
- Down + closing
- —
- Monthly P&I
- —
- Monthly cashflow
- —
- DSCR
- —
- Eligible?
- —
Short-term bridge; refi at stabilization.
Rent comps 3 comps
| Address | Beds | Baths | Sqft | Rent | $/sqft | DOM | Units | Dist |
|---|---|---|---|---|---|---|---|---|
| 303 Twin Lakes Blvd Long Beach, MS | 3.0 | 2.0 | 1233 | $2,000 | $1.62 | 13d | 1 | 1.00mi |
| 212 Lawler Ave Long Beach, MS | 2.0 | 1.0 | 822 | $1,250 | $1.52 | 13d | 1 | 1.10mi |
| 5596 Daugherty Rd Long Beach, MS | 3.0 | 2.0 | 1144 | $1,300 | $1.14 | 13d | 1 | 1.49mi |
Listing history 9 events
-
2026-06-19status $145,000 Active 2 DOM
-
2026-04-27status Pending
-
2026-04-25$145,000 Active
-
2021-10-14soldstatus
-
2021-10-08soldstatus 325-char remark
Show marketing remark (325 chars)
Precious home in the heart of Long Beach. Freshly painted and cozy fireplace! Move in ready with new butcher block counter tops, new kitchen cabinets, new doors and new bathroom vanities. Split bedroom plan. Must see this cutie! To take the 3D virtual tour, copy/paste this link: https://my.matterport.com/show/?m=mhbgT6ESZud
-
2021-08-24$137,000 325-char remark
Show marketing remark (325 chars)
Precious home in the heart of Long Beach. Freshly painted and cozy fireplace! Move in ready with new butcher block counter tops, new kitchen cabinets, new doors and new bathroom vanities. Split bedroom plan. Must see this cutie! To take the 3D virtual tour, copy/paste this link: https://my.matterport.com/show/?m=mhbgT6ESZud
-
2015-06-02soldstatus $53,500
-
2015-05-29soldstatus 288-char remark
Show marketing remark (288 chars)
Fannie mae homepath property, check out homepath.com. Cute home at back of cul de sac at great central Long Beach location. Close to everything. New paint and carpeting, garage has been enclosed into several different storage and work rooms. Great price for a first time buyer or investor
-
2015-01-26$63,000 288-char remark
Show marketing remark (288 chars)
Fannie mae homepath property, check out homepath.com. Cute home at back of cul de sac at great central Long Beach location. Close to everything. New paint and carpeting, garage has been enclosed into several different storage and work rooms. Great price for a first time buyer or investor
ⓘ Source: listings_history table (triggers on properties + properties_extension) + one-shot
backfill from property_details.listing_events for pre-trigger history.
Tax reassessment forecast MS · Resets to sale price
- Current annual tax
- $2,089 · $174/mo
- Projected year-2 tax
- $2,089 · $174/mo
- Expected delta
- $0/yr ($0/mo · 0.0%)
ⓘ Screening estimate from a state-policy table — verify with the county assessor before closing.
Climate risk First Street
- Flood 4/10 Moderate FEMA zone X (unshaded) · 20% chance over 30 yrs
- Wildfire 1/10 Low
- Heat 10/10 Extreme 7 d/yr ≥106°F today · 23 d/yr by 30 yrs out
- Wind 9/10 Extreme 99% chance of damaging wind over 30 yrs
- Air quality 1/10 Low 0 unhealthy d/yr today · 0 by 30 yrs out
Nearby sold comps map
Loading sold comps map…
Walkable amenities ~0.75 mi
Loading nearby amenities…
Taxation est. · year 1
- Rental income
- $19,475
- − Mortgage interest
- −$8,122
- − Property taxes
- −$2,089
- − Insurance
- −$725
- − Repairs & maintenance
- −$1,558
- − Management
- −$1,558
- − Depreciation
- −$4,218
- Taxable income
- $1,204
- Est. tax owed @ 24.0%
- −$289
- After-tax cash flow
- $3,157/yr
For passive investors: Depreciation is non-cash, so a rental often shows a tax loss while cash-flowing — sheltering income. Rental losses are passive: they offset passive income freely, and up to $25,000/yr can offset ordinary (W-2) income if you actively participate and your MAGI is under $100k (phasing out to $0 by $150k); unused losses carry forward. On sale, claimed depreciation is recaptured at up to 25%, and gains may owe capital-gains tax (a 1031 exchange can defer both). Figures are a year-1 estimate at your 24.0% rate — not tax advice; consult a CPA.
Schools (NCES district)
- District
- Long Beach School District
- NCES district ID
- 2802670
- Math proficiency
- 52% ▼ -8.00%
- Reading proficiency
- 50% ▼ -7.00%
- Median HH income
- $50,548
- Composite
- 43.68/100
- National rank
- #2955
- State rank
- #9 of 130 in MS
Livability — Long Beach
- Score
- 69/100
- State rank
- #52
- US rank
- #8554
Category grades
Schools grade is shown separately in the Schools card above.
Census & demographics
- Census place
- Long Beach, MS
- County
- Harrison County · 178,171 people
- City population
- 18,702
- Metro
- Gulfport-Biloxi, MS
- Population (ZIP)
- 18,702
- Household income
- $69,769
- Rent vs Own
- Severe rent burden
- 658.0
Population outlook (Harrison County) Hauer SSP2
- Today (2025)
- 228,444 people
- By 2030
- 241,942 · +5.9%
- By 2040
- 267,531 · +17.1%
- By 2050
- 291,062 · +27.4%
- By 2075
- 346,711 · +51.8%
- By 2100
- 378,165 · +65.5%
Race, ethnicity, and origin ACS 2023
- Neighborhood character
- Predominantly White (80%)
- Race & ethnicity
- White 80% Black 10% Two or more races 7% Hispanic / Latino 3% Asian 2%
- Common ancestry
- Lithuanian 6% Slovak 2% Serbian 1%
- Foreign-born
- 5% · Canada, South Korea
- Languages at home
- 94% English-only · Spanish 2% Other Indo-European 2% Tagalog/Filipino 1%
Political lean MEDSL · Harrison
- 2024 margin
- Strong R (+28.9) · D 35.0% · R 63.9% · Other 1.1%
- 2008→2024 swing
- -2.9pp toward R · 2008: -26.0pp · 2024: -28.9pp
- All cycles
- 2024: R+28.9 2020: R+25.2 2016: R+30.7 2012: R+26.6 2008: R+26.0
Not yet ingested
- Civics
- —
Market trends
- HPI YoY
- ▼ -67.49%
- Current HPI
- 195.0807
- Rent YoY
- ▲ 1.93%
- Metro
- Gulfport-Biloxi, MS
- State GDP YoY
- —
- F500 in state
- 0
Price history
+130.2% since first listed8 events — show timeline
- 2026-04-27 Pending — MLSU
- 2026-04-25 Listed $145,000 MLSU
- 2021-10-14 Sold (Public Records) — Public Records
- 2021-10-08 Sold (MLS) — MLSU
- 2021-08-24 Listed $137,000 MLSU
- 2015-06-02 Sold (Public Records) $53,500 Public Records
- 2015-05-29 Sold (MLS) — MLSU
- 2015-01-26 Listed $63,000 MLSU
Property tax history
+0.3%/yrLatest (2025): $2,089 · +5.5% YoY. Source: county tax records.
Cash-flow waterfall
monthlySold comps — $/sqft
last 12 mo · ≤1 miLoading sold comps…